Substantive progress
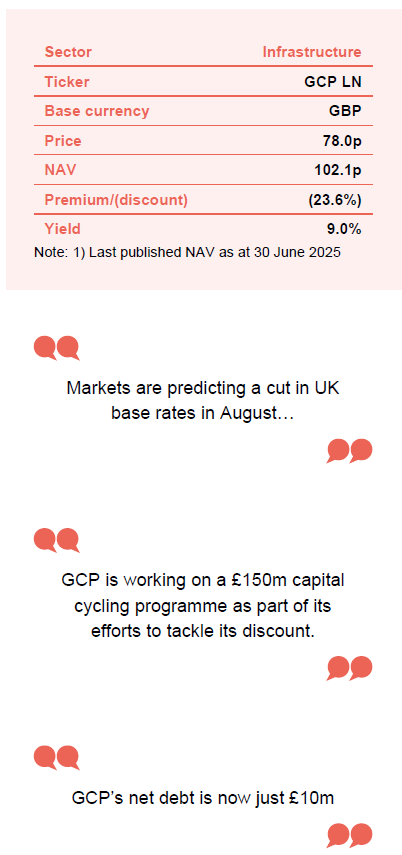
Since interest rates began to rise to tackle inflation, GCP Infrastructure (GCP) has, like many similar investment companies, been afflicted by a wide share price discount to net asset value (NAV). The board and the investment adviser have been working to tackle this through a policy of capital recycling. This aims to free up £150m to materially reduce the drawn balance on the revolving credit facility (RCF), return at least £50m to shareholders, and rebalance the portfolio to improve its risk adjusted returns.
As we discuss in this report, share buybacks have stepped up a gear, the discount is narrowing, the RCF has been reduced to just £10m, and the portfolio’s sensitivity to electricity prices has been cut significantly.
There is more to do, but – perhaps attracted by the high dividend yield and improving outlook – investors appear to be waking up to GCP’s attractions once again.
Public-sector-backed, long-term cashflows
GCP aims to provide shareholders with sustained, long-term distributions and to preserve capital by generating exposure primarily to UK infrastructure debt or similar assets with predictable long-term cashflows.
| Domicile | Jersey |
|---|---|
| Inception date | 22 July 2010 |
| Manager | Philip Kent |
| Market cap | 657.4m |
| Shares outstanding (exc. treasury shares) | 842.783m |
| Daily vol. (1-yr. avg.) | 1.343m shares |
| Net gearing | 1.2% |
At a glance
Share price and discount
GCP’s discount has narrowed somewhat since helped by share buybacks and a capital recycling programme aimed at providing solid evidence of the validity of the NAV; improving the overall quality of the portfolio (in particular, reducing the sensitivity to power price fluctuations); and providing cash to both fund returns to investors and to reduce its floating rate debt. We believe that the discount ought to narrow further from here.
Performance over five years
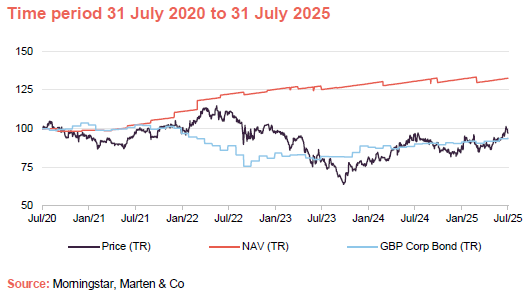
Despite the many headwinds facing the company in recent years, GCP’s NAV total return has remained positive and has held up fairly well, relative to the return from sterling corporate bonds.
It is encouraging to see the impact of a narrower discount on GCP’s share price returns, but there is hopefully even more to come.
| 12 months ended | Share price total return (%) | NAV total return (%) | Earnings1 per share (pence) | Adjusted2 EPS (pence) | Dividend per share (pence) |
| 30/09/2020 | (2.0) | (0.2) | (0.08) | 7.65 | 7.6 |
| 30/09/2021 | (7.9) | 7.2 | 7.08 | 7.90 | 7.0 |
| 30/09/2022 | 3.8 | 15.7 | 15.88 | 8.30 | 7.0 |
| 30/09/2023 | (25.2) | 3.6 | 3.50 | 8.58 | 7.0 |
| 30/09/2024 | 28.2 | 4.6 | 2.25 | 7.09 | 7.0 |
Company profile
Regular, sustainable, long-term income
GCP Infrastructure Investments Limited (GCP) is a Jersey-incorporated, closed-ended investment company whose shares are traded on the main market of the London Stock Exchange. GCP aims to generate a regular, sustainable, long-term income while preserving investors’ capital. The company’s income is derived from loaning money, predominantly at fixed rates, to entities which derive their revenue – or a substantial portion of it – from UK public-sector-backed cashflows. Wherever it can, it tries to secure an element of inflation protection.
In practice, GCP is diversified across a range of different infrastructure subsectors, although its focus has shifted more towards renewable energy infrastructure over the last few years. It has exposure to renewable energy projects (where revenue is partly subsidy and partly linked to sales of power), PFI/PPP-type assets (whose revenue is predominantly based on the availability of the asset), and specialist supported social housing (where local authorities are renting specially-adapted residential accommodation for tenants with special needs).
The board is targeting a full-year dividend of 7.0p per share for the financial year ended 30 September 2025. At the half-year mark, the trust was on track to achieve this, having declared dividends totalling 3.5p per share.
GCP had driven down the RCF balance to £41m by the end of March…
As we highlighted on the front page, GCP is working on a £150m capital cycling programme as part of its efforts to tackle its discount. Money freed up is being used to reduce GCP’s leverage. Drawings on the revolving credit facility (RCF) totalled £43m at end June 2025, down from £57m at end September 2024.
In its latest NAV announcement, GCP revealed that it had reached a settlement agreement in respect of the contractual claim relating to the accreditation of a portfolio of solar projects under the Renewables Obligation scheme (there was a question mark over whether some solar projects were eligible to receive government subsidies). This has been rumbling on for some time – we flagged it in our January 2021 note, for example.
…but with an influx of money from the settlement of a claim, GCP’s net debt is now just £10m
GCP had accrued an amount in the NAV for the anticipated settlement, and so this did not have much impact on the NAV. However, following receipt of the money, GCP’s net debt has fallen to about £10m, equivalent to gearing of just 1.2%.
GCP also intends to return at least £50m of capital to shareholders. We show its recent share buyback activity on page 12.
Market backdrop
Markets are predicting a cut in UK base rates in August, but persistent inflation and low/negative growth numbers are weighing on sentiment
UK economic growth numbers have been weak, with a fall in GDP reported for May, following on from another monthly contraction in April. In such an environment, the predictable income provided by GCP might seem all the more attractive.
The Bank of England cut its base rate to 4.25% in May 2025, but inflation figures have been coming in higher than expected, with UK CPI running at 3.6% and RPI (which is still used to inflate renewable energy subsidies) coming in at 4.4% in June. We could still see another interest rate cut in August, but until inflation is looking better-controlled, more aggressive rate-cutting seems unlikely.
10-year gilt yields, which arguably have a bigger influence on the rating of funds such as GCP than short-term rates, have been fairly flat this year. A number of commentators are concerned about levels of UK government debt, which may be influencing long-term bond yields.
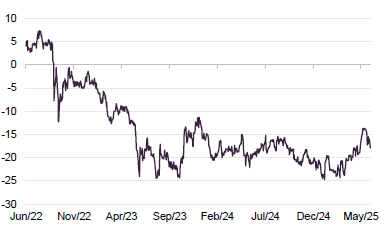
Figure 1: UK 10-year gilt yield
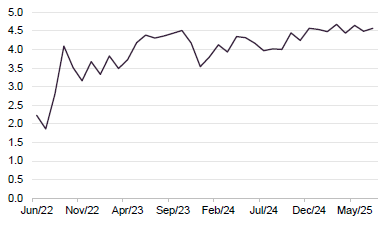
Source: Bloomberg
Figure 2: Median premium/(discount) on AIC infrastructure sector
Source: Morningstar, Marten & Co
BBGI bid underscored the attractive valuations on offer in the infrastructure sector
As illustrated in Figure 2, discounts on infrastructure trusts have narrowed from lows. One catalyst for this was the bid for BBGI Global Infrastructure (a portfolio of equity stakes in PFI/PPP-type infrastructure projects) at a premium to its NAV. GCP still has about 27% of its portfolio exposed to debt funding for PPP/PFI projects.
Plenty for GCP to do if it returns to making investments, but the discount will be fixed first
Talk is growing that a cash-constrained UK government will take a fresh look at PFI-type structures to fund much-needed infrastructure investment in areas such as schools, hospitals, and prisons. This could open up new opportunities for GCP, were it to return to making new investments. The GCP board has been quite clear that it will not consider doing do so until the discount has narrowed to a point where returns on new investments are higher than the return on investing in the existing portfolio through buybacks.
While we wait for decisions on the way forward for PFI, GCP has highlighted the considerable opportunity in financing the transition to a world of net zero greenhouse gas emissions. The UK government’s latest auction round for CfD finance for renewables projects – AR7 – is underway. In this auction round, more capital has been allocated, and fixed-price energy deals are available at higher prices and for longer periods.
The government’s review into electricity markets decided against adopting zonal pricing for electricity. The decision has been welcomed by most investors in generation assets, but it does mean that additional investment will be needed in energy storage and in grid infrastructure, as much of the UK’s energy generation is not in the same parts of the country as energy demand.
Portfolio
As of 30 June 2025, there were 48 investments in GCP’s portfolio (down from 50 when we last published). The average annualised portfolio yield was 7.9% (up from 7.8%), and the portfolio had a weighted average life of 11 years.
Recent investment activity
No new loans were made over H1 25, as the adviser was focused on GCP’s capital recycling programme. GCP does have commitments to advance loans to existing borrowers, however, and these totalled £13m over the first half of GCP’s financial year (H1 25), the six-month period ended 31 March 2025.
In terms of money coming back from the portfolio, the two big items were the sale of some rooftop solar assets for £6.8m in November 2024 (as referred to in our last note) and the sale of interests in two onshore wind farms in January 2025.
GCP had owned the windfarms since 2017. They fetched an initial £16.5m plus £1.3m of contingent proceeds and £1.0m of realised tax benefits. Although the proceeds were lower than the valuation in GCP’s end-September 2024 NAV, on average the company made a return of about 9.7% per annum on these assets.
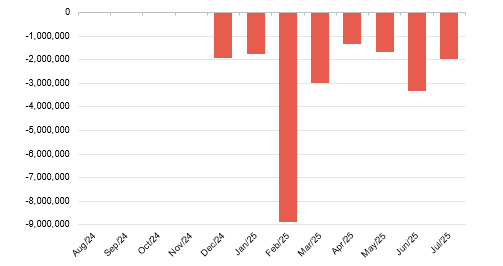
Figure 3: Outflows (investments) in £m
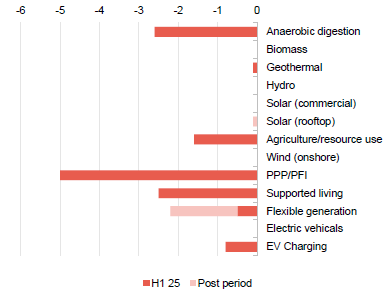
Source: Gravis Capital Partners
Figure 4: Inflows (repayments) in £m
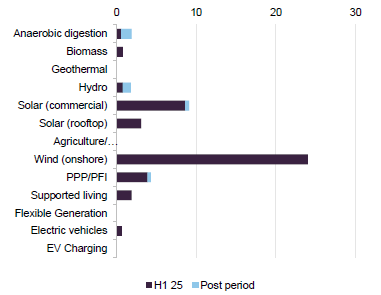
Source: Gravis Capital Partners
The disposals have had some effect on the split of GCP’s portfolio as shown in Figure 3, with the percentage exposure to onshore wind falling from 13% to 10% since we last published.
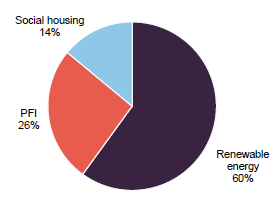
Figure 5: Split of the portfolio at 30 June 2025
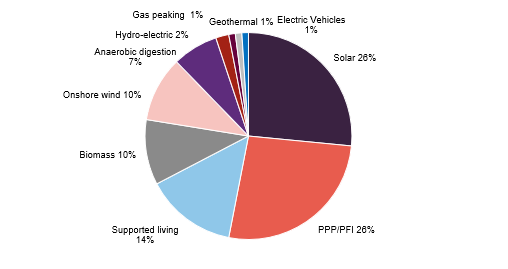
Source: GCP Infrastructure Investments
In terms of the sector split shown in Figure 5, renewables have fallen in favour of the other two sectors (as the pie shrinks). The portfolio also has slightly more exposure to higher ranking senior loans and less exposure to equity or equity like positions (which typically carry higher risk and return potential but rank lower in repayment priority).
The missing piece of the capital recycling programme is the planned disinvestment from GCP’s social housing exposure. We still expect that to happen.
Figure 6: Sector allocation at 30 June 2025
Source: GCP Infrastructure Investments
Figure 7: Security allocation at 31 March 2025
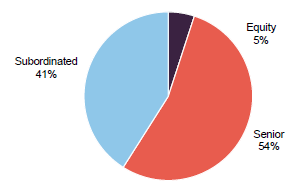
Source: GCP Infrastructure Investments
There was no significant change to the breakdown of GCP’s sources of income.
Figure 8: GCP sources of income as at 31 March 2025
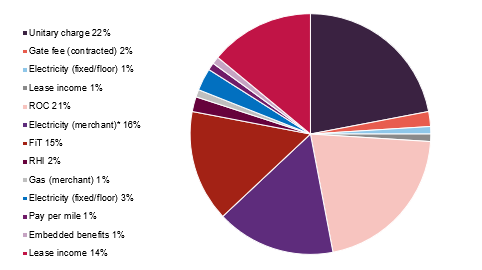
Source: GCP Infrastructure Investments
Top 10 investments
GCP’s largest investments tend to be special purpose vehicles set up to fund specific groups of assets.
One new vehicle has entered the top 10 (GCP Rooftop Solar Finance), replacing GCP Programme Funding S3, which was financing a portfolio of anaerobic digestion plants. GCP wrote down the value of some of these plants.
Figure 9: GCP’s 10 largest investments as at 31 March 2025
| % of total assets 31/03/25 | Cashflow type | Project type | |
|---|---|---|---|
| Cardale PFI | 13.4 | Unitary charge | PFI/PPP (18 projects) |
| Gravis Solar 1 | 9.4 | ROC/FiT | Commercial solar |
| GCP Programme Funding S14 | 5.7 | ROC/RHI/Merchant | Biomass |
| GCP Bridge Holdings | 5.1 | ROC/PPA | PPE – Energy-from-waste / Energy efficiency |
| GCP Biomass 2 | 5.0 | ROC/PPA | Biomass |
| GCP Programme Funding S10 | 4.9 | Lease | Supported living |
| GCP Social Housing 1 B | 4.0 | Lease | Supported living |
| Gravis Asset Holdings H | 4.0 | ROC/RHI | Onshore wind |
| GCP Green Energy 1 | 3.8 | ROC/PPA | Commercial solar/onshore wind |
| GCP Rooftop Solar Finance | 3.7 | FiT | Rooftop solar |
The list of revenue counterparties is not much changed since we last published. ENGIE Power Limited has entered the list replacing Total Gas and Energy Limited. In the list of project service providers, Veolia ES (UK) Limited, Urbaser, and Gloucester County Council have replaced Pentair, Atlantic Biogas, and Thyson.
Figure 10: Top 10 revenue counterparties
| Firm | % of total portfolio |
|---|---|
| Ecotricity Limited | 9.4 |
| Npower Limited | 7.3 |
| Viridian Energy Supply | 7.2 |
| Statkraft Markets GmbH | 5.9 |
| Bespoke Supportive Tenancies Limited | 5.1 |
| Office of Gas and Electricity Markets | 4.7 |
| Smartestenergy Limited | 4.5 |
| Good Energy Limited | 4.5 |
| Gloucestershire County Council | 4.2 |
| ENGIE Power Limited | 4.0 |
| Firm | % of total portfolio |
|---|---|
| WPO UK Services Limited | 20 |
| PSH Operations Limited | 13 |
| Solar Maintenance Services Limited | 10 |
| A Shade Greener Maintenance | 9 |
| Vestas Celtic Wind Technology Limited | 8 |
| Veolia ES (UK) Limited | 5 |
| Cobalt Energy Limited | 5 |
| Urbaser Limited | 4 |
| Gloucester County Council | 4 |
| 2G Energy Limited | 4 |
Sensitivities
The investment adviser also provides a sensitivity analysis for its cash flows. Based on a total fair value for GCP’s assets, a 0.5% increase in its discount rate would take about 3.0% off the total fair value. A 0.5% decrease in discount rates would add 3.2%.
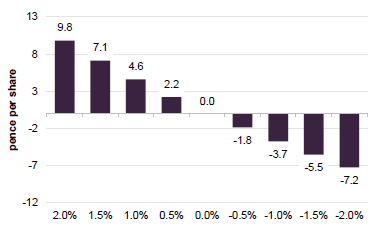
Figure 12: NAV impact of change in forecast electricity prices
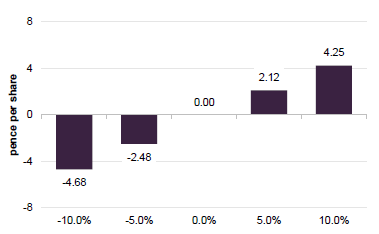
Source: GCP Infrastructure Investments
Figure 13: NAV impact associated with a movement in inflation
Source: GCP Infrastructure Investments
Clear evidence of reduced sensitivity to power prices
One of GCP’s aims for its capital recycling efforts is to reduce the portfolio’s sensitivity to fluctuations in power prices. Based on the numbers in Figure 10, it is achieving this. As at end March 205, a 10% fall in power price forecasts would take 4.68p off GCP’s NAV. Back at the end of September 2025, before the rooftop solar and onshore windfarm sales, that figure was 9.11p.
Higher inflation would be good news for GCP. Recent inflation figures suggest things are going its way in this respect. However, the quid pro quo for this tends to be higher for longer interest rates, which influence the discount rate. At end June 2025, the weighted average discount rate on the portfolio was 8.33%, marginally lower than the 8.36% number for end March. That just reflects principal and interest payments across the portfolio.
Conservative assumptions
As in previous reports, we have included a table (Figure 14) showing the impact of GCP’s conservative valuation assumptions on its NAV. The range shows what would happen to the NAV were GCP to adopt the most conservative or least conservative assumptions of peers when calculating its NAV. Whilst the sensitivity to power prices has fallen, it is still an important consideration. GCP uses the average of the last four quarterly power price curves produced by AFRY (a specialist consultancy that provides energy market forecasting and modelling used for long-term infrastructure valuations).
Figure 14: Valuation assumptions as at 31 March 2025
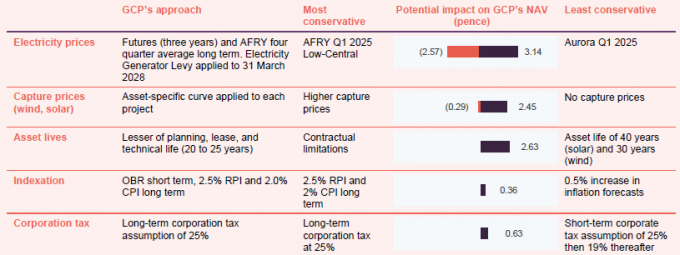
Source: GCP Infrastructure Investments
Performance
Despite the many headwinds facing the company in recent years, GCP’s NAV total return has remained positive and has held up fairly well, relative to the return from sterling corporate bonds as shown in Figure 16.
Figure 15: GCP NAV total return
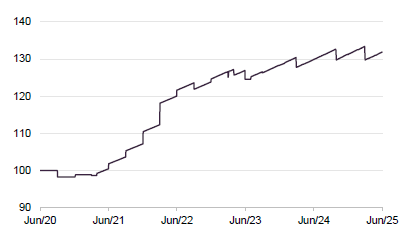
Source: Morningstar, Marten & Co
Figure 16: GCP NAV total return performance relative to sterling corporate bond performance

Source: Morningstar, Marten & Co
It is encouraging to see the impact of a narrower discount on GCP’s share price returns, but there is hopefully even more to come.
Figure 17: Cumulative total return performance over periods ending 30 June 2025
| 3 months (%) | 6 months(%) | 1 year(%) | 3 years (%) | 5 years (%) | |
|---|---|---|---|---|---|
| GCP share price | 5.3 | 8.6 | 0.3 | (13.9) | (3.2) |
| GCP NAV | 1.7 | 0.5 | 1.6 | 8.4 | 31.9 |
| Sterling corporate bonds | 3.1 | 3.5 | 5.6 | 8.7 | (4.7) |
The next section looks at what has been driving GCP’s NAV return since we last published.
The largest negative move relates to a change to the assumed life of a portfolio of gas-to-grid anaerobic digestion assets. GCP has an equity exposure to these assets after the borrower experienced problems.
Significant factors affecting NAV over H1 2025
Figure 18: Factors affecting the NAV over H1 25
| Driver | Description | Impact (£m) | Impact (pence per share) |
|---|---|---|---|
| Inflation forecast | Inflation movements in the period | 6.9 | 0.81 |
| O&M budget update | Revised operating budget reflecting improved forecast cash flows | 3.1 | 0.36 |
| Other upward movements | Other upward movements across the portfolio | 5.1 | 0.60 |
| Asset specific revaluations | Revised long-term availability forecast for a gas-to-grid anaerobic digestion portfolio | (24.5) | (2.87) |
| Actual performance | Lower-than-forecast renewables generation | (12.7) | (1.49) |
| Discount rates | Higher discount rates | (3.5) | (0.41) |
| Other | Other, including the impact of hedging | (0.4) | (0.05) |
| Total | (26.0) | (3.05) |
Premium/(discount)
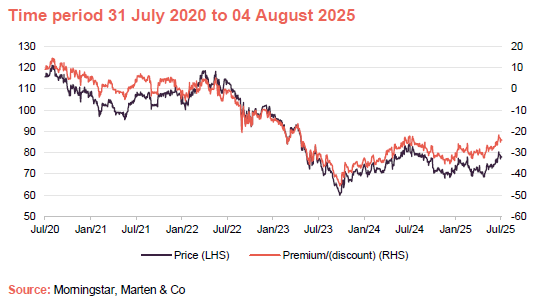
Over the past 12 months, GCP’s shares have traded on an average discount of 29.1%, a high of 22.2%, and a low of 35.3%. As of publishing, the discount stood at 23.6%.
Figure 19: GCP discount over five years ending 30 June 2025
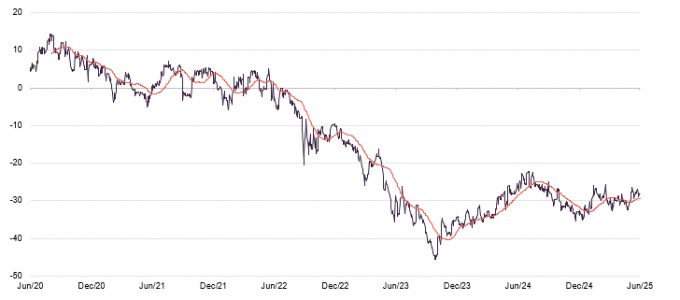
Source: Morningstar, Marten & Co
As discussed in previous notes, GCP’s discount widened over 2021 and 2022 as interest rates began to rise. The discount has narrowed somewhat since helped by share buybacks (as shown in Figure 20) and a capital recycling programme aimed at providing solid evidence of the validity of the NAV; improving the overall quality of the portfolio (in particular, reducing the sensitivity to power price fluctuations); and providing cash to both fund returns to investors and to reduce its floating rate debt. We believe that the discount ought to narrow further from here.
As Figure 20 illustrates, in pursuit of the capital recycling programme, GCP has now bought back over 23.8m shares, worth about £18.8m,
Figure 20: GCP share buybacks over past year
Source: Marten & Co
SWOT and bull vs. bear analysis
| Strengths | Weaknesses |
|---|---|
| Diversified portfolio across a range of infrastructure subsectors and borrowers | Relatively illiquid portfolio |
| Public-sector backed cashflows | Historically, GCP has exhibited more sensitivity to factors such as power prices than might be expected of a debt fund |
| Low gearing | Need to tackle persistent wide discount is preventing it from making new investments |
| Responds positively to higher inflation | |
| Conservative valuation assumptions | |
| Opportunities | Threats |
| Discount narrowing potential | Rising UK interest rates |
| Government needs private capital to fund infrastructure | While discount persists, vulnerable to activist investors |
| Bull | Bear | |
|---|---|---|
| Performance | Despite the odd setback, NAV has been relatively stable since launch | NAV returns have been on the low side in recent years, dragging down long-term averages |
| Dividends | Dividend looks increasingly reliable and headline yield is very attractive | Dividend cut in 2020 and flat dividend since at odds with rising returns from other debt investments |
| Outlook | Should be set fair if it can continue to deliver on its capital recycling programme | Need to see progress on social housing disposal that was flagged some time ago. Further delay/NAV writedown could undermine confidence |
| Discount | Discount appears to be on narrowing trend and there is more to go for | If confidence in UK economy and government finances was shattered, discount could widen again |
Previous publications
Readers interested in further information about GCP may wish to read our previous notes.
| IMPORTANT INFORMATION | ||
|---|---|---|
| Marten & Co (which is authorised and regulated by the Financial Conduct Authority) was paid to produce this note on GCP Infrastructure Investments Limited. This note is for information purposes only and is not intended to encourage the reader to deal in the security or securities mentioned within it. Marten & Co is not authorised to give advice to retail clients. The research does not have | regard to the specific investment objectives financial situation and needs of any specific person who may receive it. The analysts who prepared this note are not constrained from dealing ahead of it but, in practice, and in accordance with our internal code of good conduct, will refrain from doing so for the period from which they first obtained the information necessary to prepare the note | until one month after the note’s publication. Nevertheless, they may have an interest in any of the securities mentioned within this note. This note has been compiled from publicly available information. This note is not directed at any person in any jurisdiction where (by reason of that person’s nationality, residence or otherwise) the publication or availability of this note is prohibited. |
Accuracy of Content: Whilst Marten & Co uses reasonable efforts to obtain information from sources which we believe to be reliable and to ensure that the information in this note is up to date and accurate, we make no representation or warranty that the information contained in this note is accurate, reliable or complete. The information contained in this note is provided by Marten & Co for personal use and information purposes generally. You are solely liable for any use you may make of this information. The information is inherently subject to change without notice and may become outdated. You, therefore, should verify any information obtained from this note before you use it.
No Advice: Nothing contained in this note constitutes or should be construed to constitute investment, legal, tax or other advice.
No Representation or Warranty: No representation, warranty or guarantee of any kind, express or implied is given by Marten & Co in respect of any information contained on this note.
Exclusion of Liability: To the fullest extent allowed by law, Marten & Co shall not be liable for any direct or indirect losses, damages, costs or expenses incurred or suffered by you arising out or in connection with the access to, use of or reliance on any information contained on this note. In no circumstance shall Marten & Co and its employees have any liability for consequential or special damages.
Governing Law and Jurisdiction: These terms and conditions and all matters connected with them, are governed by the laws of England and Wales and shall be subject to the exclusive jurisdiction of the English courts. If you access this note from outside the UK, you are responsible for ensuring compliance with any local laws relating to access.
No information contained in this note shall form the basis of, or be relied upon in connection with, any offer or commitment whatsoever in any jurisdiction.
Investment Performance Information: Please remember that past performance is not necessarily a guide to the future and that the value of shares and the income from them can go down as well as up. Exchange rates may also cause the value of underlying overseas investments to go down as well as up. Marten & Co may write on companies that use gearing in a number of forms that can increase volatility and, in some cases, to a complete loss of an investment.
| QuotedData is a trading name of Marten & Co, which is authorised and regulated by the Financial Conduct Authority.50 Gresham Street, London EC2V 7AY0203 691 9430www.QuotedData.comRegistered in England & Wales number 07981621, 2nd Floor Heathmans House, 19 Heathmans Road, London SW6 4TJ |
|---|