
It’s a rollover!
JPMorgan European Growth and Income (JEGI) has been chosen as the default rollover option for the proposed reconstruction of European Opportunities Trust (EOT). JEGI investors will already be aware that the trust has the best long-term track record within its peer group. Any assets that rollover from EOT will help improve liquidity in JEGI’s shares and lower its ongoing running costs per share. For an EOT investor, there are the added benefits of a much higher dividend income, better track record of keeping the discount tight, and JEGI’s more diversified, risk conscious investment approach.
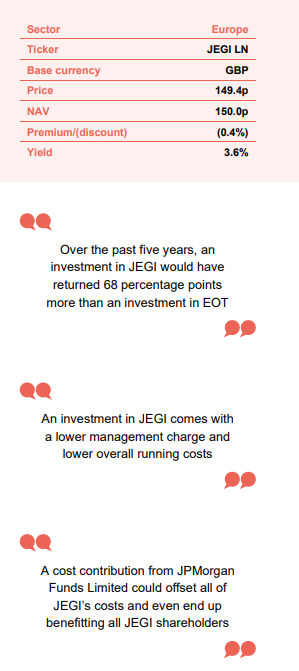
Capital growth and a 4% dividend on NAV
JEGI aims to provide capital growth and a rising share price over the longer term from a portfolio of Continental European investments, whilst taking carefully controlled risks. The company’s policy is to pay four dividends per financial year payable in June, September, December and March and based on 4% per annum of the NAV as at close of business on 31st March of the preceding financial year.
At a glance
Share price and discount
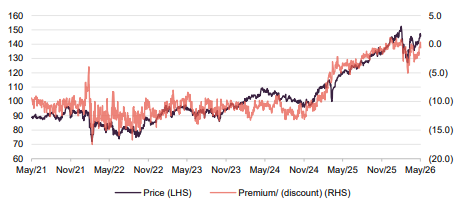
Over the 12 months to the end of May 2026, JEGI’s shares traded in a range of a 1.2% premium to NAV and a 5.3% discount to NAV. The average was a 1.7% discount. As at publication, JEGI was trading on a discount of just 0.4%. JEGI’s board has been active in keeping the discount tight. It uses buybacks to manage discount volatility and can issue shares when demand pushes the trust to a persistent premium.
Source: Bloomberg, Marten & Co
Performance over five years
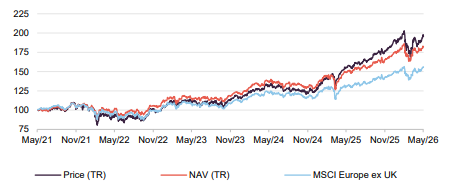
JEGI has delivered strong performance over the five years to 31 May 2026. Its share price total return was 95.6%, while its NAV total return was 83.0%, compared with 56.0% from the MSCI Europe ex UK index.
This means JEGI has been well ahead of its benchmark over the long term and has also come close to the MSCI World return, despite the dominance of US technology stocks in global markets.
Source: Bloomberg, Marten & Co
| 12 months ended | Share price total return (%) | NAV total return (%) | MSCI Europe ex UK TR (%) | MSCI World total return (%) |
|---|---|---|---|---|
| 31/05/2022 | (6.7) | 1.4 | (2.6) | 6.9 |
| 31/05/2023 | 17.9 | 11.3 | 8.3 | 4.0 |
| 31/05/2024 | 19.7 | 21.7 | 16.7 | 21.6 |
| 31/05/2025 | 17.9 | 8.5 | 6.4 | 7.5 |
| 31/05/2026 | 26.0 | 22.2 | 19.1 | 27.4 |
Source: Bloomberg, Marten & Co
Fund profile
Further information regarding JEGI can be found on the trust’s website
JPMorgan European Growth and Income Plc (JEGI) is a UK investment trust listed on the main market of the London Stock Exchange (LSE). The trust aims to allow growth-oriented investors to participate in the attractive long-term growth potential of European stock markets whilst also aiming to deliver a predictable dividend to income seekers.
JEGI’s AIFM is JPMorgan Funds Limited, which delegates responsibility for portfolio management to JPMorgan Asset Management (JPMAM). Three co-managers share responsibility for JEGI’s portfolio: Alexander Fitzalan Howard, Zenah Shuhaiber, and Tim Lewis. They have been co-managers on the trust for more than five years. Alexander has been managing it for over 20 years.
The trust dates back to 1929 and has been focused on Continental European investments since November 1988. In August 2006, the company divided its portfolio and its share capital into two pools – one focused on income (JETI) and the other focused on capital growth (JETG). With effect from 4 February 2022, the two pools were merged once again and JEGI adopted its current, simpler structure and a new name.
Default rollover option for European Opportunities
On 13 February 2026, ahead of a continuation vote scheduled for October 2026, the likelihood of a 25% performance-triggered tender offer, and after an extended period of poor absolute and relative performance, European Opportunities Trust (EOT) launched a strategic review.
On 29 May 2026, EOT said it would wind up and said it had selected JEGI as one of two rollover options (the other being an open-ended fund managed by EOT’s current manager). JEGI is both the default option and the only option that allows investors to remain invested in a listed investment company. EOT shareholders also have the choice of a full cash exit at a 2% discount to net asset value after costs.
The transaction is structured as a s110 scheme of reconstruction, whereby EOT is liquidated but investors who choose to rollover are not deemed to have made a disposal for capital gains tax purposes.
Benefits for EOT shareholders of the JEGI option
Better track record
Up-to-date information on JEGI is available on the QuotedData website.
JEGI has outperformed its benchmark by a decent margin over the long term both in share price and NAV terms. Indeed, shareholder returns are almost 40 percentage points ahead of the benchmark over five years. Remarkably, over five years, despite the dominance of US tech stocks within global indices, JEGI’s returns are not far off those of the MSCI World Index.
Figure 1: Cumulative total return performance over periods ending 31 May 2026
| 3 months(%) | 6 months (%) | 1 year (%) | 3 years(%) | 5 years1(%) | |
|---|---|---|---|---|---|
| JEGI share price | (3.6) | 10.3 | 26.0 | 77.7 | 95.6 |
| JEGI NAV | (2.1) | 9.9 | 22.2 | 61.4 | 83.0 |
| MSCI Europe ex UK | (0.6) | 9.1 | 19.1 | 47.9 | 56.0 |
| MSCI World | 7.2 | 9.5 | 27.4 | 66.6 | 85.3 |
| EOT share price | 5.5 | 4.7 | 5.6 | 22.0 | 27.8 |
| EOT NAV | 4.1 | 1.7 | 1.5 | 12.9 | 20.7 |
Over the past five years, an investment in JEGI would have returned 68 percentage points more than an investment in EOT
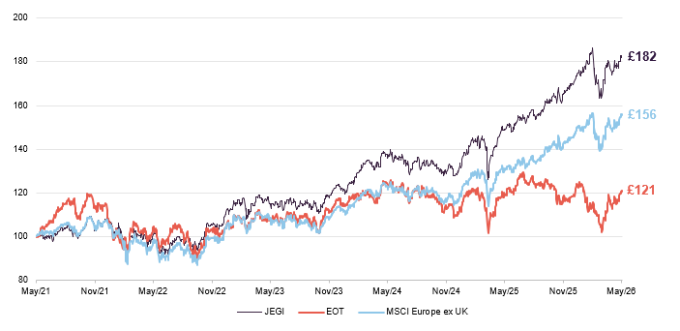
The contrast between JEGI’s returns and EOT’s is stark. In Figure 1, EOT is only ahead over the very short term and has lagged the benchmark index by over 28 percentage points over five years in share price terms and lagged JEGI by almost 68 percentage points over that period. The degree of underperformance is clear in Figure 2, which shows how the NAV returns of the two trusts have differed.
Figure 2: NAV total return performance of £100 invested in JEGI, EOT and MSCI Europe ex UK index over five years to 31 May 2026
As we explain in the investment approach section on page 8, JEGI is not managed in such a way that its success is determined by a particular geographic, sector, or individual stock exposure. By contrast, EOT investors have suffered on more than one occasion when outsized stock bets went sour.
Fees and charges
An investment in JEGI comes with a lower management charge and lower overall running costs
EOT pays its manager 0.65% on the first £400m of net assets, 0.60% on the next £200m, and 0.55% on any balance. There is no performance fee. The ongoing charges ratio for the financial year ended 31 May 2025 was 0.98%.
JEGI pays its manager 0.55% on the first £400m of net assets, and 0.40% on the balance. Again, there is no performance fee. The ongoing charges ratio for the financial year ended 31 March 2026 was 0.64%.
JEGI says that if 50% of EOT shareholders elect or are deemed to have elected for the JEGI rollover option, JEGI’s weighted average management fee would be 0.47% of NAV, a reduction of approximately 2.4 bps.
JEGI is targeting four interim dividend payments of 1.36p for its current financial year
Higher dividend income
JEGI’s board’s intention is to provide shareholders with a predictable and regular dividend based on 4% of the preceding year-end NAV. Payouts for the financial year ending in March 2027 are targeted to be 5.44p, paid in four equal instalments of 1.36p, which is an increase of 8.8% over FY26. Based on the latest share price, the current yield is 3.6%.
Figure 3: JEGI revenue income and dividend by financial year
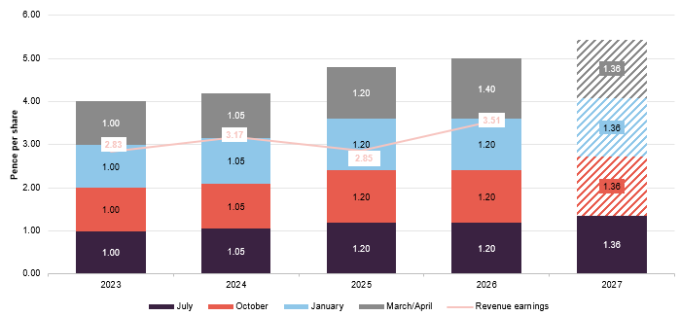
As at 31 March 2026, JEGI had distributable reserves totalling £419.0m and this compares to a total cost of dividends for FY26 of £26.1m.
EOT investors will benefit from a much higher dividend income
By contrast, EOT pays a single dividend each year sufficient to retain its investment trust status. At the time of publication, the dividend yield on EOT was 0.2%. EOT investors will benefit from a much higher dividend income.
Tighter discount
Over the 12-month period ended 31 May 2026, JEGI’s shares traded between a premium of 1.2% and discount of 5.3% to NAV. The average over that period was a 1.7% discount. As of publishing, JEGI was trading at a 0.4% discount.
JEGI’s shares have tended to trade on a tighter discount than EOT’s
By contrast, over the same period, EOT’s shares have traded between a 3.9% discount and a 9.8% discount, and have averaged a discount of 7.1%. As of publishing, EOT’s discount was 5.1%.
Whilst there have been occasions when EOT’s discount has been tighter than JEGI’s (normally associated with cash exit opportunities), the average discount for EOT over the five-year period that ended on 31 May 2026 was 10.8%, whereas the equivalent figure for JEGI was 9.0%.
Figure 4: JEGI premium/(discount) over five years to 31 May 2026
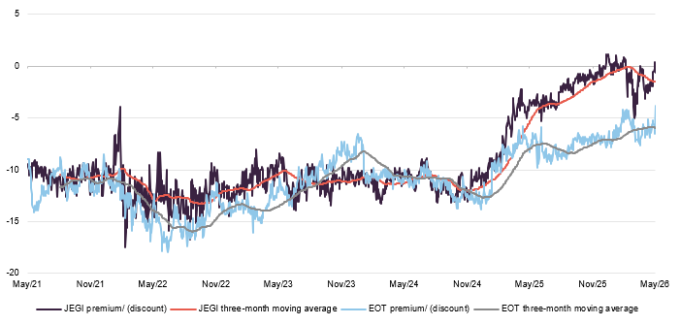
JEGI traded at a premium and was able to issue shares earlier this year
JEGI’s board uses share buybacks as a tool to manage the volatility and the absolute level of the discount. It has said that it does not wish to see the discount widen beyond 10% in normal market conditions. When the trust trades at a persistent premium, the company will issue shares to satisfy demand. Over the year to the end of March 2026, JEGI bought back 250,000 shares and reissued 600,000 shares from treasury. There has been no share issuance or buybacks since that date.
In addition, JEGI’s board believes (and we agree) that raising awareness of JEGI will benefit all shareholders by fostering ongoing interest in its shares, which in turn supports liquidity and growth. To that end, the manager has implemented a comprehensive marketing and investor relations strategy, reaching out to institutions, private client stockbrokers, and investment platforms through video calls, podcasts, and face-to-face meetings, and engaging with national and industry journalists.
Performance-related tender offer
JEGI is part way through a five-year performance measurement period that began on 4 February 2022. If, at the end of that period, JEGI has underperformed its benchmark, the board intends to propose a 25% tender offer at NAV (less costs). However, to date, JEGI has outperformed its benchmark by a considerable margin.
A cost contribution from JPMorgan Funds Limited could offset all of JEGI’s costs and even end up benefitting all JEGI shareholders
Cost contribution
JPMorgan Funds Limited has agreed to make a substantial contribution to the costs associated with the rollover, the size of which will be equivalent to the management fee it would be entitled to on the EOT assets that roll into JEGI for a 12-month period.
The cost contribution is being applied first against JEGI’s costs, with any balance applied next to reduce the cost burden suffered by EOT shareholders rolling into JEGI. This element of the cost contribution may be offset by the benefit to EOT shareholders that accrues from investors that take up the cash option at a 2% discount to NAV less costs. So, if there is an unallocated cost contribution after this step, any balance will go to the benefit of all JEGI shareholders.
Investment approach
Style tilts towards quality, value, and momentum
The managers’ investment approach is centred on their belief that attractively valued, high-quality stocks with positive operational momentum outperform the market over time. JEGI’s portfolio is constructed in such a way that it has style tilts towards quality, value, and momentum. The managers want to avoid reliance on a single stock, sector, or style as a driver of performance.
When evaluating stocks for JEGI’s portfolio, the managers are looking to answer three questions:
- Quality: is it a good business?
Is this a good quality business, considering its profitability, the sustainability of its earnings, and does it allocate capital in a disciplined and rational manner?
- Value: is it attractively valued?
Are the company’s future prospects reflected in its market valuation?
- Momentum: is the outlook for the stock improving?
What does the operational momentum of the business and its sector look like?
The research process draws on JPMAM’s considerable resources and incorporates both quantitative and rigorous fundamental analysis. Meetings with management and site visits are an important part of this. The outputs of this research are captured within Spectrum, JPMorgan’s proprietary technology platform.
An analysis of aspects of ESG is embedded within the research process. JPMAM is an engaged and responsible investor, seeking to vote where possible at all meetings called by the companies in which it is invested, for example.
“Bets” relative to the benchmark are constrained within predefined limits
Risk is managed, in part, through investment guideline limits on overall exposures. Active positions taken in stocks should not be more than 2% away from the benchmark weight (there is an overall maximum exposure to a single stock of 15%). For sectors and geographic exposures, the active limit is +/- 5%.
Portfolio sensitivity to a range of macroeconomic factors (the direction of US interest rates, for example) and specific themes (the increased emphasis on defence spending in Europe, for example) is monitored through a risk dashboard.
JEGI does invest in smaller European companies directly but also has an investment in JPMorgan European Discovery Trust (JEDT).
JEGI does not normally invest in unquoted investments.
Market backdrop
The managers observe that ahead of the outbreak of war between the US/Israel and Iran, investors had been more positive on Europe than they had been for some time (citing Morningstar data showing €66bn of net inflows into European equity-focused funds over 2025/26), and that was being reflected in share prices. They believe that the macroeconomic environment is supportive for Europe and that JEGI’s portfolio offers a number of different potential sources of alpha.
Figure 5: Europe ex UK index’s performance relative to the global index
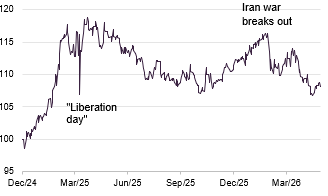
Figure 6: P/E ratios for European sectors versus global averages
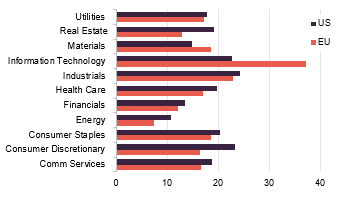
The managers feel that European equities remain relatively attractively valued. As Figure 6 shows, based on current year P/E ratios, US stocks are more expensive than European ones in all but two sectors – information technology, where the data is skewed by ASML, and materials. The managers also believe that market volatility is creating more opportunities for active managers to add value.
Figure 7: Navigating volatility – JEGI and MSCI Europe ex UK index since end June 2021
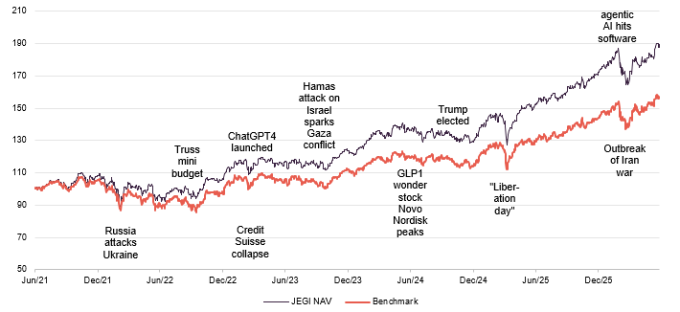
Long running themes affecting EU markets include the ongoing conflict on Europe’s doorstep between Russia and Ukraine, and the drive to achieve Net Zero, which is supported by the need to improve energy security as the Ukrainian conflict drags on and the on/off closure of the Strait of Hormuz underlines the fragility of relying on the Gulf. Companies in JEGI’s portfolio that are beneficiaries of this include EON and Siemens Energy.
Figure 8: % annualised change in govt. spending
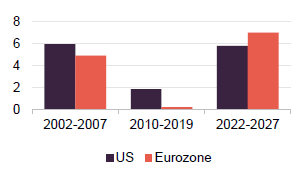
One tailwind that JEGI’s managers have identified is a willingness by European governments to boost fiscal stimulus, particularly in areas such as infrastructure and defence. This follows a prolonged period of constrained government investment (as evidenced in Figure 8) and, importantly, the managers think that this is only just beginning. Most notably, there was the German plan to create a €500bn infrastructure fund, which is funding upgrades to the power grid, net zero projects, and transport infrastructure, whilst allowing more borrowing for a greatly expanded defence budget and funnelling more money into regional coffers.
Companies in JEGI’s portfolio that the manager sees as beneficiaries of this include Swiss power components business ABB and French defence business Thales.
The managers also say that, in recognition of the damage that they have done to Europe’s global competitiveness, regulations are being eased, which should help build higher quality companies with improved profitability.
Figure 9: EU Generic 10-year govt. bond yield
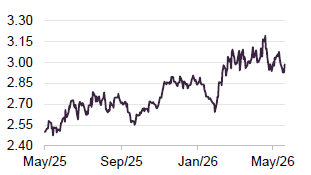
A couple of big themes have been dominating markets recently, most notably the advances in AI, and the war between the US/Israel and Iran.
On the former theme, the enormous sums being invested in data centres are benefitting companies that JEGI owns such as semiconductor business ASML and Legrand, a capital goods company. Software stocks perceived as threatened by agentic Ai dived in February this year.
On the latter theme, there has been concern about higher inflation and whether that will put upward pressure on borrowing costs. That shows up in the spike in bond yields in early March 2026.
Figure 10: JEGI relative performance attribution for 12 months ended 30 April 2026
| Top contributors | Relative weight (%) | Stock return (%) | Impact (%) |
|---|---|---|---|
| ABB | 1.09 | 89.35 | 0.63 |
| Prysmian | 0.55 | 172.22 | 0.51 |
| ENGIE | 1.13 | 62.67 | 0.46 |
| Siemens Energy | 0.40 | 172.04 | 0.41 |
| SBM Offshore | 0.58 | 88.31 | 0.40 |
| Top detractors | Relative weight (%) | Stock return (%) | Impact (%) |
| BBVA | – | 64.53 | (0.41) |
| Nokia | – | 150.75 | (0.38) |
| Eni | – | 101.08 | (0.27) |
| Scout24 | 0.60 | (30.65) | (0.26) |
| CSG | 0.09 | (44.17) | (0.26) |
Many of these themes are represented in JEGI’s performance attribution figures for the 12-month period that ended on 30 April 2026, which are shown in Figure 10.
ABB, Prysmian, and Siemens Energy are beneficiaries of the need to invest in power infrastructure. ABB (abb/group) makes much of the equipment used in upgrading power grids: items such as circuit breakers, for example. Prysmian (prysmian.com) makes cables used in transmission, power grids, and digital infrastructure. Siemens Energy (siemens-energy.com) makes equipment used in energy transmission and is also one of a few global players in the gas turbine market. Gas turbines have been in great demand, and the company has a strong order book.
Engie (engie.com) is a French power utility with a diversified portfolio of 103GW of energy generation assets and storage assets. It recently acquired UK Power Networks. The managers like the company’s geographic diversification as it makes it more resilient to the whims of any particular government. Engie plans to invest over €34bn to expand this by 38GW and add 4,000km of power transmission lines by 2030. Aside from this considerable growth potential, part of the attraction of the company is the shift in the balance of its revenue towards longer duration contracts. As its revenues become more predictable, there is scope for a re-rating.
SBM Offshore (sbmoffshore.com) supplies FPSOs (floating production, storage, and offloading vessels) to the offshore oil & gas industry. It has a strong presence in Brazil and Guyana and has been winning new business in this area. However, JEGI’s managers say that part of the increased attraction of the stock is that it has been transitioning towards more of an asset-light model, which is boosting its profitability.
Within the detractors, the top three were stocks that JEGI does not hold. JEGI may not hold BBVA (bbva.com), but it does have a decent level of exposure to other banks, which have been doing well as investors recognise that they have cleaned up their balance sheets and rebuilt reserves and are now ready to focus on revenue growth. The higher for longer interest rate environment means that they can sustain healthy net interest margins, and at the same time, there is the potential to use AI to cut costs, boosting margins.
Nokia (nokia.com) is a winner of the AI hardware boom as it owns a US manufacturer of optical networking technology and photonic chips, which are used in data centres.
Italian energy business Eni has been a beneficiary of elevated energy prices.
Scout24 (scout24.com) is a German equivalent of Rightmove. It has been seen as threatened by agentic AI, but the JEGI managers dispute that description and believe its business will be resilient to AI competitors.
CSG (csg.com) is a stock that JEGI bought when it IPO’d in January 2026. It is a Czech ammunition business, which should mean that, like Thales, it is a beneficiary of the considerable ramp up in defence spending. However, the company was the subject of an activist short-seller report, which drove down its share price.
Portfolio – asset allocation
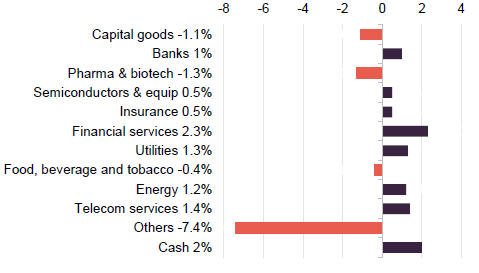
The following charts show JEGI’s geographic and sectoral asset allocation. As you might expect from the investment approach, the deviations from the benchmark weightings are well within prescribed limits.
Figure 11: Geographic allocation as at 31 May 2026
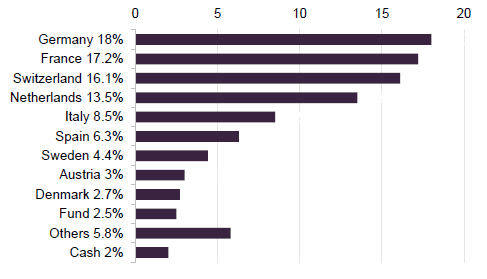
Figure 12: Geographic allocation relative to the benchmark
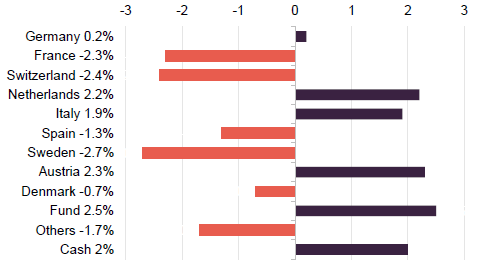
Figure 13: Sectoral allocation as at 31 May 2026
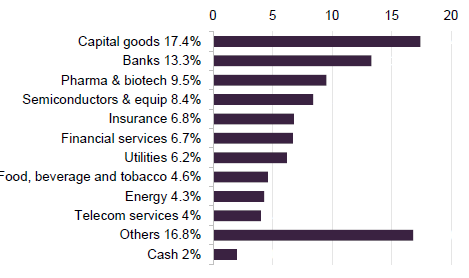
Figure 14: Sectoral allocation relative to the benchmark
Top 10 holdings
Figure 15 shows a list of JEGI’s 10 largest holdings as at 31 May 2026 and how their portfolio weights have changed since the interim results as at the end of September 2025. The largest move is in the exposure to ASML, which has seen an 94% uplift in its share price since that date on the back of the vast sums being invested in AI infrastructure. ASML makes the machines that make the highest specification chips.
Figure 15: Top 10 holdings as at 31 May 2026
| Holding | Sector | Country | Allocation 31 May 2026 (%) | Allocation 30 Sep 2025 (%) | Percentage point change |
|---|---|---|---|---|---|
| ASML | Semiconductors and equip. | Netherlands | 6.0 | 3.9 | 2.1 |
| Roche | Pharma and biotech | Switzerland | 3.5 | 3.0 | 0.5 |
| Novartis | Pharma and biotech | Switzerland | 3.0 | 3.4 | (0.4) |
| Nestle | Food, beverage, and tobacco | Switzerland | 3.0 | 2.6 | 0.4 |
| ABB | Capital goods | Switzerland | 2.8 | 2.1 | 0.7 |
| Siemens | Capital goods | Germany | 2.6 | 2.8 | (0.2) |
| JPMorgan European Discovery | Investment company | Europe | 2.5 | 2.5 | – |
| Banco Santander | Banks | Spain | 2.4 | 2.2 | 0.2 |
| UniCredit | Banks | Italy | 2.4 | 2.3 | 0.1 |
| TotalEnergies | Energy | France | 2.3 | 1.6 | 0.7 |
| Total of top 10 | 30.5 |
The data in Figure 16 may be more interesting as it represents JEGI’s largest overweight exposures to the benchmark. However, the managers stress the importance of diversifying the portfolio so that, even if there is a theme in which they have strong conviction, it will be expressed through more than one position.
Figure 16: Top 10 overweight positions relative to the benchmark as at 31 May 2026
| Holding | Sector | Country | Allocation 31 May 2026 (%) | Benchmark weight 31 May 2026 (%) | JEGI overweight(%) |
|---|---|---|---|---|---|
| ABB | Capital goods | Switzerland | 3.0 | 1.5 | 1.5 |
| UniCredit | Financials | Italy | 2.5 | 1.1 | 1.4 |
| Engie | Energy | France | 1.8 | 0.5 | 1.3 |
| Danske Bank | Financials | Denmark | 1.3 | 0.3 | 1.0 |
| Roche Holding | Pharma and biotech | Switzerland | 3.8 | 2.8 | 1.0 |
| SPIE SA | Capital goods | France | 1.0 | 0.0 | 1.0 |
| E.ON | Energy | Germany | 1.4 | 0.4 | 0.9 |
| BAWAG Group | Financials | Austria | 1.0 | 0.1 | 0.9 |
| Banco Santander | Financials | Spain | 2.6 | 1.7 | 0.9 |
| TotalEnergies | Energy | France | 2.4 | 1.6 | 0.9 |
| Total of top 10 | 20.8 | 10.0 | 10.8 |
As discussed above, ABB is a play on the investment in power infrastructure. The managers observe that the stock’s valuation multiple has risen but this reflects higher growth prospects.
Engie was also discussed above, like E.ON it represents a play on the increasing predictability of earnings for power generation companies.
UniCredit, Danske Bank, and Banco Santander provide diversified exposure to the theme of the increasing profitability of European banks. These businesses have been announcing strong results. There is some consolidation underway within the sector, too. UniCredit is in the throes of buying Commerzbank, for example. As balance sheets are much healthier, the focus can now switch towards loan growth.
Structure
Capital structure
JEGI has a simple capital structure with one class of ordinary share in issue. JEGI’s ordinary shares have a premium main market listing on the LSE and, as at 30 June 2026, there were 436,986,529 in issue, 14,620,341 of which were held in in treasury. Therefore, the number of shares in issue with voting rights was 422,366,188.
At 31 March 2026, the only notifiable interests in JEGI’s shares were City of London Investment Management with 9.9% and Allspring Global Investments Holdings with 4.7%. However, JPMAM says that as at end of May the three largest shareholders were the three largest platforms, in aggregate accounting for c.43% of the register.
Gearing and hedging
JEGI has the ability to use borrowing to gear the portfolio within the range of 10% net cash to 20% geared in normal market conditions. Net gearing was 5.6% as of 1 July 2026.
Currency hedging is permitted but only with the aim of mitigating risk relative to the benchmark index.
Subject to approval of a change to its investment policy at the forthcoming AGM, JEGI may use CFDs for efficient portfolio management and to provide gearing. JEGI may also use covered calls (up to a maximum of 7.5% of gross assets), as a way of generating income, for example. We expect that shareholders will back this proposal – similar policies have served other trusts well.
The company has the benefit of €50m nominal of private placement notes which are not repayable until 26 August 2035 and pay a fixed rate of 2.69% per annum interest.
Unlimited life
JEGI has been established with an unlimited life.
Financial calendar
The trust’s year-end is 31 March. The annual results are usually released in June (interims in November), and its AGMs are usually held in July of each year. The next AGM is scheduled for 22 July 2026. JEGI pays quarterly dividends in June, September, December, and March each year.
Board
JEGI’s board is composed of five directors, all of whom are non-executive and are considered to be independent of the investment manager.
All directors submit themselves for re-election annually. The board does not believe that length of service in itself necessarily disqualifies a director from seeking reappointment but, when making a recommendation, the board will take into account the ongoing requirements of the UK Corporate Governance Code, including the need to refresh the board and its committees. The directors’ biographies are available on the trust’s website.
Figure 17: Board member – length of service and shareholdings
| Director | Position | Date of appointment | Length of service | Annual fee (GBP) | Shareholding |
|---|---|---|---|---|---|
| Rita Dhut | Chair | June 2019 | 7.0 | 48,750 | 55,422 |
| Andrew Robson | Chair of the audit committee | February 2024 | 2.3 | 39,750 | 25,000 |
| Karen McKellar | Chair of the management committee | November 2021 | 4.6 | 33,500 | 30,000 |
| Alexander Lennad | Non-executive director | July 2021 | 4.9 | 33,500 | 20,000 |
| Guy Walker | Senior independent director and chair of the nomination committee | February 2021 | 5.3 | 33,500 | 26,256 |
Important Information
Marten & Co (which is authorised and regulated by the Financial Conduct Authority) was paid to produce this note on JPMorgan European Growth and Income Plc.
This note is for information purposes only and is not intended to encourage the reader to deal in the security or securities mentioned within it.
Marten & Co is not authorised to give advice to retail clients. The research does not have regard to the specific investment objectives financial situation and needs of any specific person who may receive it.
The analysts who prepared this note are not constrained from dealing ahead of it but, in practice, and in accordance with our internal code of good conduct, will refrain from doing so for the period from which they first obtained the information necessary to prepare the note until one month after the note’s publication. Nevertheless, they may have an interest in any of the securities mentioned within this note.
This note has been compiled from publicly available information. This note is not directed at any person in any jurisdiction where (by reason of that person’s nationality, residence or otherwise) the publication or availability of this note is prohibited.
Accuracy of Content: Whilst Marten & Co uses reasonable efforts to obtain information from sources which we believe to be reliable and to ensure that the information in this note is up to date and accurate, we make no representation or warranty that the information contained in this note is accurate, reliable or complete. The information contained in this note is provided by Marten & Co for personal use and information purposes generally. You are solely liable for any use you may make of this information. The information is inherently subject to change without notice and may become outdated. You, therefore, should verify any information obtained from this note before you use it.
No Advice: Nothing contained in this note constitutes or should be construed to constitute investment, legal, tax or other advice.
No Representation or Warranty: No representation, warranty or guarantee of any kind, express or implied is given by Marten & Co in respect of any information contained on this note.
Exclusion of Liability: To the fullest extent allowed by law, Marten & Co shall not be liable for any direct or indirect losses, damages, costs or expenses incurred or suffered by you arising out or in connection with the access to, use of or reliance on any information contained on this note. In no circumstance shall Marten & Co and its employees have any liability for consequential or special damages.
Governing Law and Jurisdiction: These terms and conditions and all matters connected with them, are governed by the laws of England and Wales and shall be subject to the exclusive jurisdiction of the English courts. If you access this note from outside the UK, you are responsible for ensuring compliance with any local laws relating to access.
No information contained in this note shall form the basis of, or be relied upon in connection with, any offer or commitment whatsoever in any jurisdiction.
Investment Performance Information: Please remember that past performance is not necessarily a guide to the future and that the value of shares and the income from them can go down as well as up. Exchange rates may also cause the value of underlying overseas investments to go down as well as up. Marten & Co may write on companies that use gearing in a number of forms that can increase volatility and, in some cases, to a complete loss of an investment.