A whole new ball game
Nicholas Weindling, one of the co-managers of JPMorgan Japanese Investment Trust (JFJ), observes that the investment landscape in Japan has changed almost beyond recognition from the picture that has persisted for most of the last few decades. The country is now seeing inflation, rising interest rates and wage rises – trends that have been absent for many years. At the same time, political shifts, higher defence spending, and – crucially for investors in the country – a more dynamic corporate culture are reshaping Japan’s economy.
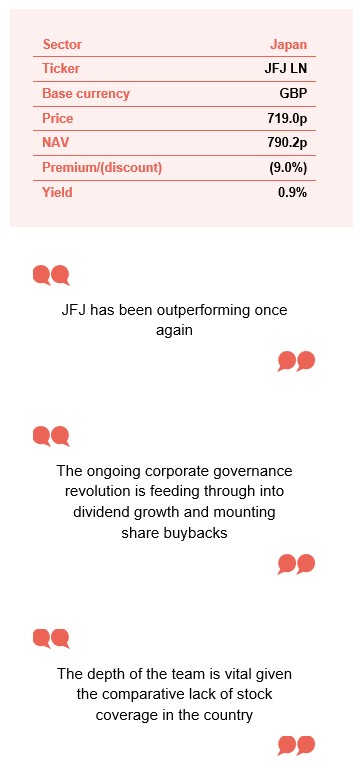
JFJ is focused on companies with strong growth potential. This approach was out of favour a few years ago; but has worked well recently with JFJ outperforming its benchmark. JFJ can boast decent absolute and relative gains this year, and the managers see much more to play for.
Capital growth from Japanese equities
JFJ aims to produce capital growth from a portfolio of Japanese equities and can use borrowing to gear the portfolio within the range of 5% net cash to 20% geared in normal market conditions. The trust is benchmarked against the returns of the Tokyo Stock Exchange Index (commonly known as TOPIX) in sterling.
At a glance
Share price and discount
Over the 12 months to the end of September 2025, JFJ’s discount to NAV moved within a range of 14.4% to a 6.9%, averaging 10.4%. At the time of publishing, the discount was 9.0%.
Whilst, as noted above, JFJ’s discount to NAV is around the middle of its peer group, it still feels too wide to us given the managers’ long-term track record and the encouraging outlook for the trust and the country.
Time period 30 September 2020 to 24 October 2025
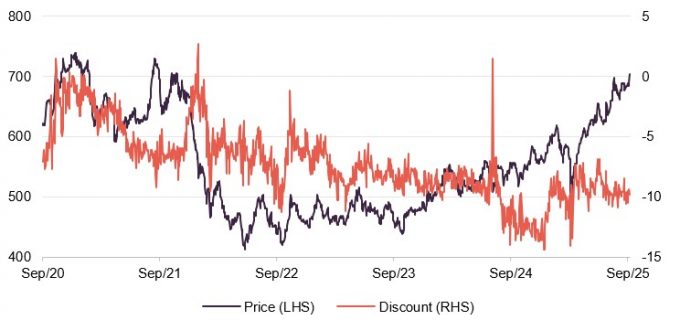
Source: Bloomberg, Marten & Co
Performance over five years
As we have discussed in previous notes (see page 22 for a list of these), JFJ lost ground against its benchmark over 2021 as more growth-focused stocks struggled, triggered by rising interest rates across Japan’s developed market peers. What the five-year chart misses out now is the considerable outperformance delivered by JFJ over 2020; to a large extent, the experience in 2021 was just the unwinding of that.
Time period 30 September 2020 to 30 September 2025
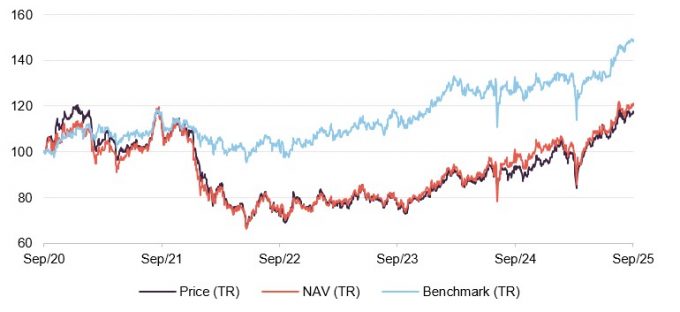
Source: Bloomberg, Marten & Co
| 12 months ended | Share price total return (%) | NAV total return (%) | Topix total return (%) | MSCI ACWI total return (%) | MSCI Japan total return (%) |
|---|---|---|---|---|---|
| 30/09/2021 | 11.0 | 10.7 | 15.9 | 22.8 | 17.6 |
| 30/09/2022 | (35.2) | (34.8) | (13.5) | (3.6) | (14.3) |
| 30/09/2023 | 6.4 | 8.1 | 14.6 | 10.7 | 15.1 |
| 30/09/2024 | 22.4 | 24.1 | 10.8 | 20.5 | 11.2 |
| 30/09/2025 | 24.9 | 25.0 | 17.2 | 17.3 | 16.2 |
Fund profile and approach
Further information about the trust is available at www.jpmjapanese.co.uk
JPMorgan Japanese Investment Trust (JFJ or the trust) aims to achieve capital growth from investments in Japanese companies. For performance-monitoring purposes, the trust is benchmarked against the returns of the Tokyo Stock Exchange Index (commonly known as TOPIX) in sterling.
In October 2024, JFJ acquired about £144m of the assets of JPMorgan Japan Small Cap Growth & Income (JSGI), issuing 23,365,110 new shares in exchange. The merger of the two JPMorgan funds increased the net assets of JFJ to approximately £1bn, making it comfortably the most liquid and largest investment company focused on Japan.
The trust may make use of both long- and short-term borrowings with the aim of increasing returns. We discuss JFJ’s approach to gearing on page 18.
Day-to-day investment management activity is the responsibility of JPMorgan Asset Management (Japan) Limited in Tokyo, where JPMorgan has had an office since 1969.
The co-investment managers are Nicholas Weindling, who has had responsibility for JFJ’s portfolio for more than a decade, Miyako Urabe, who was appointed co-manager in May 2019, and Xuming Tao, who was appointed around the time of the publication of JFJ’s interim report in May 2025 (see page 19 for more detail).
They are supported by a well-resourced team of 137 members in JPMorgan Asset Management’s broader emerging markets and Asia Pacific team, 26 of whom are dedicated to analysing and investing in Japanese equities. Visiting companies is an integral part of the team’s investment process, and having a team on the ground that speaks Japanese has been beneficial to JFJ’s returns.
The managers can also draw on the expertise of JPMorgan’s analytical teams around the world. There are stocks in the portfolio where an opportunity was identified as a by-product of research being conducted on US competitors, for example.
We discussed the investment approach in detail in our March 2023 note, which you can read here.
High-quality companies that are capable of compounding their earnings sustainably over the long term.
The investment emphasis is on identifying high-quality companies that are capable of compounding their earnings sustainably over the long term. That means investing in companies in growing industries that have strong balance sheets and are resilient in the face of macro-economic issues.
Stocks are classified as premium, quality, standard, and challenged/unclassified. At the end of September 2025, JFJ’s portfolio had 9.2% of its portfolio classified as premium (versus 4.9% for all stocks in its benchmark), 56.0% classified as quality (versus 23.1%), 48.2% classified as standard (versus 53.8%, and just 0.3% in challenged or unclassified companies (versus 18.3%).
The managers build a high-conviction portfolio (62 holdings at the end of September 2025), which may differ significantly from the performance benchmark (typically the active share is over 80%).
The depth of the team is vital given the comparative lack of stock coverage in the country. In our March 2023 note we included an earlier version of Figure 1, using data as at the end of October 2022. Remarkably, the percentage of Japanese companies with no analyst coverage has actually gone up since then.
In addition, the managers observe that much of the analysis that is performed is short-term in nature. The JFJ team makes a point of considering the outlook for a company over a five-year timeframe.
Figure 1: Stock coverage by sell-side analysts
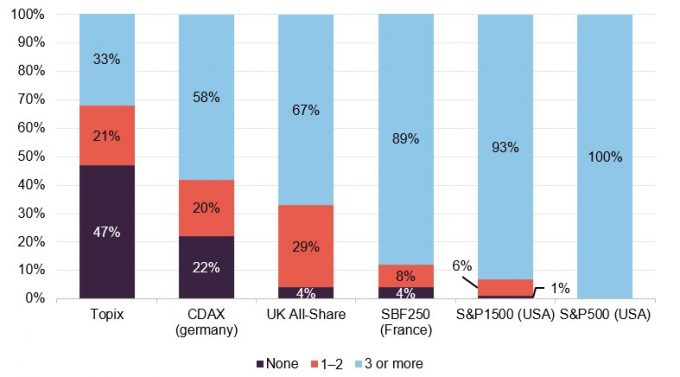
Source: JPMAM, Jefferies, Factset. Data as at 30 September 2024
Potential investments are analysed in respect of their environmental, social and governance (ESG) attributes, and the management team will engage with companies where necessary. A standardised checklist of 40 questions reveals “red flags”. As might be expected, the stocks in JFJ’s portfolio tend to have fewer red flags than the benchmark average (11.4 as at the end of September 2025 versus 13.8 for the benchmark).
Market backdrop
The message from JFJ’s managers is that the Japanese economy is in a very different place from where it has been for decades.
Inflation creates an impetus to put more into assets such as equities
Inflation is positive and seems sticky, which is having a number of impacts. For example, meaningful wage rises should be positive for consumer spending, and interest is now being earned on the considerable cash balances that dominate household savings, but these are now being eroded in real terms. This provides an impetus to put more into assets such as equities, which make up a far smaller proportion of household wealth than in the US and Europe.
Figure 2: Japan CPI YOY
Figure 3: Japan Shuntou annual wage rises
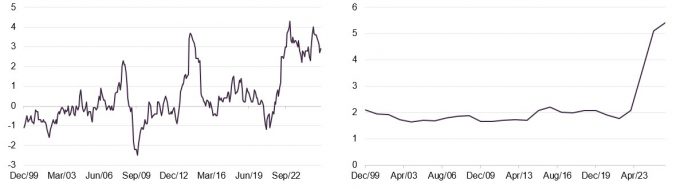
Source: Bloomberg
Source: Bloomberg, Marten & Co
At the same time, the ongoing corporate governance revolution (changes made to improve the systems, rules, and practices that govern how companies are managed and held accountable) that we have discussed in past notes is feeding through into dividend growth and greater use of share buybacks.
Figure 4: Household savings
Figure 5: Announced share buybacks
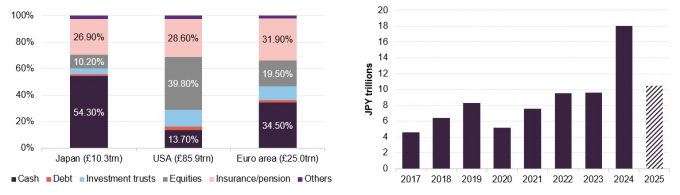
Source: CLSA as at 30 May 2023
Source: Goldman Sachs, data as of 15 May 2025
The managers see more to go for on this front as businesses rationalise, closing or selling off unprofitable divisions and focusing on core competencies (work carried out by Jefferies earlier this year revealed that on average just 35% of Japan’s companies’ revenues are derived from their core business, compared with around two-thirds in Europe and the US), and returning more surplus cash to investors (Goldman Sachs suggested that around half of all Japanese listed companies had net cash on their balance sheets in May this year, compared with less than 20% of US and European companies).
Work done by Jefferies suggests that Japan’s average return on equity could rise from 10.3% in March 2027 to 12.8% if companies sold their non-core divisions and returned surplus cash to shareholders. As we discuss on page 11, you can see the benefits of such policies in practice by observing the progress made at IHI, for example.
Foreign investors are still very underweight Japanese equities
Despite the obviously improving environment and rising earnings in Japan, foreign investors are still very underweight Japanese equities. That implies that there is scope for a further re-rating of a market that still trades at a significant discount to the US.
As with most other markets around the globe, the Japanese market was knocked by the announcement of Trump’s “Liberation Day” tariffs, which were initially set at 24% for Japanese goods entering the US. Markets rebounded when he backtracked from that just days later. However, in July, the two countries reached a trade deal based on 15% tariffs on Japanese goods entering the US, and the Japanese market jumped.
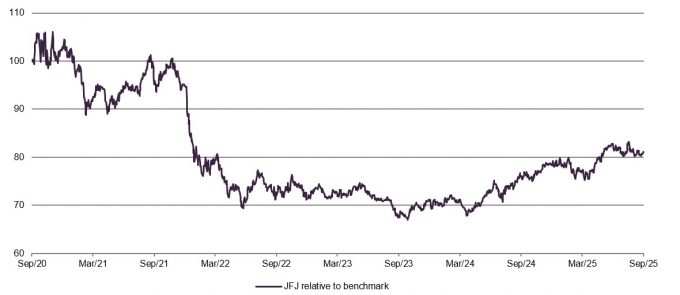
Figure 6: TOPIX and MSCI All Countries World Index over 12 months to 30 September 2025
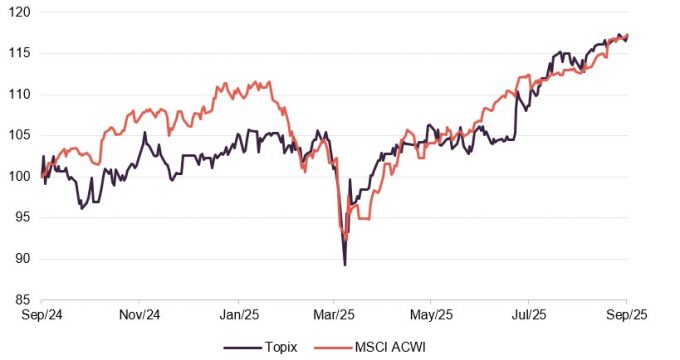
Source: Bloomberg, total returns in sterling, rebased to 100
Earlier in the year, Trump had alarmed some observers by questioning the US commitment to its longstanding defence pact with Japan. In response, Japan has ramped up its defence budget, with a $60bn request for military funding in 2026. It is also boosting its domestic arms manufacturing industry.
The other significant influence on returns has been the exchange rate. Notwithstanding an apparent US desire to weaken its currency, the managers observe that on a purchasing power basis (the value of money expressed in terms of the quantity of goods or services it can buy), the yen feels undervalued. A stronger yen would improve returns to UK-based investors, while also acting as a headwind to Japan-based exporters – which tend to be underrepresented in JFJ’s portfolio on quality grounds, thereby improving its performance relative to its benchmark.
Figure 7: USD/JPY exchange rate
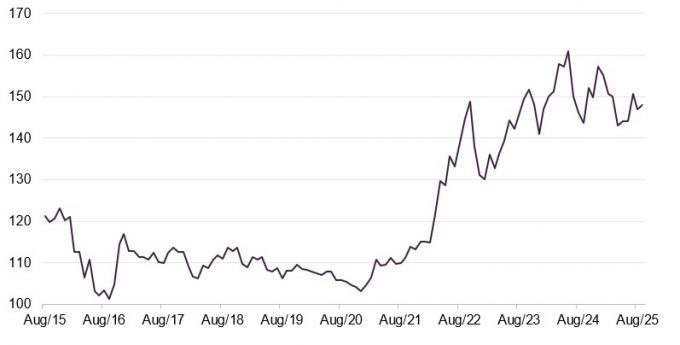
Source: Bloomberg
Asset allocation
JFJ’s focus on growth and quality means that, on average, its companies trade at a relative valuation premium to the Japanese domestic market as a whole, but these companies are also growing their earnings faster than the average Japanese listed company. The breadth of the opportunity set is clear in these numbers, as is JFJ’s stock-picking approach, which results in a fairly high active share.
Figure 8: Portfolio characteristics as at 30 September 2025
| Portfolio | Benchmark | |
|---|---|---|
| 12-month forward P/E | 19.4x | 15.3x |
| Return on equity | 12.1% | 8.7% |
| Five-year EPS expected growth rate | 10.2% | 8.4% |
| Number of issuers | 62 | 1,672 |
| Active share | 79.8% |
On a sector basis, JFJ has a greater exposure to machinery and banks than it did when we last published (using data as at the end of December 2024), and a lower exposure to insurance and transportation equipment. Primarily, this reflects the managers’ stock selection decisions.
The managers have reflected a number of key themes within the portfolio: around defence, digital innovation, automation and hardware technology, world class consumer brands, intellectual property/gaming, demographic change, and the environment. However, as might be expected with a stock-picking portfolio, there are also a number of companies that have been selected for other stock-specific reasons.
Figure 9: JFJ portfolio breakdown by sector 30 September 2025
Figure 10: JFJ sector weight relative to weight in benchmark 30 September 2025
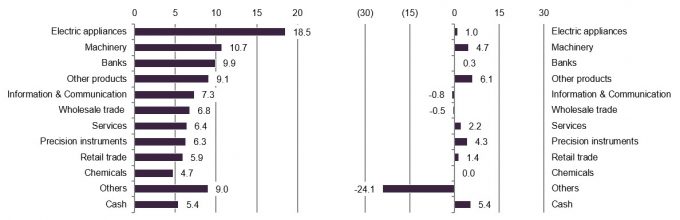
Source: JPMorgan Japanese Investment Trust
Source: JPMorgan Japanese Investment Trust
Portfolio activity and top 10 holdings
Since our last note was published using data as at the end of December 2024, Mitsubishi UFJ Financial, Nintendo, IHI, and Sanrio have moved up into the top 10, replacing Hitachi (which was the largest position), Keyence, Seven & I, and Tokio Marine.
Figure 11: JFJ’s 10 largest holdings as at 30 September 2025
| Stock | Sector | Portfolio weight 30 September 2025 (%) | Portfolio weight31 December 2024 (%) | Change(%) |
|---|---|---|---|---|
| Sony | Electric appliances | 6.6 | 3.1 | 3.5 |
| IHI | Machinery | 5.8 | – | 5.8 |
| Mitsubishi UFJ Financial | Banks | 5.7 | – | 5.7 |
| Nintendo | Other products | 4.8 | n/a | n/a |
| Advantest | Electric appliances | 4.4 | 4.3 | 0.1 |
| Asics | Other products | 4.3 | 4.6 | (0.3) |
| Rakuten Bank | Banks | 4.2 | 3.0 | 1.2 |
| Itochu | Wholesale trade | 3.3 | 4.0 | (0.7) |
| Sanrio | Wholesale trade | 3.2 | n/a | n/a |
| Hoya | Precision instruments | 3.0 | 3.1 | (0.1) |
| Total | 45.3 |
Hitachi had performed very well, and the managers opted to take profits from the position. We discussed the bid for Seven & I in our last note. Keyence’s share price fell in response to some slightly disappointing results.
Mitsubishi UFJ Financial
Figure 12: Mitsubishi UFJ Financial
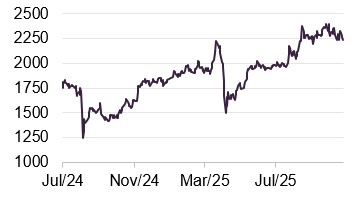
Source: Bloomberg
Mitsubishi UFJ Financial (mufg.jp) was a new position in the portfolio in January, and although it was caught up in the market selloff that accompanied the “Liberation Day” tariff announcements, its share price has recovered and done well since.
For some time, banks were not an attractive investment for JFJ. However, the shift to positive rates of interest has allowed banks’ interest rate margins to expand significantly and transformed their profitability. In Mitsubishi UFJ’s case, its asset management (including First Sentier Investors) and securities businesses also stand to benefit from changing sentiment towards equity investing in the country. In addition, it owns an 85% stake in Japan’s largest credit card business, Mitsubishi UFJ NICOS, which ought to be a beneficiary of a shift towards a greater take-up of digital financial services.
On the corporate governance front, Mitsubishi UFJ has been unwinding its strategic cross-shareholdings in other companies. However, it retains a 24% stake in Morgan Stanley.
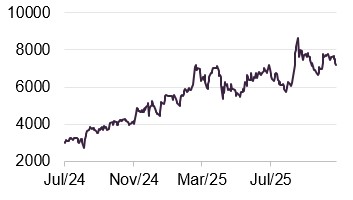
Nintendo
Figure 13: Nintendo
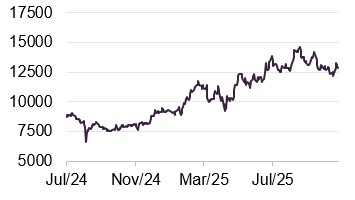
Source: Bloomberg
For JFJ’s managers, the attraction of Nintendo (nintendo.co.jp) is its portfolio of intellectual property, which includes the Super Mario and Pokémon franchises. From its beginnings in games and consoles (the company actually started in the 19th century as a playing card business), the company has been able to monetise its IP through the likes of films and theme parks.
The company’s recent quarterly results included encouraging sales figures for its new Nintendo Switch 2 game system and associated software sales.
IHI
Figure 14: IHI
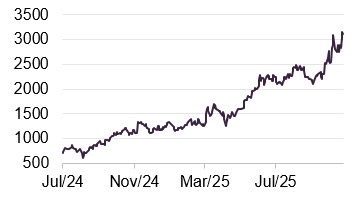
Source: Bloomberg
IHI (ihi.co.jp) is a heavy industry conglomerate which is a beneficiary of increased government defence spending. In addition, the managers were attracted by its efforts to streamline its business. The company has been gradually refocusing on its aerospace engineering, and energy (including nuclear power) operations. In recent years, it has exited a range of businesses – including cranes, boilers, materials handling, lawnmowers, and concrete construction materials – while also selling off non-core property and stakes in other companies. The company’s efforts have translated into much higher returns on capital and earnings per share. However, the managers feel that there is more to go for.
In its aerospace business, it is manufacturing parts for the F-35 fighter programme. As an aside, we also note that its space division has announced several tie-ups with companies in Seraphim Space’s portfolio.
Sanrio
Figure 15: Sanrio
Source: Bloomberg
Sanrio (sanrio.co.jp) owns the Hello Kitty and Cinnamoroll brands, plus a range of other intellectual property (including the Mr Men and Little Miss brands). There are similarities with Nintendo in that the company has sought to monetise its intellectual property in a range of ways including films and theme parks, and even a Hello Kitty-themed train.
In 2020, leadership of the company skipped a generation and JFJ’s managers were encouraged to see that the new CEO was willing to bring in outside expertise to strengthen the management team. The results of that are evident in improved profitability and higher returns on equity.
Other portfolio changes
Over the second quarter of 2025, JFJ made new investments in NEC Corp, Ariake Japan, and MODEC. Additions were made to positions in Ryohin Keikaku and Advantest.
Holdings in Topcon, Tsumura & Co, and GMO Payment Gateway were sold completely. Reductions were made to positions in Keyence, Suzuki Motor, and Rakuten Bank.
Performance
Figure 16: JFJ performance relative to benchmark (TOPIX) to end September 2025
Source: Bloomberg, Marten & Co.
As we have discussed in previous notes (see page 22 for a list of these), JFJ lost ground against its benchmark over 2021 as more growth-focused stocks struggled, triggered by rising interest rates across Japan’s developed market peers. What the five-year chart misses out now is the considerable outperformance delivered by JFJ over 2020; to a large extent, the experience in 2021 was just the unwinding of that. However, from the relative low point in October 2023, JFJ has been outperforming once again.
Encouragingly, JFJ’s recent relative performance has not been held back by a more supportive environment for value investing. The weak yen is bailing out exporters (a weaker currency makes their goods cheaper for overseas buyers) and rising interest rates have been helping banks, although in the latter case, the managers spotted the opportunity and took advantage of it with positions in stocks such as Mitsubishi UFJ and Rakuten Bank.
Figure 17: Cumulative total return performance over periods ending 30 September 2025
| 1 month(%) | 3 months(%) | 6 months(%) | 1 year(%) | 3 years(%) | 5 years(%) | |
|---|---|---|---|---|---|---|
| JFJ share price | 2.5 | 4.9 | 22.1 | 24.9 | 62.7 | 17.0 |
| JFJ NAV | 2.1 | 8.5 | 22.1 | 25.0 | 67.8 | 21.0 |
| Benchmark (TOPIX) | 2.7 | 10.4 | 16.1 | 17.2 | 48.9 | 49.2 |
Performance attribution
IHI was discussed on page 9. Rakuten Bank, the second-largest contributor to JFJ’s relative performance so far this year, is a beneficiary of wider interest rate margins and improved corporate governance.
Figure 18: Positive contributions to JFJ’s relative returns at 30 September 2025 YTD
| Relative weight (%) | Stock return (%) | Impact (%) | |
|---|---|---|---|
| IHI Corporation | 4.68 | 107.2 | 3.50 |
| Rakuten Bank | 3.86 | 85.2 | 2.25 |
| Mitsui E&S Holdings | 1.49 | 143.5 | 1.53 |
| Advantest | 2.25 | 58.2 | 1.11 |
| Toyota Motor | (3.65) | (7.7) | 0.38 |
Mitsui E&S is interesting, as the “E” for engineering and “S” for shipbuilding divisions have both been sold. The business is now focused on maintenance for ship engines and heavy-duty cranes used in ports. A US ruling (under Biden) to avoid cranes made by Chinese competitors has been a boon to its business.
Advantest is the world’s largest supplier of semiconductor chip testing equipment. It has been helped by the surge in AI investment. Early in October, it announced a tie-up with Nvidia aimed at improving the efficiency of Nvidia’s Blackwell chip production.
Toyota Motor’s business is threatened by Chinese competition, and not holding it has been a sensible move.
Figure 19: Negative contributions to JFJ’s relative returns at 30 September 2025 YTD
| Relative weight (%) | Stock return (%) | Impact (%) | |
|---|---|---|---|
| Seven & I Holdings | 1.92 | (19.3) | (0.75) |
| Tokyo Electron | 0.78 | (16.3) | (0.65) |
| Softbank Group | (0.32) | 30.5 | (0.63) |
| MARUWA | 1.33 | (20.6) | (0.60) |
| Mitsubishi Heavy Industries | (1.31) | 73.8 | (0.59) |
On the negative side, we discussed Seven & I in or last note. The withdrawal of the bid for the company triggered a sharp fall in its share price. Tokyo Electron issued a profits warning in July. An underweight exposure to Softbank held back JFJ’s relative returns, as did an underweight to Mitsubishi Heavy Industries (which is another beneficiary of rising defence spending).
Peer group
Up-to-date information on JFJ and its peer group is available on our website
For the purposes of this note we have used the constituents of the AIC Japan sector as a peer group, excluding Fidelity Japan Trust, which will shortly be merged into AVI Japan Opportunity Trust. The trusts listed here have roughly similar objectives except for CC Japan Income & Growth, which – as its name implies – places more emphasis on income generation.
Figure 20: JFJ’s peer group comparison data as at 24 October 2025
| Discount(%) | Yield(%) | Ongoing charges (%) | Market cap£m | |
|---|---|---|---|---|
| JPMorgan Japanese | (9.0) | 0.9 | 0.73 | 1,154 |
| Baillie Gifford Japan | (9.7) | 1.1 | 0.69 | 724 |
| CC Japan Income & Growth | (7.4) | 2.4 | 1.03 | 292 |
| Schroder Japan | (3.1) | 0.0 | 1.03 | 250 |
| Peer group median | (10.9) | 4.0 | 0.92 | 332 |
| JFJ rank | 3/4 | 4/4 | 2/4 | 1/4 |
There is not much difference in the ratings of the four remaining trusts in this peer group. JFJ is not managed to produce a dividend. Schroder Japan has adopted an enhanced dividend policy. JFJ’s ongoing charges ratio is competitive, helped by its being the largest company in the peer group, and should fall further in the wake of the merger as we discuss on page 16.
Figure 21: Cumulative NAV total return performance over periods ending 30 September 2025
| 3 months(%) | 6 months(%) | 1 year(%) | 3 years(%) | 5 years(%) | |
|---|---|---|---|---|---|
| JPMorgan Japanese | 8.5 | 22.1 | 25.0 | 67.8 | 21.0 |
| Baillie Gifford Japan | 14.5 | 23.5 | 24.0 | 38.3 | 18.2 |
| CC Japan Income & Growth | 9.0 | 19.2 | 20.2 | 66.9 | 90.7 |
| Fidelity Japan | 6.0 | 16.9 | 13.1 | 24.1 | 0.3 |
| Schroder Japan | 14.2 | 18.9 | 19.3 | 60.3 | 77.6 |
| Peer group median | 9.0 | 19.2 | 20.2 | 60.3 | 21.0 |
| JFJ rank | 4/5 | 2/5 | 1/5 | 1/5 | 3/5 |
As noted, the managers’ conviction has begun to generate strong portfolio returns over the past year, and as Figure 20 shows, JFJ has outperformed its peer group by a wide margin. In the longer term, performance remains in the middle of the pack, as value-focused companies such as CC Japan Income & Growth have benefitted from a global shift away from growth assets. However, as we have seen in recent months, market sentiment can swing quickly, and we expect JFJ to continue to generate strong returns going forward.
Dividends
Figure 22: JFJ dividend history
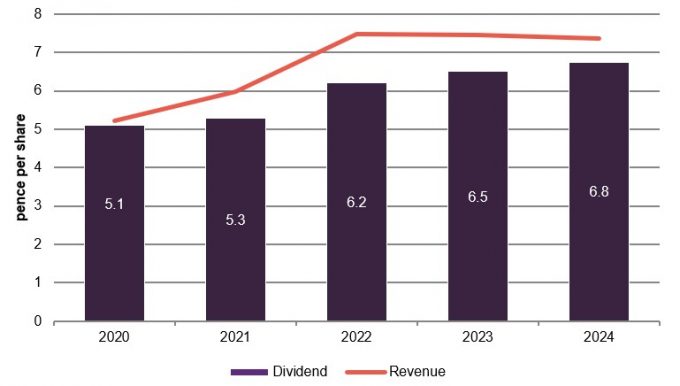
Source: JPMorgan Japanese Investment Trust
The board’s dividend policy is to pay out the majority of the revenue available each year. The investment objective’s emphasis on capital growth means that income generation is not a focus for the managers. A revenue reserve (a portion of a company’s retained earnings that are set aside from past income – such as dividends and interest payments – and can be used by investment trusts to smooth dividend payments during periods of lower income) has built up over the years and this stood at £21.6m at the end of September 2024, equivalent to 13.4p per share.
Premium/(discount)
Over the 12 months to the end of September 2025, JFJ’s discount to NAV moved within a range of 14.4% to a 6.9%, averaging 10.4%. At the time of publishing, the discount was 9.0%.
Whilst, as noted above, JFJ’s discount to NAV is around the middle of its peer group, it still feels too wide to us given the managers’ long-term track record and the encouraging outlook for the trust and the country.
The board believes that consistent, strong investment performance over one-, three- and five-year timeframes goes a long way to keeping discounts tight, and we agree with this. Effective marketing and promotion of the company also has a key role to play in this endeavour. Targeted share buybacks are used to tackle discount widening and discount volatility.
Figure 23: JFJ premium/(discount) over five years ended 30 September 2025
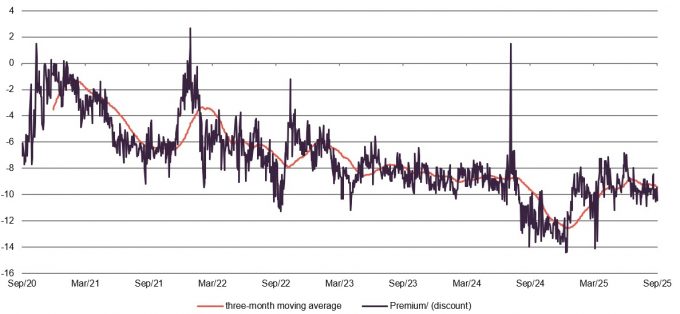
Source: Bloomberg, Marten & Co
JFJ repurchased 5,538,996 shares over the 12-month period ended 30 September 2025 and issued 23,365,110 shares in October 2024 in connection with the combination with JSGI.
Figure 24: JFJ shares issued and repurchased
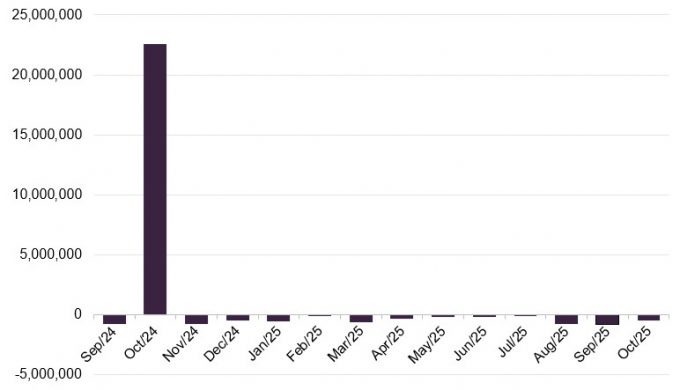
Source: JPMorgan Japanese Investment Trust (data to 24 October 2025)
Structure
Fees and costs
The trust employs JPMorgan Funds Limited as its Alternative Investment Fund Manager (AIFM) and company secretary. Management of the portfolio is delegated to JPMorgan Asset Management (UK) Limited, which in turn delegates day-to-day investment management activity to JPMorgan Asset Management (Japan) Limited in Tokyo. The manager is a wholly-owned subsidiary of JPMorgan Chase Bank which, through other subsidiaries, also provides marketing, banking, dealing and custodian services to the company.
Tiered management fee structure and no performance fee
With effect from 1 October 2024, JPMorgan Funds Limited is entitled to an annual management fee calculated as 0.6% of the first £500m of net assets, 0.4% on the next £250m and 0.35% on amounts above £750m. There is no performance fee. The contract can be terminated without penalty on six months’ notice. For accounting purposes, in the last financial year the management fee was charged 10% against the revenue account and 90% against the capital account.
Other administrative expenses for the year ended 30 September 2024 amounted to £1,225k (FY23 £1,276k).
As part of the agreement for the combination with JSGI, the manager agreed to waive its fee for the six-month period that ended on 30 April 2025. That meant that, for the year ended 30 September 2025, the trust’s ongoing charges ratio is estimated to be 0.45%. Had a full year’s fee been charged, the board estimates that the ongoing charges ratio would have been 0.60%, which compares favourably to the 0.74% ongoing charges ratio for the 12 months ended 30 September 2024.
Capital structure
JFJ is a UK-domiciled investment trust with a premium listing on the main market of the London Stock Exchange. As at 24 October 2025, there were 184,613,188 ordinary shares in issue, of which 160,503,203 had voting rights and the balance of 24,109,985 were held in treasury.
The company’s accounting year end is 30 September and AGMs are usually held in the following January.
Gearing
The company has the ability to use borrowing to gear the portfolio within the range of 5% net cash to 20% geared in normal market conditions.
The managers have the ability to gear the portfolio by using CfDs, and have been using these since 2024.
In April 2023, JFJ secured a three-year ¥10.0bn floating rate revolving credit facility with ICBC Limited, which matures on 14th April 2026. The facility has a non-utilisation fee of 0.60%. The board has determined that by comparison with the CfDs, this facility is relatively expensive and it will not be renewed.
The company has issued a series of senior secured loan notes totalling ¥13bn:
- ¥2bn fixed rate 10-year series A senior secured loan notes at an annual coupon of 0.76% which will expire on 2nd August 2028.
- ¥2.5bn fixed rate 15-year series B senior secured loan notes at an annual coupon of 0.95% which will expire on 2nd August 2033.
- ¥2.5bn fixed rate 20-year series C senior secured loan notes at an annual coupon of 1.11% which will expire on 2nd August 2038.
- ¥2.5bn fixed rate 25-year series D senior secured loan notes at an annual coupon of 1.21% which will expire on 2nd August 2043.
- ¥3.5bn fixed rate 30-year series E senior secured loan notes at an annual coupon of 1.33% which will expire on 2nd August 2048.
Major shareholders
Figure 25: Major shareholders as at 30 September 2025
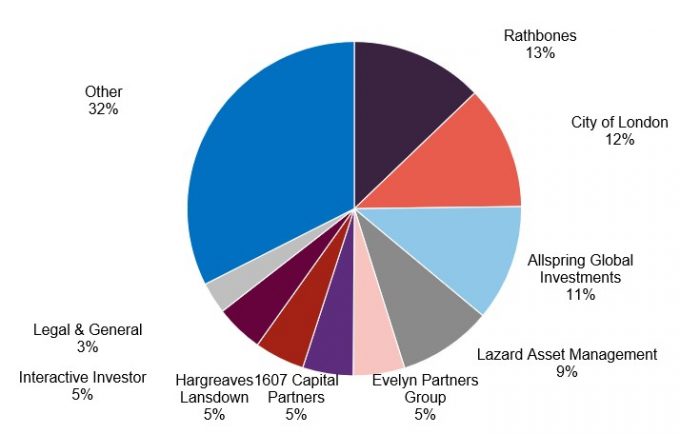
Source: Bloomberg
Core management team
Nicholas Weindling is a country specialist for Japan equities and a member of the Japan team within the Emerging Markets and Asia Pacific (EMAP) Equities team based in Tokyo. Nicholas joined JPMorgan Asset Management in 2006 from Baillie Gifford in Edinburgh, where he worked initially as a UK large-cap analyst and latterly as a Japanese equities investment manager. Nicholas obtained a BA (Hons) in History from Cambridge University. He was made manager of JFJ in August 2010.
Miyako Urabe is a country specialist for Japan equities, and a member of the Japan team within the Emerging Markets and Asia Pacific (EMAP) Equities team based in Tokyo. She joined JPMAM in 2013 from Credit Suisse Securities Equity Sales desk in Tokyo as an Asia ex-Japan specialist. Miyako began her career at Morgan Stanley MUFG Securities, covering Japan and Asia ex-Japan. She obtained a Bachelor’s degree in Economics from Keio University, Japan.
Xuming Tao is a country specialist for Japan equities and a member of the Japan team within the Emerging Markets and Asia Pacific (EMAP) Equities team based in Tokyo. Xuming joined JPMorgan Asset Management as a product analyst in 2019 from Deutsche Bank in Tokyo, where he worked as a research analyst for the retail and internet sectors. Prior to this, he worked at the Investment Banking Division of UBS in Tokyo. Xuming obtained a Bachelor of Science in Management Engineering and Science from University of Tsukuba. He is a CFA charterholder.
Board
JFJ’s board currently comprises eight directors, all of whom are non-executive (not involved in day-to-day management), considered to be independent of the investment manager and do not sit on other boards together. Brief biographies for each director are provided below. It is board policy that all directors retire and offer themselves for re-election at each AGM.
Thomas Walker joined the JFJ board at the time of the merger with JSGI. He had been a director of JSGI since 2019. The latest recruit is Takashi Maruyama, who joined the board with effect from 1 October 2025.
The number of directors will fall from next year. George Olcott plans to retire from the board at the 2026 AGM, and chairman Stephen Cohen intends to step down the following year.
Figure 26: Board member – length of service and shareholdings
| Director | Role | Date of appointment | Length of service (years) | Salary (£) | Shareholding |
|---|---|---|---|---|---|
| Stephen Cohen | Chairman | 20 December 2016 | 8.9 | 53,700 | 15,000 |
| Anna Dingley | Director | 13 January 2022 | 3.8 | 37,000 | 2,500 |
| Sally Duckworth | Chair of the audit and risk committee | 31 October 2022 | 3.0 | 44,000 | 3,032 |
| Jonathan Kestenbaum | Director | 1 October 2023 | 2.1 | 37,000 | 7,263 |
| Sally Macdonald | Senior independent director | 13 December 2018 | 7.0 | 38,000 | 4,383 |
| Takashi Maruyama | Director | 1 October 2025 | – | 37,000 | – |
| George Olcott | Chairman of the remuneration committee | 20 December 2016 | 8.9 | 37,000 | 8,367 |
| Thomas Walker | Director | 25 October 2024 | 1.0 | 37,000 | 12,714 |
Stephen Cohen (chairman)
Stephen has had over 35 years in executive roles in asset management, including setting up two businesses in Japan and living there for seven years.
He managed Japanese equity portfolios for 10 years. He also latterly ran a Japanese equity activist business. Currently, Stephen is a chair of audit and a non-executive director of Schroder Capital Global Innovation Trust Plc and the Advanced Research Invention Agency, and a Commissioner at the Civil Service Commission.
Anna Dingley (director)
Anna has been connected to Japan for over 30 years with her career spanning finance, government, technology and consumer sectors. She recently founded the high-profile UK Ekiden race, a Japanese style long-distance running relay for universities and corporate teams, and is currently a trustee of Japan Society, having joined in 2024. Fluent in Japanese, she was previously a non-executive director of Nihon M&A Center Holdings Inc., a Tokyo Stock Exchange-listed company. She is also founder director of a Japanese business consulting firm, Japan Connect Ltd.
Sally Duckworth (chair of the audit committee)
Sally has over 20 years’ experience of working in, investing in or advising companies, predominantly with a technology focus. She qualified as a Chartered Accountant with PricewaterhouseCoopers LLP, working in its financial institutions audit group, before joining JPMorgan. Sally has been an investment manager in early-stage technology venture capital, co-founded an angel network and taken several C-suite roles in growth companies.
Sally is a non-executive director and the chair of audit for Octopus Renewables Infrastructure Trust Plc and Mobeus Income & Growth VCT 2 Plc, the non-executive chair of StorMagic Ltd, and a non-executive director of Molten Ventures VCT Plc. She is also the chair of the Technical Advisory Committee for International Sustainability Standards.
Lord Jonathan Kestenbaum (director)
Jonathan has over two decades of private and public markets’ investing experience across asset classes. He is a non-executive director of Windmill Hill Asset Management, and an adviser to a range of interests associated with the Rothschild family.
Until 2022, he was the chief operating officer at RIT Capital Partners Plc. In this capacity he served on the Executive Committee of RIT’s investment manager, J Rothschild Capital Management. Prior to this, he served as chief executive of Five Arrows Limited, the private investment vehicle controlled by Lord Rothschild. During that time, he was also a non-executive director on the board of Pershing Square Holdings Plc. Jonathan was previously chief executive of NESTA (the National Endowment for Science, Technology and the Arts).
Jonathan was born and spent his early childhood in Japan and has therefore taken an active interest in the country, its companies, and markets throughout his professional career.
Sally Macdonald (senior independent director)
Sally has around 39 years’ experience in asset management, of which 31 were in Asian markets. She was head of Asian equities at Marlborough Fund Managers until 2021.
Sally is a non-executive director of Fidelity Asian Values Plc and Evelyn Partners Fund Solutions Ltd. Her previous board experience includes the Royal College of Nursing Foundation.
Takashi Maruyama (director)
Takashi is the former managing executive officer and chief investment officer (CIO) of Asset Management One Co., Ltd., one of Japan’s largest asset management firms with over $500bn in assets under management (AUM). He held this role from April 2022 until March 2025.
Takashi brings with him more than three decades of experience in the global investment management industry. Prior to joining Asset Management One, Mr. Maruyama served as CIO at FIL Investments (Japan) Ltd. (Fidelity International) from 2015. Before that, he held senior leadership positions at Nikko Asset Management, including head of Japanese Equity and Alternative Investments. His earlier career included roles at DIAM USA and the Industrial Bank of Japan (IBJ), where he began his career in portfolio management.
Takashi has been recognised for his leadership in the industry, including being named one of the “Top 10 Chief Investment Officers in Asia” by CEO Insights Asia in 2023. He holds a Master of Science degree in Engineering, and is fluent in both Japanese and English. Takashi is based in Japan.
Dr. George Olcott (chairman of the remuneration committee)
George has 16 years of investment banking and asset management business experience in Japan and Asia with SG Warburg/UBS, and has served on the boards of a number of listed Japanese corporations as an independent director (currently on the board of Kirin Holdings, and on the audit and supervisory board of Toyota Motor Corporation). He is a specially appointed professor and vice-president of Shizenkan University, and holds an advisory role at JR Central.
Thomas Walker (director)
Thomas was, from 2019, a non-executive director of JPMorgan Japan Small Cap Growth and Income Plc and became a director as part of the combination with that company. He was a portfolio manager at Martin Currie Investment Management Limited where latterly he headed up their Global Long Term Unconstrained Equity team.
Thomas qualified as a chartered accountant with Thomson McLintock, now KPMG, then moved into investment management with Edinburgh Fund Managers and subsequently worked in Hong Kong with Baring Asset Management before joining Martin Currie. He holds an MA in Law from Cambridge University. Thomas is a non-executive director of Lowland Investment Company Plc.
SWOT and bull vs. bear analysis
Figure 27: SWOT analysis
| Strengths | Weaknesses |
|---|---|
| Largest and most liquid Japanese-focused trust | Five-year track record dominated by sharp fall in relative performance over 2021 |
| Depth and experience of the management team | |
| Opportunities | Threats |
| Breadth and depth of market plus lack of analyst coverage create market inefficiencies | Quality and growth focus mean JFJ may lag in “risk on” environments |
| Corporate governance revolution is unlocking value and revitalising businesses | Vulnerable to macro events stemming from US (such as tariff policies) and China (such as Taiwan) |
Figure 28: Bull versus bear case
| Bull | Bear | |
|---|---|---|
| Performance | The manager has positioned the portfolio to benefit from the economic change underway in the countryJapanese equities are under-owned | The manager suggests that a much weaker yen could have the effects of both weighing on sterling returns and flattering major exporters that JFJ does not own |
| Outlook | Corporate governance changes and inflation/interest rate environment are creating change that JFJ can exploit | Might inflation become so entrenched that the BoJ needs to impose a much more restrictive environment |
| Discount | There is scope for the discount to narrow as sentiment improves | JFJ already has the tightest discount of its peers |
Previous publications
Readers may be interested in our previous publications on JFJ, which are listed in Figure 29 below. These are available to read on our website or by clicking the links in the table.
| Title | Note type | Publication date |
|---|---|---|
| Number one for a good reason | Initiation | 09 September 2020 |
| Strength to strength | Update | 09 December 2020 |
| Medium-term outlook undimmed | Update | 24 May 2021 |
| Bright long-term future | Annual overview | 17 December 2021 |
| Unjustified selloff creates opportunities | Update | 5 July 2022 |
| Backing the new Japan | Annual overview | 22 March 2023 |
| Are we there yet? | Update | 17 January 2024 |
| Conviction drives returns | Annual overview | 14 October 2024 |
| Winds of change | Update | 12 March 2025 |
IMPORTANT INFORMATION
Marten & Co (which is authorised and regulated by the Financial Conduct Authority) was paid to produce this note on JPMorgan Japanese Investment Trust Plc.
This note is for information purposes only and is not intended to encourage the reader to deal in the security or securities mentioned within it. Marten & Co is not authorised to give advice to retail clients. The research does not have regard to the specific investment objectives financial situation and needs of any specific person who may receive it.
The analysts who prepared this note are not constrained from dealing ahead of it but, in practice, and in accordance with our internal code of good conduct, will refrain from doing so for the period from which they first obtained the information necessary to prepare the note until one month after the note’s publication. Nevertheless, they may have an interest in any of the securities mentioned within this note.
This note has been compiled from publicly available information. This note is not directed at any person in any jurisdiction where (by reason of that person’s nationality, residence or otherwise) the publication or availability of this note is prohibited.
Accuracy of Content: Whilst Marten & Co uses reasonable efforts to obtain information from sources which we believe to be reliable and to ensure that the information in this note is up to date and accurate, we make no representation or warranty that the information contained in this note is accurate, reliable or complete. The information contained in this note is provided by Marten & Co for personal use and information purposes generally. You are solely liable for any use you may make of this information. The information is inherently subject to change without notice and may become outdated. You, therefore, should verify any information obtained from this note before you use it.
No Advice: Nothing contained in this note constitutes or should be construed to constitute investment, legal, tax or other advice.
No Representation or Warranty: No representation, warranty or guarantee of any kind, express or implied is given by Marten & Co in respect of any information contained on this note.
Exclusion of Liability: To the fullest extent allowed by law, Marten & Co shall not be liable for any direct or indirect losses, damages, costs or expenses incurred or suffered by you arising out or in connection with the access to, use of or reliance on any information contained on this note. In no circumstance shall Marten & Co and its employees have any liability for consequential or special damages.
Governing Law and Jurisdiction: These terms and conditions and all matters connected with them, are governed by the laws of England and Wales and shall be subject to the exclusive jurisdiction of the English courts. If you access this note from outside the UK, you are responsible for ensuring compliance with any local laws relating to access.
No information contained in this note shall form the basis of, or be relied upon in connection with, any offer or commitment whatsoever in any jurisdiction.
Investment Performance Information: Please remember that past performance is not necessarily a guide to the future and that the value of shares and the income from them can go down as well as up. Exchange rates may also cause the value of underlying overseas investments to go down as well as up. Marten & Co may write on companies that use gearing in a number of forms that can increase volatility and, in some cases, to a complete loss of an investment.