
Rising sun, rising returns
The Japanese equity market has been performing very strongly for some time, and the recent election victory of the pro- economic growth and pro-reform prime minister Sanae Takaichi has given the country a further boost. Despite ongoing challenges – not least those resulting from the war in Iran – the market looks well-positioned to see further increases.
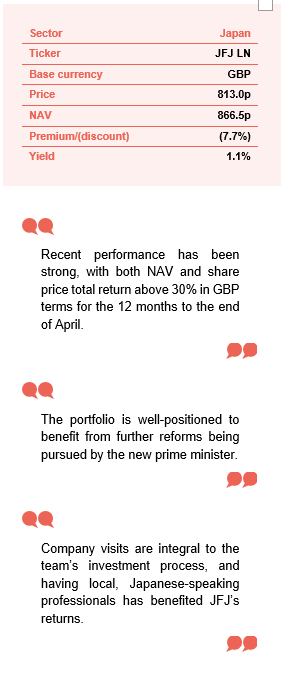
JPMorgan Japanese Investment Trust (JFJ) looks set to continue benefitting from this positive backdrop, given its focus on quality Japanese companies with particular growth potential. Nicholas Weindling, one of the co-managers of the trust, points to the ongoing and significant corporate reform in the country, which has made it a much more friendly environment for foreign investors. Recent performance from JFJ has been strong, with both net asset value (NAV) and share price total return above 30% in GBP terms for the 12 months to the end of April, ahead of both the TOPIX (the Japanese index) and wider global equities.
Capital growth from Japanese equities
JFJ aims to produce capital growth from a portfolio of Japanese equities and can use borrowing to gear the portfolio within the range of 5% net cash to 20% geared. The trust is benchmarked against the returns of the Tokyo Stock Exchange Index (commonly known as TOPIX) in sterling.
At a glance
Share price and discount
JFJ’s shares have risen fairly steadily in recent years, after a sharp decline starting at the end of 2021. The shares have mostly traded at a discount to their underlying NAV over the past five years. After widening from the end of 2024, over the past year the discount has mostly followed a tightening trend.
Time period 31 May 2021 to 15 June 2026

Source: Bloomberg, Marten & Co
Performance over five years
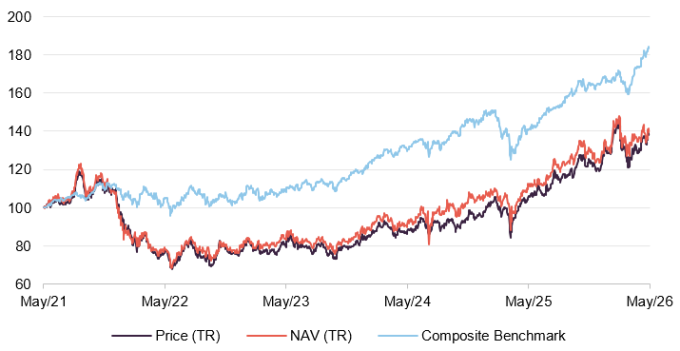
JFJ has underperformed its benchmark over the past five years. This is mainly due to a very difficult period in 2021-2, when global interest rates were rising and investors were more risk averse, with one-year and three-year NAV and share price total returns much stronger.
Time period 31 May 2021 to 31 May 2026
Source: Bloomberg, Marten & Co
| 12 months ended | Share price total return (%) | NAV total return (%) | TOPIX total return (%) | MSCI ACWI total return (%) | MSCI Japan total return (%) |
|---|---|---|---|---|---|
| 31/05/2022 | (22.1) | (20.9) | (1.9) | 5.1 | (1.5) |
| 31/05/2023 | 3.9 | 5.9 | 6.7 | 4.3 | 6.1 |
| 31/05/2024 | 8.1 | 8.9 | 14.7 | 19.2 | 15.5 |
| 31/05/2025 | 20.2 | 22.4 | 7.0 | 8.0 | 5.8 |
| 31/05/2026 | 32.2 | 26.9 | 30.6 | 30.7 | 31.8 |
Source: Bloomberg, Marten & Co
Fund profile and approach
Further information about the trust is available at www.jpmjapanese.co.uk
JPMorgan Japanese Investment Trust (“JFJ” or “the trust”) aims to achieve capital growth from investments in Japanese companies. For performance-monitoring purposes, the trust is benchmarked against the returns of the Tokyo Stock Exchange Index (commonly known as TOPIX) in sterling.
In October 2024, JFJ acquired about £144m of the assets of JPMorgan Japan Small Cap Growth & Income (JSGI), issuing 23,365,110 new shares in exchange. The combination of the two JPMorgan funds increased the net assets of JFJ to approximately £1bn, making it comfortably the most liquid and largest investment company focused on Japan.
The trust may make use of both long- and short-term borrowings with the aim of increasing returns.
Day-to-day investment management activity is the responsibility of JPMorgan Asset Management (Japan) Limited in Tokyo, where JPMorgan has had an office since 1969.
JFJ is run by Nicholas Weindling, Miyako Urabe and Xuming Tao.
The co-investment managers are Nicholas Weindling, who has had responsibility for JFJ’s portfolio for more than a decade; Miyako Urabe, who was appointed co-manager in May 2019; and Xuming Tao, who was appointed around the time of the publication of JFJ’s interim report in May 2025.
They are supported by a well-resourced team of over 130 members within JPMorgan Asset Management’s broader Emerging Markets and Asia Pacific group, including 23 specialists dedicated to analysing and investing in Japanese equities. This makes them one of the largest dedicated Japanese equity teams, based primarily in Tokyo. Company visits are important to the team’s investment process, and having local, Japanese-speaking professionals has benefited JFJ’s returns. The team conducts approximately 4,500 company visits annually.
The managers can also draw on the expertise of JPMorgan’s analyst teams around the world. There are stocks in the portfolio where an opportunity was identified as a result of research being conducted on US competitors, for example.
We discussed the investment approach in detail in our March 2023 note, which you can read here.
High-quality companies that are capable of increasing their earnings sustainably over the long term.
The investment emphasis is on identifying high-quality companies that are capable of increasing their earnings sustainably over the long term. That means investing in companies in growing industries that have strong balance sheets and are resilient in the face of macroeconomic issues.
Stocks are classified by the team as premium, quality, standard and challenged/unclassified. At the end of September 2025, 9.2% of JFJ’s portfolio was classified as premium (versus 4.9% for all stocks in its benchmark), 56.0% classified as quality (versus 23.1%), 48.2% classified as standard (versus 53.8%), and just 0.3% in challenged or unclassified companies (versus 18.3%).
The managers build a high-conviction portfolio (55 holdings at the end of March 2026), which may differ significantly from the performance benchmark (JFJ’s active share, on a geared basis, was 84.2% as at 31 March 2026).
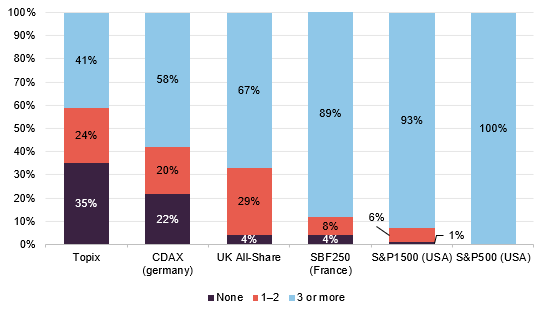
The depth of the team is vital, given the comparative lack of stock coverage in Japan. In a number of our recent notes, we have included versions of Figure 1, which illustrates this.
Figure 1: Stock coverage by sell-side analysts
Source: JPMAM, Jefferies, Factset. Data as at 31 December 2025
The picture has improved somewhat from September 2024, the date of the last version we used, with the percentage of Japanese companies with no analyst coverage falling from 47% to 35%, and the proportion with three or more analysts rising from 33% to 41%. Nonetheless, the level of coverage remains lower than in other similar markets.
In addition, the managers observe that much of the analysis that is performed is short-term in nature. The JFJ team makes a point of considering the outlook for a company over a five-year period.
Potential investments are analysed in respect of their financially material environmental, social and governance (ESG) attributes, and the management team will engage with companies where necessary. A standardised checklist of 40 questions reveals “red flags”. As might be expected, the stocks in JFJ’s portfolio tend to have fewer red flags than the benchmark average (11.8 as at the end of March 2026 versus 13.7 for the benchmark).
Market update
New prime minister Takaichi Sanae won a convincing mandate in the recent election.
In marked contrast to many leading democracies, the political backdrop in Japan is very stable. This follows the resounding election victory by Sanae Takaichi in February, which gave her the strongest electoral mandate since the founding of the Liberal Democratic Party, the country’s dominant party, in 1955.
Nicholas says that Takaichi’s premiership has given Japan a clear pro-growth and assertive policy direction. She has used her electoral mandate to argue for a more active economic strategy, moving away from underinvestment and towards state-backed support for strategic industries. Her agenda combines near-term fiscal support, that is higher government spending, with a longer-term industrial policy focused on areas such as AI, semiconductors, shipbuilding, energy security and defence-related manufacturing.
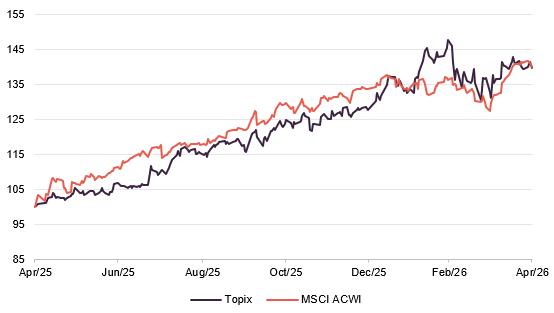
Takaichi’s market-friendly victory has added further optimism to an already-buoyant Japanese market. The past 12 months – a period beginning just after President Trump’s “Liberation Day” tariffs rattled markets – show a very strong return for the TOPIX index, which has kept pace with wider global equities in yen, i.e. local currency, terms.
Figure 2: TOPIX and MSCI All Countries World Index over 12 months to 30 April 2026
Source: Bloomberg, total return in yen, rebased to 100
Impact of war in the Middle East
Japan is not immune to the effects of the war in Iran.
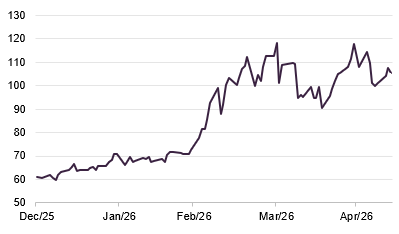
Japan has not escaped the impact of the war in Iran. In the short term, as an importer of natural resources, the sharp rise in the oil price, plus the disruption to global supply routes, has been negative. Most importantly, around 80% of the country’s oil is shipped through the Strait of Hormuz, which has been closed since the beginning of the war.
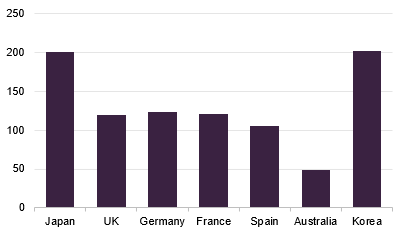
However, this impact has been softened by Japan’s oil inventory, which amounted to over 200 days’ worth of supply on the eve of the war. This compares favourably with other oil importing countries, as shown in Figure 4. Nonetheless, in common with most countries, Japan clearly requires Hormuz to reopen in order to avoid a potential oil shock, where high oil prices lead to economic stress.
Figure 3: Brent oil price, USD, year-to-date
Source: Bloomberg
Figure 4: Oil inventory, days of net imports, select countries
Source: International Energy Agency, as at February 2026
In the longer term, the main impact of the war on Japan may be increased concern as to whether the US can be relied upon to continue providing a security guarantee, or whether it may run down its large military presence. In response, Takaichi is building up Japan’s own defences. She has long taken a hawkish stance on national security, favouring higher defence spending, stronger intelligence capabilities and a more active role for Japan’s defence industry.
These developments feed into Nicholas’s view that the nature of growth investing is changing. Sectors such as defence, shipbuilding and oil drilling were not, until recently, widely viewed as growth areas, thus favouring growth-focused investors like JFJ, but that perception has now shifted.
In order to reduce its level of oil import dependency, Japan is also focused on increasing electricity generation from renewables and nuclear. In the case of the latter, this is a big change from recent history, given the memory of the Fukushima nuclear accident in 2011, which led to a virtual shuttering of the sector.
Ongoing corporate reforms
Important corporate reforms in Japan are ongoing.
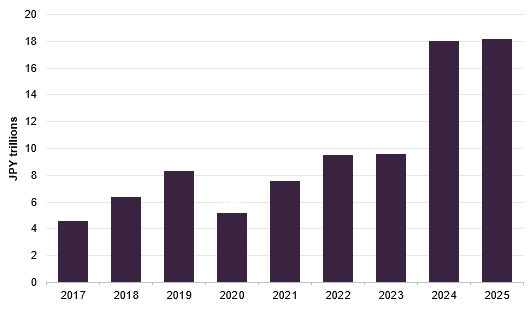
In our recent notes on JFJ, we have extensively discussed the impact of shareholder-friendly corporate reforms. The positive impact of these continues to be in evidence. Recent year-end company earnings reports showed another strong period of dividend growth and share buybacks (where a company repurchases its undervalued shares to boost the price of the remaining shares). As shown in Figure 5, buybacks reached record highs over 2025, marginally ahead of levels seen in 2024, and well ahead of previous years.
Figure 5: Announced share buybacks
Source: Goldman Sachs
The reporting season showed corporate earnings to be broadly, but not uniformly, strong. It saw continued resilience in areas linked to technology, entertainment, automation and global demand. However, the picture was more mixed for large cyclical companies and exporters, where tariffs, currency moves and higher input costs weighed on guidance. Investors distinguished more carefully between companies with structural growth drivers and pricing power, giving them resilience to shocks, and those more exposed to trade friction, energy costs and currency volatility. This plays to JFJ’s strength, given its clear focus on high-quality names with significant potential for growth.
The long-term trend of yen weakness versus the dollar has continued.
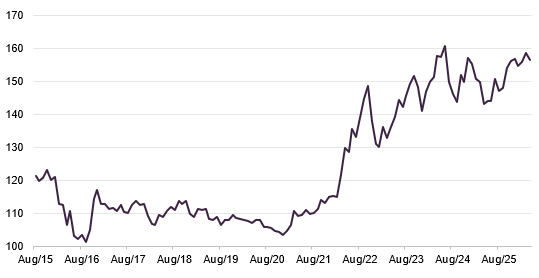
Figure 6 shows the long-term trend of yen weakness versus the dollar, which resumed in the second half of 2025 after a short period of strengthening. Nicholas says that this weakening trend has put pressure on spending by the domestic (i.e. Japanese) consumer, through more expensive imports. However, this was offset to a degree by a third straight year of labour earnings growth above 5%.
Figure 6: USD/JPY exchange rate
Source: Bloomberg
Asset allocation
JFJ’s portfolio companies generally trade on higher multiples than its benchmark.
It is unsurprising that JFJ’s holdings trade on a higher average multiple of their earnings than the benchmark, given its focus on quality growth. These companies also grow their earnings more quickly than the average listed Japanese company. JFJ only holds those stocks where the managers have a high level of conviction, despite the large number of available stocks, which results in a portfolio that differs significantly from the benchmark. Indeed, JFJ’s active share has increased to 84.2% from 79.8% at the time of our last note in October (which used data to 30 September 2025).
Figure 7: Portfolio characteristics as at 31 March 2026
| Portfolio | Benchmark | |
|---|---|---|
| 12-month forward price/earnings ratio | 17.9x | 15.1x |
| Return on equity | 12.5% | 9.1% |
| Five-year EPS expected growth rate | 10.1% | 8.7% |
| Number of issuers | 55 | 1,652 |
| Active share | 84.2% | N/A |
Source: JPMorgan Japanese Investment Trust
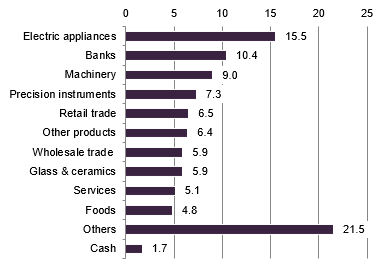
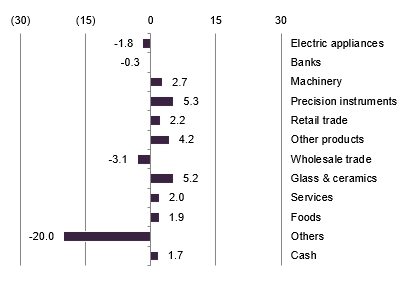
Looking at the sector breakdown for JFJ, compared to our last note in October (which used data as at 30 September 2025), although electrical appliances remain the largest sector, the weighting has reduced by 3%. It has therefore moved from an overweight sector position versus the benchmark to an underweight. The weighting to banks has increased somewhat, making it now the second-largest sector, albeit there is a small underweight to the benchmark.
Figure 8: JFJ portfolio breakdown by sector 31 March 2026
Source: JPMorgan Japanese Investment Trust
Figure 9: JFJ sector weight relative to weight in benchmark 31 March 2026
Source: JPMorgan Japanese Investment Trust
Changes to the sector allocations are mainly due to the managers’ stock selection decisions, with this being a stock-picking portfolio (i.e. the returns should be generated by holding particular companies that perform strongly).
Portfolio activity and top 10 holdings
Since our last note was published using data as at the end of September 2025, Mitsubishi Electric, Sumitomo Electric Industries, Fast Retailing and Sumitomo Realty & Development have moved into JFJ’s top 10, replacing Sony (which had been the largest position), Nintendo, Rakuten Bank and Sanrio.
Figure 10: JFJ’s 10 largest holdings as at 30 April 2026
| Stock | Sector | Portfolio weight 30 April 2026 (%) | Portfolio weight30 September 2025 (%) | Change(%) |
|---|---|---|---|---|
| Mitsubishi UFJ Financial | Banks | 7.9 | 5.7 | 2.2 |
| Mitsubishi Electric | Electric appliances | 5.8 | 0.0 | 5.8 |
| Advantest | Electric appliances | 5.4 | 4.4 | 1.0 |
| Sumitomo Electric Industries | Nonferrous metals | 4.5 | 0.0 | 4.5 |
| Asics | Other products | 4.4 | 4.3 | 0.1 |
| Fast Retailing | Retail | 4.3 | 0.8 | 3.5 |
| Sumitomo Realty & Development | Real estate | 4.0 | 1.0 | 3.0 |
| Hoya | Precision instruments | 3.8 | 3.0 | 0.8 |
| Itochu | Wholesale trade | 3.4 | 3.3 | 0.1 |
| IHI | Machinery | 3.9 | 5.8 | (1.9) |
| Total | 47.4 |
Source: JPMorgan Japanese Investment Trust
In the first quarter of 2026, positions in Nintendo and Sony were reduced amid share price weakness and rising memory chip costs, which are expected to put pressure on gaming console margins.
For Nintendo, higher memory prices – driven by AI demand – are anticipated to compress margins as its Switch 2 console sales increase, with concerns that the console cycle may be weaker than expected and may not deliver the earnings increase expected by the market.
Sony faces broader challenges, including macroeconomic pressures and US tariffs on Chinese goods. While memory prices weigh on Sony’s gaming margins, the impact is muted as the PS5 is mid-cycle (neither old nor particularly new) and requires less aggressive sales.
Mitsubishi Electric
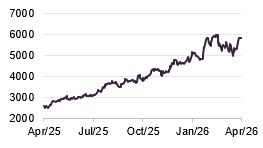
Figure 11: Mitsubishi Electric
Source: Bloomberg
JFJ’s managers added to Mitsubishi Electric (mitsubishielectric.com) in the first quarter of 2026. The company’s shares have performed extremely strongly, as investors warmed to its mix of factory automation, power systems, semiconductors and infrastructure exposure. Mitsubishi Electric reported record revenue for FY2025 (financial year 2025), with operating profit also rising to ¥391.8bn, helped by growth in infrastructure and life-related businesses and an improvement in semiconductors and devices.
The holding fits comfortably with JFJ’s ideas around growth companies, giving the portfolio exposure to the long-term need for robotics, automation, electrification and industrial efficiency. Despite competition from China, the company has also benefitted from recent improved economic conditions.
Sumitomo Electric Industries
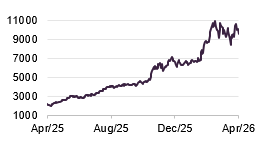
Figure 12: Sumitomo Electric Industries
Source: Bloomberg
JFJ’s managers added to Sumitomo Electric Industries (sumitomoelectric.com) in the first quarter of this year. Its exceptionally strong recent performance reflects investor appetite for companies exposed to electrification, data-centre demand and energy infrastructure investment. The company achieved record highs in net sales, income and net profit in FY2024, and that momentum has continued into FY2025.
The holding gives JFJ exposure to several of the structural themes that the managers see supporting Japanese growth companies over the medium term: the electrification of vehicles, grid investment, power transmission, optical fibre and data-centre infrastructure. This helps the fund capture growth from AI-related computing demand and energy-system investment, through a long-established Japanese industrial business.
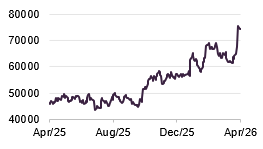
Fast Retailing
Figure 13: Fast Retailing
Source: Bloomberg
Fast Retailing (fastretailing.com) has continued to perform strongly, supported by the global growth of Uniqlo and the company’s increasingly international earnings. The group delivered a fourth consecutive year of record performance in FY2025, with revenue rising to ¥3.4trn and business profit reaching ¥551.1bn, helped by continued demand for its LifeWear range and further growth across its international Uniqlo operations. That momentum has continued into FY2026, with first-half revenue and profit also reaching record levels.
The holding gives JFJ exposure to one of Japan’s clearest global consumer-growth stories. Fast Retailing combines a strong domestic franchise with significant overseas expansion potential, particularly in North America, Europe and Asia, where Uniqlo continues to build scale. For JFJ’s managers, the appeal lies in the company’s brand strength, operational discipline and ability to increase earnings through store growth, product innovation and rising global recognition of Uniqlo.
Sumitomo Realty & Development
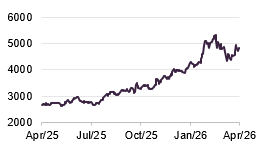
Figure 14: Sumitomo Realty & Development
Source: Bloomberg
Sumitomo Realty & Development (Sumitomo-rd.co.jp) has benefitted from improving positivity towards Japanese real estate, particularly in Tokyo, where office demand has remained resilient and asset values continue to provide scope for value increases. The company reported record-high revenue and operating profit for FY2024 – with all business segments delivering both higher revenue and profit – and has guided for further profit growth in FY2025.
The appeal for JFJ’s managers is partly that Sumitomo Realty offers exposure to a stronger property market. It also fits the trust’s broader emphasis on Japanese companies where improving corporate behaviour can unlock value, as well as rising investor pressure on companies with valuable but underappreciated assets. The dividend policy has also become more shareholder-friendly, with management targeting a higher payout over time.
Other portfolio changes
During the first quarter of 2026, JFJ’s managers also initiated new positions in ARE Holdings and Tokio Marine.
Tokio Marine benefits from being one part of a three-player oligopoly (a market dominated by a small number of large companies) in the Japanese life insurance market. Global insurance pricing has recently been weak, but Japan has bucked this trend, partly due to this oligopolist market. Earlier this year, Berkshire Hathaway acquired a 2.49% stake and entered a strategic partnership, which Nicholas described as a real stamp of approval for Tokio Marine.
In the quarter, total sales were made of Hitachi, Nomura Research Institute and Japan Material. NEC was reduced, along with Sony and Nintendo.
Performance
Since our last note in October 2025, JFJ has lost some ground against the benchmark, as shown in Figures 15 and 16. Much of this was due to performance in March, when the market fell sharply with investors reducing risk due to the war in Iran. JFJ fell more than the market due to its gearing and growth-focused positioning, as well as stock-specific detractors such as Rakuten Bank and NEC (see page 14). However, the one-year and three-year numbers, for both NAV and share price returns, remain strong and generally ahead of the benchmark.
The five-year numbers still include performance for 2022, when JFJ particularly struggled due to growth-focused stocks being out of favour against a backdrop of rising global interest rates. However, this was largely a reversal of a previous period of very strong performance from JFJ, which is not shown in the chart. When 2022 drops out of the five-year numbers, long-term performance will again look strong.
Figure 15: JFJ performance relative to benchmark (TOPIX) to end May 2026

Source: Bloomberg, Marten & Co.
Figure 16: Cumulative total return performance over periods ending 31 May 2026
| 1 month(%) | 3 months(%) | 6 months(%) | 1 year(%) | 3 years(%) | 5 years(%) | |
|---|---|---|---|---|---|---|
| JFJ share price | 5.9 | (4.3) | 10.6 | 32.2 | 71.8 | 39.0 |
| JFJ NAV | 3.9 | (4.4) | 7.6 | 26.9 | 69.1 | 41.7 |
| Benchmark (TOPIX) | 5.3 | (0.5) | 14.4 | 30.6 | 60.3 | 67.7 |
Source: Bloomberg, Marten & Co.
Performance attribution
It is encouraging to note that all five top contributors so far this year have been holdings within JFJ’s portfolio, rather than index companies that the manager does not own.
Figure 17: Positive contributions to JFJ’s relative returns at 31 March 2026 YTD
| Relative weight (%) | Stock return (%) | Impact (%) | |
|---|---|---|---|
| Seiko | 2.69 | 52.14 | 0.97 |
| IHI | 4.56 | 15.29 | 0.68 |
| MODEC | 3.19 | 24.21 | 0.59 |
| Nichias | 2.36 | 29.64 | 0.52 |
| Sumitomo Electric Industries | 2.33 | 31.89 | 0.30 |
Source: JPMorgan Japanese Investment Trust
Seiko, the watch manufacturer, has seen exceptional share price performance this year, driven by a mix of record-high profitability, a successful “premiumisation” strategy and high demand in its US market. Its share price rise of over 50% contributed 0.97% to JFJ’s relative returns.
We wrote in some detail about IHI, the heavy industry conglomerate, in our last note. The company has recently been supported by strength in aerospace and defence-related demand.
MODEC was a new addition to the portfolio in 2025. The specialist in offshore floating production systems in the oil and gas industry has benefitted from a strong order book and continued demand for offshore energy infrastructure.
Another new purchase in 2025 was Nichias, which makes insulation, sealing and protection materials. Its specialist materials are used in areas such as heat insulation, corrosion resistance and clean-tech applications, giving it exposure to a broad range of industrial and technology end markets. It has benefitted from generally strong demand in these sectors.
We discussed Sumitomo Electric Industries in some detail above (see page 11).
Figure 18: Negative contributions to JFJ’s relative returns at 31 March 2026 year to date
| Relative weight (%) | Stock return (%) | Impact (%) | |
|---|---|---|---|
| NEC Corp | 1.53 | (26.3) | (0.73) |
| Mitsubishi Corporation1 | (1.91) | 50.2 | (0.69) |
| Rakuten Bank | 3.09 | (18.0) | (0.68) |
| Sony | 1.70 | (19.6) | (0.56) |
| Nintendo | 1.44 | (15.3) | (0.46) |
Source: JPMorgan Japanese Investment Trust. Notes: 1) Not held in portfolio
On the negative side, NEC gave back much of its 2025 gain due to an underwhelming revenue forecast, while Rakuten Bank similarly retraced after a period of very strong performance last year. We have discussed the recent struggles of Sony and Nintendo above (see page 10). Not holding Mitsubishi Corporation has hurt performance, with the shares up around half, driven by significant stock repurchases.
Peer group
Up-to-date information on JFJ and its peer group is available on our website
For the purposes of this note, we have used the constituents of the AIC Japan sector as a peer group. The trusts listed here have roughly similar objectives except for CC Japan Income & Growth, which – as its name implies – places more emphasis on income generation.
Figure 19: JFJ’s peer group comparison data as at 31 May 2026
| Discount (%) | Yield (%) | Ongoing charges (%) | Market cap £m | |
|---|---|---|---|---|
| JPMorgan Japanese | (6.0) | 1.1 | 0.46 | 1,236 |
| Baillie Gifford Japan | (9.2) | 1.0 | 0.71 | 675 |
| CC Japan Income & Growth | (5.2) | 2.2 | 1.06 | 366 |
| Schroder Japan | (5.6) | 3.0 | 0.92 | 437 |
| Peer group median | (5.8) | 1.65 | 0.815 | 556 |
| JFJ rank | 3/4 | 3/4 | 1/4 | 1/4 |
Source: QuotedData website
The discounts for the four trusts in the sector are very similar, with JFJ’s being the third narrowest as at 31 May 2026. Schroder Japan has adopted an enhanced dividend policy (when an investment trust commits to paying a higher, often more predictable dividend than would be generated by portfolio income alone, generally by using distributable capital reserves) hence its higher dividend yield than the rest of the sector.
Figure 20: Cumulative NAV total return performance over periods ending 31 May 2026
| 3 months (%) | 6 months (%) | 1 year (%) | 3 years (%) | 5 years (%) | |
|---|---|---|---|---|---|
| JPMorgan Japanese | (4.4) | 7.6 | 26.9 | 70.3 | 41.7 |
| Baillie Gifford Japan | 3.5 | 9.9 | 26.8 | 40.5 | 15.1 |
| CC Japan Income & Growth | 3.2 | 21.5 | 40.2 | 85.5 | 117.7 |
| Schroder Japan | 2.4 | 23.9 | 47.8 | 89.1 | 105.3 |
| Peer group median | 2.8 | 15.7 | 33.5 | 77.9 | 73.5 |
| JFJ rank | 4/4 | 4/4 | 3/4 | 3/4 | 3/4 |
Source: Bloomberg, Marten & Co
Underperformance in March has led to JFJ slipping down the peer group rankings, albeit the trust has still profited significantly from the strong rally in Japan over the past year. Three- and five-year performance is third out of the four trusts in the sector. However, with market sentiment liable to move quickly, we are confident that JFJ will generate strong performance on a relative and absolute basis, as it has done previously.
Dividends
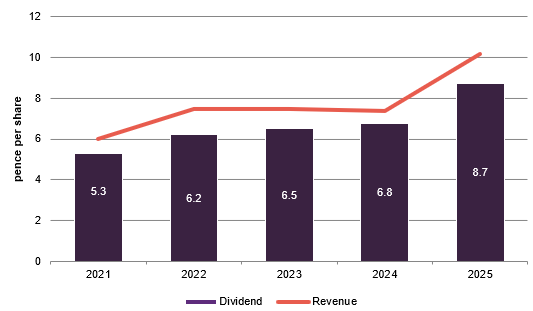
Figure 21: JFJ dividend history
Source: JPMorgan Japanese Investment Trust
The board’s dividend policy is to pay out the majority of the revenue available each year, though the focus on capital growth means that income generation is not a priority for the managers. A revenue reserve (the accumulated income that an investment trust has kept back after paying its expenses and dividends) has built up over time, and this stood at £26.9m at the end of September 2025, equivalent to 16.7p per share.
Premium/(discount)
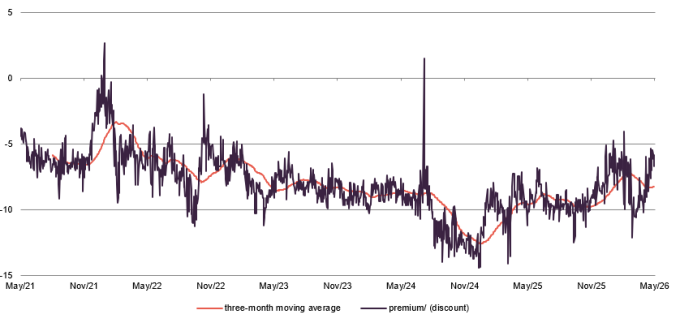
Over the 12 months to the end of May 2026, JFJ’s discount moved within a range of 12.5% to 4.0%, averaging 8.8%. At the time of publishing, the discount was 7.7%.
As noted above, JFJ’s discount was the second-narrowest in the peer group at the end of April. However, we still feel that it is too wide, given both the positive outlook for Japan after the election and the long-term track record of the fund.
The board continues to believe that strong investment performance over different time periods is important for keeping a discount tight (or low), something we strongly agree with. Effective marketing and promotion of the company also has a key role to play in this.
Figure 22: JFJ premium/(discount) over five years ended 31 May 2026
Source: Bloomberg, Marten & Co
Buyback policy
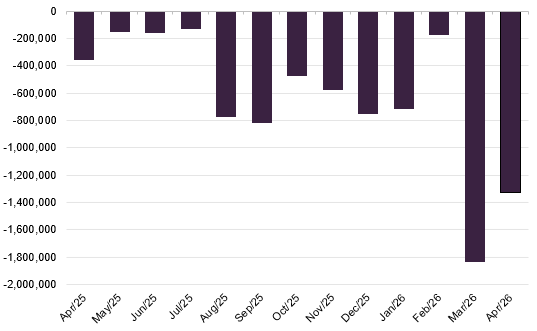
The company has been an active buyer of its shares over the last few years as it aims to manage the volatility of the discount and help address any supply and demand imbalance in the shares. To that end, during the 12-month period ended 30 April 2026, a total of 7,419,000 shares (4.5% of the total in issue) were repurchased, as illustrated in Figure 23.
Figure 23: JFJ shares issued and repurchased
Source: JPMorgan Japanese Investment Trust
SWOT analysis
Figure 24: SWOT analysis for JFJ
| Strengths | Weaknesses |
| Strong recent performance, with both NAV and share price seeing good progress, particularly over the past 12 months. | Five-year performance continues to be held back by a difficult 2022. |
| Well-established management team, based on the ground in Tokyo, who also have access to JPMorgan’s extensive global analyst community. | |
| Opportunities | Threats |
| The big election victory of Sanae Takaichi, who is notably pro-reform and pro-growth, suggests that the recent strong performance of the Japanese market can continue. | JFJ is unapologetically growth-focused, with a quality bias, meaning that a period when growth investing is out of favour can lead to underperformance, as in 2022. |
| Japan is still in the midst of a shareholder-friendly corporate revolution. This is particularly advantageous for the growth-focused companies that JFJ invests in. | Many of the portfolio’s holdings could be vulnerable to external events, in a very volatile environment, e.g. Trump tariffs and security policies, and war in the Middle East. |
Source: Marten & Co
Bull vs bear case
Figure 25: Bull vs bear case for JFJ
| Performance | In recent years, JFJ has performed robustly. The portfolio is well-positioned to benefit from further reforms being pursued by the new prime minister. | When Japanese growth investing is out of favour, JFJ can struggle, as shown by its experience in 2022. |
| Dividends | The majority of JFJ’s revenue is paid out to shareholders, and a revenue reserve has built up over time. | The capital growth focus of the fund means that income generation is not a priority for the managers. Those investors who require a high yield should look elsewhere. |
| Outlook | The prospects for Japan look notably bright, with ongoing corporate reform and political stability. JFJ has a portfolio of holdings poised to benefit. | Recent positivity could be soured by external events, given such a volatile backdrop. |
| Discount | Although the discount has narrowed, there is scope for it to come in further, particularly if good recent performance continues. | The discount could widen again, especially if the market moves against growth investing. |
Source: Marten & Co
Previous publications
Readers may be interested in our previous publications on JFJ, which are listed in Figure 26 below. These are available to read on our website or by clicking the links in the table.
IMPORTANT INFORMATION
Marten & Co (which is authorised and regulated by the Financial Conduct Authority) was paid to produce this note on JPMorgan Japanese Investment Trust Plc.
This note is for information purposes only and is not intended to encourage the reader to deal in the security or securities mentioned within it.
Marten & Co is not authorised to give advice to retail clients. The research does not have
regard to the specific investment objectives financial situation and needs of any specific person who may receive it.
The analysts who prepared this note are not constrained from dealing ahead of it but, in practice, and in accordance with our internal code of good conduct, will refrain from doing so for the period from which they first obtained the information necessary to prepare the note until one month after the note’s publication. Nevertheless, they may have an interest in any of the securities mentioned within this note.
This note has been compiled from publicly available information. This note is not directed at any person in any jurisdiction where (by reason of that person’s nationality, residence or otherwise) the publication or availability of this note is prohibited.
Accuracy of Content: Whilst Marten & Co uses reasonable efforts to obtain information from sources which we believe to be reliable and to ensure that the information in this note is up to date and accurate, we make no representation or warranty that the information contained in this note is accurate, reliable or complete. The information contained in this note is provided by Marten & Co for personal use and information purposes generally. You are solely liable for any use you may make of this information. The information is inherently subject to change without notice and may become outdated. You, therefore, should verify any information obtained from this note before you use it.
No Advice: Nothing contained in this note constitutes or should be construed to constitute investment, legal, tax or other advice.
No Representation or Warranty: No representation, warranty or guarantee of any kind, express or implied is given by Marten & Co in respect of any information contained on this note.
Exclusion of Liability: To the fullest extent allowed by law, Marten & Co shall not be liable for any direct or indirect losses, damages, costs or expenses incurred or suffered by you arising out or in connection with the access to, use of or reliance on any information contained on this note. In no circumstance shall Marten & Co and its employees have any liability for consequential or special damages.
Governing Law and Jurisdiction: These terms and conditions and all matters connected with them, are governed by the laws of England and Wales and shall be subject to the exclusive jurisdiction of the English courts. If you access this note from outside the UK, you are responsible for ensuring compliance with any local laws relating to access.
No information contained in this note shall form the basis of, or be relied upon in connection with, any offer or commitment whatsoever in any jurisdiction.
Investment Performance Information: Please remember that past performance is not necessarily a guide to the future and that the value of shares and the income from them can go down as well as up. Exchange rates may also cause the value of underlying overseas investments to go down as well as up. Marten & Co may write on companies that use gearing in a number of forms that can increase volatility and, in some cases, to a complete loss of an investment.