
Global growth with a wider lens
After a tougher period for growth investing, Monks Investment Trust (MNKS) has seen its performance improve over the past year, with contributions from holdings such as TSMC, NVIDIA, SpaceX and Schiehallion. MNKS’ managers observe that the economic landscape is becoming less certain and have been repositioning the portfolio with the aim of it being able to benefit from a wider range of outcomes, beyond the narrow group of AI winners that has dominated recent market leadership, while retaining the trust’s core focus on growth businesses.
The shares trade on a mid-single-digit discount, and this has been narrowing. MNKS’ managers believe there may be scope for this trend to continue if investors continue to favour growth and MNKS continues to deliver improved performance.
Diversified exposure to global growth equities
MNKS invests globally to achieve capital growth, which takes priority over income and dividends. The portfolio would typically consist mostly of global quoted equities, and some private investments, all of which are selected on the basis of the investment case. There are no limits to geographical or sector exposures and MNKS has a policy of using structural gearing, which it states is intended to enhance long-term returns.
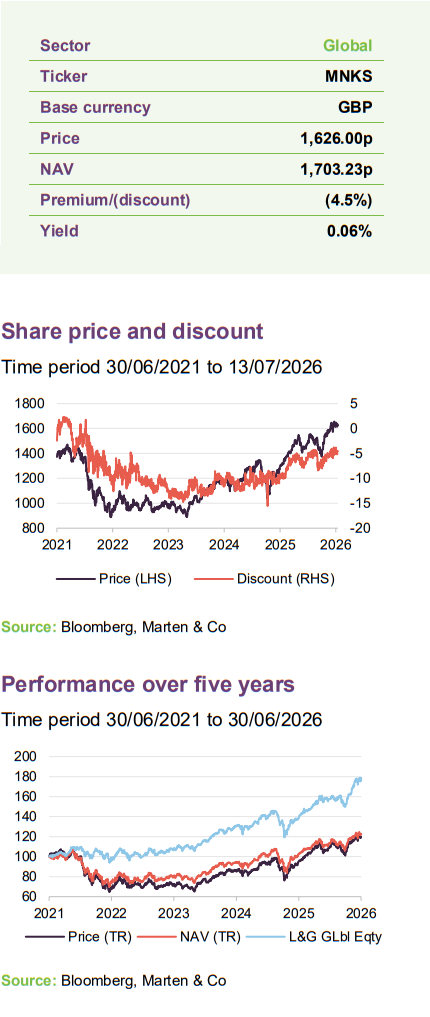
| Year ended | Share price total return (%) | NAV total return (%) | L&G Global Equity Index (%)1 | MSCI World total return (%) |
|---|---|---|---|---|
| 30/06/2022 | (32.1) | (26.4) | (4.2) | (2.5) |
| 30/06/2023 | 6.8 | 9.6 | 13.3 | 14.1 |
| 30/06/2024 | 19.6 | 16.8 | 20.8 | 21.5 |
| 30/06/2025 | 9.7 | 9.2 | 6.3 | 7.6 |
| 30/06/2026 | 25.7 | 19.4 | 28.4 | 26.1 |
Fund profile
Additional information is available at the manager’s website: click here
Balanced exposure to global growth equities
MNKS aims to deliver long-term capital growth, prioritised over income, from a diversified portfolio of global growth companies. The trust is managed by Baillie Gifford’s Global Alpha team, which invests for the long term in businesses that it considers well managed and to have sustainable competitive advantages, reflecting the team’s belief that share prices ultimately follow earnings.
MNKS’ managers invest in companies they believe could double in value over five years or triple over 10 years.
The managers seek companies they believe can at least double in value over a five-year investment period, or triple in value over a 10-year period. Profit growth is typically a key driver, but in some cases that doubling may come from dividends or rerating. The portfolio is unconstrained, typically holds more than 100 companies from around the world, and is designed to exploit what the managers see as an opportunity to outperform markets over the long term. MNKS uses the FTSE World Index for performance measurement, but the portfolio is not constructed with reference to an index and active share is typically around 80% or higher.
MNKS is a stock-picking fund. Its benchmark does not influence portfolio construction.
The process is bottom-up. The managers believe they can add more value by assessing companies’ sustainable growth prospects than by trying to predict short-term share price movements or macroeconomic trends. Much of their time is spent meeting companies and undertaking stock-specific research.
Baillie Gifford has managed MNKS since 1931, shortly after the trust was founded in 1929. However, MNKS has been managed by Baillie Gifford’s Global Alpha team since March 2015. This appears to have marked a reset, with the portfolio subsequently managed as a diversified expression of Baillie Gifford’s long-term global growth approach. MNKS has been a constituent of the FTSE 250 Index since the index’s launch in 1992.
About the manager
Baillie Gifford has 137 investors and analysts based in Edinburgh, with a further four based in both the US and China.
Baillie Gifford has 137 investors and analysts based in Edinburgh, with a further four based in both the US and China, excluding ESG analysts. Structured as a partnership, it seeks to encourage a collegiate investment culture while giving portfolio managers final responsibility for their portfolios. As at 30 September 2025, it managed or advised on around £213.1bn. MNKS and the Baillie Gifford Global Alpha Growth Fund, its open-ended equivalent, had combined assets of roughly £4.4bn as at 31 May 2025. Malcolm MacColl, Helen Xiong and Michael Taylor are all co-managers of the trust. All three are senior members of the Global Alpha team.
MNKS versus its Baillie Gifford global growth stablemates
Baillie Gifford manages several global equity investment trusts across the AIC’s Global sectors. Although portfolio overlap is limited, there may be a temptation to view them as variations on a theme. This may not reflect differences between the trusts. The distinctions between Schiehallion, which takes long-term minority stakes in later-stage private companies with transformational growth potential, and Edinburgh Worldwide, which focuses on global smaller companies growth, seem relatively clear.
However, the differences between MNKS, Scottish Mortgage and Scottish American are also relevant.
The manager says that MNKS occupies a distinct position between Scottish Mortgage (SMT) and The Scottish American Investment Company (SAIN). Like SMT, MNKS is a long-term global growth trust, but it offers a broader and more diversified expression of that approach, typically holding more than 100 companies across a range of growth profiles. SMT is more “high-octane”, taking a concentrated, high-conviction approach to what its managers believe are the world’s most exceptional public and private growth companies.
SAIN has a different role. It is managed as a core global equity income trust, with an objective of growing its dividend ahead of inflation and a portfolio that can also include bonds, property and other asset classes.
In simple terms, SMT is Baillie Gifford’s more ambitious and concentrated global growth trust, SAIN is its global income and dividend-growth option, and MNKS sits between them – designed to be as a more measured, diversified global growth trust, where capital growth remains the priority.
Managers’ view
MNKS’ managers observe that the world is changing, with AI, geopolitics, energy security, infrastructure constraints and changing trade patterns contributing to greater uncertainty and potentially more volatile markets that have been experiencing broad market swings. They also say that bottlenecks are evolving and that this landscape is creating new opportunities beyond the narrow group of AI winners that have dominated recent market leadership.
MNKS’ managers say that it is difficult to predict with certainty who the ultimate winners will be. To manage this, they are building a portfolio designed to benefit from a range of possible outcomes and have been creating space within the portfolio to allocate to their highest conviction ideas.
They say that AI remains a central theme, but the portfolio is increasingly built around the idea that the next phase of growth may also depend on power, infrastructure, resources, manufacturing capacity and financial resilience. The managers comment that they have sought to use recent volatility to upgrade the portfolio’s resilience and to add to high-conviction companies where they believe the market has overreacted.
They say that the portfolio’s fundamentals remain strong, noting it has higher forecast earnings and sales growth than the index, margins and returns they describe as robust, and a valuation premium that has fallen to zero, the lowest point in the last 10 years.
Bottlenecks are evolving
The managers say that, for much of the past 15 years, capital, computing power and resources were relatively abundant, while scarce knowledge workers appeared to allow capital-light digital platforms to capture a large share of profit growth. That balance appears to have shifted over the past year, in their view, with capital, computing power, energy, infrastructure and resources becoming more important constraints. At the same time, AI may be making some forms of intelligence more abundant, they add.
Companies exposed to bottlenecks in the AI hardware build-out, including TSMC, Samsung Electronics and NVIDIA, have been among the clearest winners over the past year. However, MNKS’ managers caution that AI is not a single investment theme with a uniform set of winners, and that not all AI-related exposure is equally attractive. Reflecting this, they have trimmed Samsung and Comfort Systems after strong share price performances, and sold FTAI Aviation. In FTAI’s case, they say that its move into using aircraft engines to power data centres appeared to be a less-certain departure from its core business, while the valuation had also become elevated in their view.
At the same time, the managers believe the market has been too indiscriminate in selling some digital businesses perceived to be vulnerable to AI disruption. Tencent and CoStar were among the detractors during the last financial year, but the managers argue that both may have more protection than the market recognises. Tencent could use AI to improve advertising and engagement, while CoStar owns hard-to-replicate data and marketplace assets that the managers believe should remain valuable even as AI tools become more widely adopted. The managers have therefore added selectively to companies where they believe AI-related fears have gone too far, including Samsara, Shopify and Adyen.
Building a portfolio for a wider range of outcomes
MNKS’ managers say that they are aiming to build a portfolio that can perform across a broader range of outcomes. They have added exposure to physical bottlenecks and real-world constraints, including energy, copper and financials. New holdings include EOG and EQT, which may benefit from tighter oil and gas markets and energy security concerns; Tidewater, which supplies vessels to the offshore oil and gas industry; and Freeport-McMoRan, where copper demand appears to be supported by data centres, electrification, defence, robotics and power grid investment.
The managers have also introduced growth companies, such as Philip Morris International, Midea and Dino Polska, alongside banks including Credicorp, UOB and SEB. They comment that the aim is not to abandon growth, but to broaden its sources and reduce the portfolio’s dependence on any single macro or thematic outcome.
Investment philosophy and process
Baillie Gifford believes markets are inefficient at pricing long-term growth, particularly over periods of five years or more, which it believes can create opportunities to generate alpha. This underpins the firm’s long-term culture and its willingness to “stick with the winners” where it believes there is durable management quality, strong business models and the potential for sustained share price appreciation.
The investment process is research-led and proprietary. Much of the work is carried out by the Global Alpha team, supported by Baillie Gifford’s wider investment platform, local research teams, academics and industry experts. For selected companies, the firm also uses investigative journalists and forensic accountants. Company meetings focus on long-term prospects, management quality and strategic ambition.
Three distinct growth profiles:
- Growth stalwarts
- Rapid growth
- Cyclical growth
The Global Alpha team classifies companies into three growth profiles: growth stalwarts, rapid growth and cyclical growth. Growth stalwarts have established franchises and competitive advantages; rapid-growth companies are described as innovative disruptors targeting large addressable markets; and cyclical-growth companies have management teams that may be able to reinvest capital effectively into structural growth opportunities. This framework is intended to help ensure that the portfolio is not dependent on a single type of growth company, and gives the managers a set of expectations for each holding.
The team builds a forward-looking hypothesis for each investment.
For every potential investment, the team builds a forward-looking hypothesis setting out the core investment case and the milestones against which progress can be monitored. This thesis is continually retested as new information emerges, with particular focus on whether the company appears to remain on track to deliver the long-term growth that justified the original investment.
The team can draw on the resources of Baillie Gifford’s wider “trusted advisor” network.
Idea generation draws on both the Global Alpha team and Baillie Gifford’s wider “adviser” network, including specialist teams covering emerging markets, developed Asia, North America, Europe, durable growth, smaller companies and long-term global growth. A large starting universe is narrowed using liquidity and market-capitalisation screens before detailed research is undertaken on potential candidates.
Research focuses on three broad questions: how large is the opportunity; does the company have the financial strength, management capability and competitive position to execute; and is the growth already reflected in the valuation?
MNKS’ managers have the final decision on which stocks go into the portfolio.
Portfolio construction is the responsibility of MNKS’ managers. When assessing a holding, they ask how the company compares globally, whether the opportunity appears sustainable, where their view differs from the market, and what the stock adds to the portfolio. The managers says that this last point is important: the managers are seeking differentiated ideas, rather than additional exposure to existing themes. Asset allocation is therefore the result of stock selection rather than top-down positioning, with regional and sector exposure reflecting where the team finds long-term growth opportunities.
Smaller “incubator” holdings allow the managers to access higher-risk, higher-reward opportunities while limiting downside.
The managers say that position sizing provides additional risk control. The highest-conviction holdings can exceed 2% of the portfolio, core positions are typically around 1%, and smaller “incubator” holdings of around 0.5% can allow the managers to access higher-risk, higher-reward opportunities while limiting downside if the thesis fails to develop as expected. The managers say that sell decisions are driven by deteriorating fundamentals, loss of confidence in management, valuation concerns or evidence that a company is no longer delivering against its expected growth profile.
The managers say that risk management is embedded in the process rather than imposed through tight benchmark control. The portfolio is diversified by stock, industry, region and growth profile, but the managers say that the guidelines are broad so that they can focus capital where they see opportunities. Baillie Gifford also uses tools such as valuation heatmaps and correlation analysis to identify risk clusters and review portfolio balance. ESG and stewardship are integrated into research, with the team assessing management quality, business models, operating practices and the long-term risks and opportunities that could affect a company’s ability to sustain growth.
Asset allocation
Global equity portfolio with high active share (79%) with biases to the US and emerging markets.
Reflecting the managers’ bottom up approach, MNKS’ asset allocation is driven by the managers’ stock selection decisions, and it has an active share typically in the region of 80%. As is illustrated in Figure 1, the portfolio is global, but has a bias towards North America, which tends to account for 55-60% of the portfolio’s assets, and emerging markets, which accounts for around 20%, with Europe and Developed Asia making up the balance.
Figure 1: MNKS geographic asset allocation as at 31 May 2026
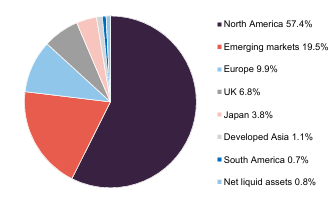
Figure 2: MNKS geographic asset allocation as at 31 May 2025
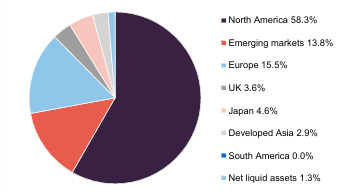
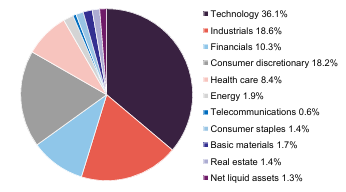
Figure 3: MNKS sectoral allocation as at 31 May 2026
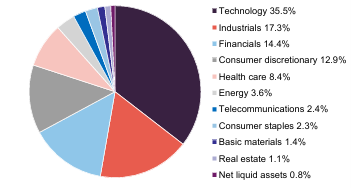
Figure 4: MNKS sectoral allocation as at 31 May 2025
Relative to its comparative index, MNKS’ portfolio is underweight North America, Europe and Japan and tends to be overweight other geographical regions. Comparing Figures 1 and 2, the largest reduction is to developed Europe at 5.6 percentage points. There are also reductions to Developed Asia (1.8ppts), North America (0.9ppts) and Japan (0.8ppts). The largest increase is to emerging markets (5.7ppts). There are also increases in the UK (3.2ppts) and South America (0.7ppts).
MNKS’ portfolio has significant exposures to technology, industrials, financials, consumer discretionary and healthcare.
On an industry basis, the portfolio has exposure to sectors such as technology (around a third of the portfolio), industrials, financials, consumer discretionary and healthcare. Comparing Figures 3 and 4, the largest change is a reduction in consumer discretionary (5.3ppts) and there are also reductions to industrials (1.3ppts) and technology (0.6ppts). The largest increase has been to financials (4.1ppts). There have also been increases to telecommunications (1.8ppts), energy (1.7ppts) and consumer staples (0.9ppts). All other changes are less than 0.5ppt.
Top 10 holdings
Figure 5: Top 10 holdings as at 31 May 2026
| Holding | Sector | Business | Allocation 31 May 2026 (%)1 | Allocation 31 May 2025 (%)1 | Percentage point change |
|---|---|---|---|---|---|
| TSMC | Technology | Semiconductor manufacturer | 6.4 | 3.4 | 3.0 |
| The Schiehallion Fund Limited | Financials | Closed end fund focused on private investments | 5.8 | 2.9 | 2.9 |
| NVIDIA | Technology | Graphics processing, gaming, AI technology | 4.8 | 3.7 | 1.1 |
| Alphabet | Communications | Online search engine | 3.9 | 1.4 | 2.5 |
| Amazon.com | Communications | Online retailer and cloud computing platform | 3.0 | 3.8 | (0.8) |
| Microsoft | Technology | Software and cloud computing | 2.7 | 4.5 | (1.8) |
| Royalty Pharma | Healthcare | Biopharmaceutical royalties portfolio | 2.4 | 1.7 | 0.7 |
| Samsung Electronics | Technology | Semiconductors and consumer goods | 2.4 | 0.6 | 1.8 |
| Meta Platforms | Communications | Social networking website | 2.3 | 4.4 | (2.1) |
| Tencent | Communications | Social media and gaming | 1.9 | – | 1.9 |
| Total of top 5 | 23.9 | 19.9 | 4.0 | ||
| Total of top 10 | 35.6 | 32.8 | 2.8 |
Figure 5 shows MNKS’ top 10 holdings as at 31 May 2026, and how these have changed over the previous 12 months. Six of these holdings were also in the top 10 at the end of May 2025, although their relative positions have shifted. The holdings that have entered the top 10 are Alphabet, Royalty Pharma, Samsung Electronics and Tencent, while Prosus, Elevance, Mastercard and Service Corporation International have moved out. Some of the larger holdings are discussed in more detail over the following pages.
TSMC (6.4%) – critical enabler of the global technology ecosystem
Figure 6: TSMC share price (TWD)
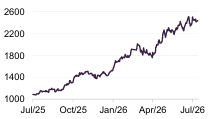
Taiwan Semiconductor Manufacturing Company (TSMC – www.tsmc.com/english) is a dedicated semiconductor foundry. It does not design its own chips, but manufactures them for many semiconductor companies, which provides exposure to growth across smartphones, cloud computing, artificial intelligence, high-performance computing, automotive and industrial applications. It is also a producer of chips used to train AI models, with a share of more than 90% in the most advanced manufacturing processes.
MNKS’ managers says that TSMC’s competitive advantage lies in the scale, precision and complexity of its manufacturing. They believe that its technology leadership, customer importance and exposure to rapid AI growth justify its position as MNKS’ largest holding. They caution that semiconductor demand remains cyclical, capital expenditure requirements are high, and the company is exposed to geopolitical risk around Taiwan. However, they say that TSMC plays a central role in advanced computing, which makes it strategically important within the AI ecosystem adding that, despite its typically conservative guidance, TSMC expects AI-related revenue to grow by more than 50% per year through 2029.
The Schiehallion Fund Limited (5.8%) – private companies with transformational growth potential
Figure 7: Schiehallion Fund share price (US$)
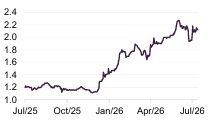
The Schiehallion Fund (MNTN – schiehallion-fund) provides MNKS with exposure to later-stage private companies that have the potential to deliver transformational growth and, over time, list on public markets. Also managed by Baillie Gifford, it invests globally in private businesses that its managers believe have scalable models, strong competitive positions and large long-term opportunities. MNKS’ manager says that the rationale for holding Schiehallion is that it gives MNKS access to areas of innovation before companies reach public markets. As a growth capital fund, Schiehallion has the option to continue to hold these businesses as they mature after IPO.
Schiehallion’s long-term approach is designed to capture value creation through key stages of a company’s development. MNKS’ managers say that this aligns with MNKS’ focus on exceptional growth businesses. Private companies can be harder to value, less liquid and more sensitive to funding conditions, but, as companies appear to be staying private for longer, Schiehallion broadens MNKS’ opportunity set beyond listed equities. As Schiehallion is also managed by Baillie Gifford, MNKS excludes its holding from the asset base on which its own management fee is calculated. This avoids shareholders being charged MNKS’ management fee on top of the fee paid within Schiehallion.
NVIDIA (4.8%) – central to the development of generative AI
NVIDIA (www.nvidia.com/en-gb) designs graphics processing units and related semiconductor systems used across applications including gaming, visualisation, data centres and AI. MNKS’ managers comment that, after years of investment in both hardware and software, it has built a powerful ecosystem around accelerated computing, making its technology central to the training and deployment of generative AI models.
Like TSMC, NVIDIA provides exposure to AI. The managers note that NVIDIA is using its scale and cash generation to reinvest heavily in the opportunity, designing hardware that can make data centres more powerful and energy efficient, while developing software that helps companies adopt AI more quickly.
Figure 8: NVIDIA share price (US$)
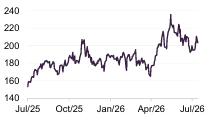
The managers acknowledge that expectations are high, semiconductor demand can be cyclical, export controls remain a constraint and AI-related capital expenditure may prove uneven. However, they believe that NVIDIA’s technology leadership and central position in the chip ecosystem make it a clear AI beneficiary and justify its significant position in MNKS’ portfolio.
Alphabet (3.9%) – exposure to several significant growth themes
Alphabet (abc.xyz) is the parent company of Google, one of the world’s largest internet platforms, built around its core search and digital advertising businesses. MNKS’ managers say that its scale, data resources and distribution give it a strong competitive position, while its cloud business is expanding as demand for AI infrastructure and enterprise digital services grows.
Figure 9: Alphabet share price (US$)
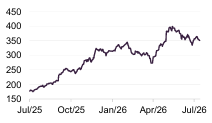
Alphabet provides MNKS exposure to several growth opportunities. MNKS’ managers observe that whilst there were initial concerns that AI could undermine traditional search, Google appears to be in a position to integrate AI into search and could strengthen its core franchise. Its investment in proprietary hardware may also help it capture returns from AI-related cloud demand, while Waymo, its autonomous driving platform, adds additional optionality, in their view. Regulatory scrutiny and competitive pressure remain risks, but Alphabet’s scale, profitability and ability to reinvest across large opportunities appear likely to support its efforts to address these challenges, they add.
Amazon.com (3.0%) – AWS the key growth driver
Amazon.com (ir.aboutamazon.com) is one of the world’s leading ecommerce and technology platforms. MNKS’ managers comment that its core retail business provides scale, customer reach and logistics capability, while the company has expanded into higher-margin areas such as advertising, media and entertainment.
Figure 10: Amazon.com share price (US$)
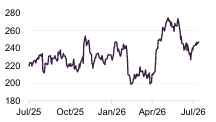
For MNKS’ managers, the key driver is Amazon Web Services, its cloud computing platform and a global leader in a market that still appears to be benefitting from long-term growth in digital infrastructure, data and AI. They say that AWS gives Amazon exposure to enterprise cloud adoption and AI-related computing demand, while the wider group continues to benefit from its ability to reinvest at scale across large addressable markets. The managers acknowledge risks from growing competition, regulation and the capital intensity of logistics and cloud infrastructure, but believe Amazon remains positioned with a potential long growth runway.
Unlisted positions
At 30 April 2026, the latest date for which full portfolio data is available, MNKS held six direct unlisted investments, unchanged from 31 October 2025. However, SpaceX listed on 12 June 2026 following its IPO. As Figure 11 shows, direct unlisted investments accounted for 4.6% of total assets at the end of April. MNKS also had a further 5.4% in The Schiehallion Fund, a listed vehicle that provides additional exposure to private companies.
Figure 11: MNKS’ unlisted holdings as at 30 April 2026
| Stock | Allocation 30 April 2026 (%)1 | Business focus |
|---|---|---|
| ByteDance | 1.6 | Online content platform including TikTok |
| Space Exploration Technologies | 1.4 | Designs manufactures and launches advanced rockets and spacecraft |
| Stripe | 1.0 | Payments platform |
| Epic Games | 0.3 | Gaming software developer |
| Ant International | 0.2 | Chinese online payments and financial services business |
| Silk Invest Africa Food Fund | 0.1 | Africa focused private equity fund |
| Illumina 2 | <0.1 | Gene sequencing business |
| Total unlisted holdings | 4.6 |
Performance
Figure 12: MNKS’ NAV and share price total return versus The L&G Global Equity Index UCITS ETF1 + 3% and MSCI World, rebased to 100 over five years to 30 June 2026
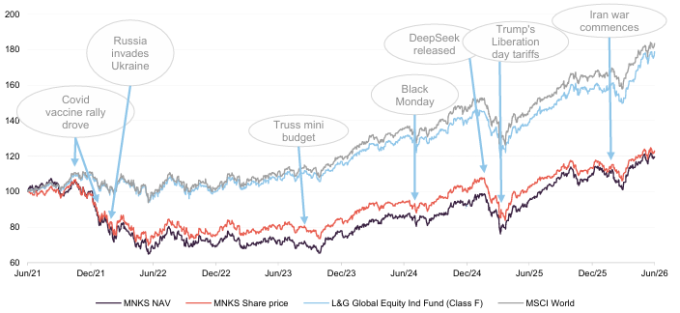
As Figure 12 shows, MNKS’ NAV and share price total returns have lagged global equities, represented by the Legal & General Global Equity Index UCITS ETF, which tracks the FTSE World Index, and the MSCI World Index. Most of this underperformance dates from the vaccine rally in November 2021, when expectations of higher interest rates appeared to trigger a rotation from growth into value. This appeared to be compounded by Russia’s invasion of Ukraine in February 2022, which pushed up energy costs, inflation and interest rate expectations, which appeared to weigh on growth stocks further.
Up-to-date information on MNKS and its peers is available on the QuotedData website.
Figure 12 highlights several other market events over the past five years that appear to have affected returns, often disproportionately for growth stocks. However, most of these effects appear to have been relatively short-lived and have largely reversed over time.
Figure 13 shows that MNKS has outperformed both indices over three years. This may be notable, given its growth bias and the headwind from higher interest rates over much of the period. MNKS has also outperformed the peer group averages over this time, which may reflect the manager’s process and its ability to access private companies such as SpaceX and its very recent purchase of Anthropic.
Figure 13: Cumulative total return performance over periods ending 30 June 2026
| 1 month (%) | 3 months (%) | 6 months (%) | 1 year (%) | 3 years (%) | 5 years (%) | 10 years (%) | |
|---|---|---|---|---|---|---|---|
| MNKS NAV | (0.1) | 12.3 | 8.7 | 19.4 | 52.2 | 22.9 | 245.5 |
| MNKS share price | (1.0) | 15.8 | 8.4 | 25.7 | 65.0 | 19.6 | 283.6 |
| L&G Global Equity Index1 | 0.6 | 19.0 | 13.2 | 28.4 | 64.8 | 78.8 | 240.3 |
| MSCI World | 0.9 | 13.6 | 11.6 | 26.1 | 64.8 | 83.4 | 261.7 |
| Peer group average NAV | 1.5 | 10.4 | 6.3 | 14.2 | 43.0 | 35.9 | 239.5 |
| Peer group average share price | 0.3 | 12.8 | 6.2 | 14.0 | 48.8 | 30.5 | 230.5 |
That said, some investors believe that longer time horizons are generally better barometers for the success of longer-term strategies such as MNKS. In this regard, MNKS has outperformed its peer group average for both NAV and share price over 10 years, and has outperformed the L&G Global Equity Index UCITS ETF over the same period (which is being used as a proxy for the FTSE World Index that it tracks). A more favourable environment for growth investments could also see MNKS extend its outperformance of its peers and close the gap versus these indices.
Peer group
Please click here to visit QuotedData.com for a live comparison of the Global sector peer group.
MNKS is a member of the AIC Global sector, which comprises nine trusts, as shown in Figures 14 and 15. Sector members typically have more than 80% of assets invested in quoted global equities, less than 80% in any one region, an objective focused mainly on capital growth, a portfolio biased towards medium- to giant-cap companies, most expenses charged to capital, and a global benchmark. However, the peer group includes a range of different approaches.
MNKS is growth-focused, although it offers broader exposure to growth stocks than its stablemate Scottish Mortgage (SMT) – arguably its closest comparator – which has a more concentrated portfolio.
Figure 14: Peer group cumulative NAV total return performance to 30 June 2026
| 1 month (%) | 3 months (%) | 6 months (%) | 1 year (%) | 3 years (%) | 5 years (%) | 10 years (%) | |
|---|---|---|---|---|---|---|---|
| MNKS | (0.1) | 12.3 | 8.7 | 19.4 | 52.2 | 22.9 | 245.5 |
| Alliance Witan | 1.9 | 11.7 | 7.0 | 12.8 | 38.9 | 48.1 | 191.7 |
| AVI Global | (4.1) | 4.7 | 0.4 | 5.5 | 36.7 | 40.1 | 179.0 |
| Bankers | 1.8 | 18.5 | 15.5 | 28.2 | 57.9 | 57.8 | 215.7 |
| Brunner | 1.9 | 6.6 | 7.0 | 17.9 | 44.4 | 63.8 | 205.2 |
| F&C | 1.6 | 13.3 | 12.5 | 25.0 | 61.8 | 74.3 | 240.8 |
| Lindsell Train | (2.9) | (3.7) | (16.8) | (23.2) | (8.5) | (11.9) | 217.7 |
| Mid Wynd International | 0.2 | 7.9 | (1.8) | 2.0 | 10.3 | 7.7 | 134.9 |
| Scottish Mortgage | 13.1 | 22.8 | 24.0 | 40.4 | 93.0 | 20.4 | 525.0 |
| MNKS rank | 7/9 | 4/9 | 4/9 | 4/9 | 4/9 | 6/9 | 2/9 |
| Sector arithmetic avg. | 1.5 | 10.4 | 6.3 | 14.2 | 43.0 | 35.9 | 239.5 |
| Sector arithmetic avg. exc. MNKS | 1.7 | 10.2 | 6.0 | 13.6 | 41.8 | 37.5 | 238.8 |
At the other end of the spectrum, Lindsell Train has more of a value bias, investing in companies that its managers view as high-quality, cash-generative, strongly financed and defensible. Mid Wynd describes itself as a quality growth investor, focusing on mature, highly profitable compounders that it believes can sustain high returns on capital and reinvest cash flows for long-term growth. Alliance Witan is a large multimanager trust offering access to a range of stock pickers seeking both capital and income growth. AVI Global focuses on assets it considers undervalued, family-controlled holding companies and other closed-ended funds trading below intrinsic value. The remaining peers generally combine long-term capital growth with income generation. MNKS appears to differ from its peers by combining a capital growth focus with a diversified portfolio.
That growth bias appears to account for MNKS being hit harder than the peer group average during the de-rating of growth stocks that followed the vaccine rally, which is reflected in the five-year numbers in Figure 14. SMT also appears to have suffered more. Setting that period aside, MNKS appears to be among the stronger performers in the peer group across the other periods shown. This includes the past three to four years, despite the apparent headwinds from higher inflation expectations and interest rates, which seem to have intensified this year as the war in Iran has pushed up energy costs. The one- and three-year numbers appear to be particularly strong, potentially helped by gains in holdings such as SpaceX and Anthropic.
The Global sector includes some of the largest trusts in the investment company universe and, although MNKS is the fourth largest, its c.£2.5bn market cap is below the sector average. Its ongoing charges are among the lower in the peer group, ranking second lowest and below those of larger trusts such as F&C and Alliance Witan, which are around 2.6x and 2.0x MNKS’ size respectively. MNKS’ ongoing charges ratio is 13bps below the sector average and, similar to most peers, it does not charge a performance fee.
Figure 15: Peer group comparison – size, fees, discount, yield and gearing as at 13 July 2026
| Market cap (£m) | St. dev. of NAV returns over 1 year | Ongoing charges (%) | Perf. fee | Premium/ (discount) (%) | Dividend yield (%) | Gross gearing (%)1 | Net gearing (%)1 | |
|---|---|---|---|---|---|---|---|---|
| MNKS | 2,504.5 | 17.32 | 0.44 | No | (4.5) | 0.06 | 6.3 | 5.3 |
| Alliance Witan | 4,978.3 | 12.33 | 0.47 | No | (5.0) | 2.19 | 7.7 | 3.9 |
| AVI Global | 996.3 | 15.03 | 0.85 | No | (8.2) | 1.79 | 12.2 | 3.8 |
| Bankers | 1,384.2 | 15.06 | 0.51 | No | (7.8) | 1.83 | 6.0 | 1.7 |
| Brunner | 642.3 | 13.44 | 0.61 | No | (10.6) | 1.81 | 2.0 | 1.9 |
| F&C | 6,446.1 | 13.37 | 0.45 | No | (7.3) | 1.21 | 5.8 | 4.4 |
| Lindsell Train | 112.0 | 18.94 | 0.80 | Yes | (20.3) | 5.00 | Nil | (4.3) |
| Mid Wynd International | 209.3 | 11.63 | 0.64 | No | (1.7) | 1.09 | Nil | (1.6) |
| Scottish Mortgage | 15,573.8 | 25.68 | 0.33 | No | (7.4) | 0.32 | 5.9 | 5.9 |
| MNKS rank2 | 4/9 | 7/9 | 2/9 | 8/9 | 9/9 | 7/9 | 8/9 | |
| Sector arithmetic avg. | 3,649.6 | 15.87 | 0.57 | (7.9) | 1.70 | 5.1 | 2.3 | |
| Sector arithmetic avg. exc. MNKS | 3,792.8 | 15.69 | 0.58 | (8.4) | 1.91 | 5.0 | 2.0 |
MNKS uses gearing to enhance long-term returns and, reflecting this, has the second-highest net gearing in the sector. However, borrowing levels across the peer group remain low and MNKS’ 5.3% net gearing at the end of June remains low relative to the sector.
MNKS’ NAV return volatility is above the sector average, which may reflect its growth focus and its higher sensitivity to shifting inflation expectations and interest rates in recent years. SMT’s NAV return volatility is higher, which may indicate differences in growth exposure between MNKS and SMT.
Dividend
Investors should not purchase MNKS if they require income from their investment.
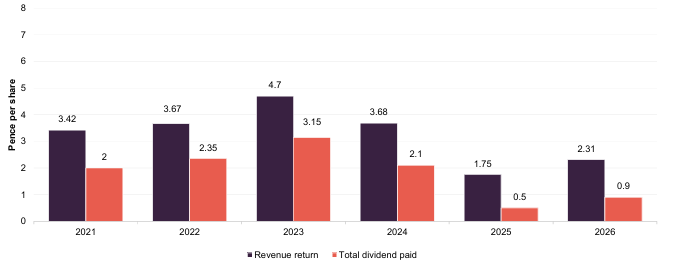
MNKS’ primary objective is capital growth, which is prioritised over income and dividends. Dividends are therefore paid only to the extent required to maintain investment trust status, may vary significantly from year to year, and tend to make up only a small part of shareholders’ total returns. MNKS pays one final dividend each year, subject to shareholder approval at the AGM, usually in September.
For the year ended 30 April 2026, the board is proposing a final dividend of 0.9p per share, up from 0.5p in 2025. This equates to a yield of 0.06%, based on the 1,636.0p share price as at 10 July 2026. MNKS’ revenue income has exceeded its dividend for more than a decade, which has allowed it to build a revenue reserve. As at 30 April 2026, this stood at £75.6m, or 48.04p per share, compared with £72.6m, or 38.69p per share, a year earlier.
Figure 16: MNKS revenue income and dividend by financial year (ended 30 April)
Premium/(discount)
Figure 17: MNKS premium/(discount) over five years
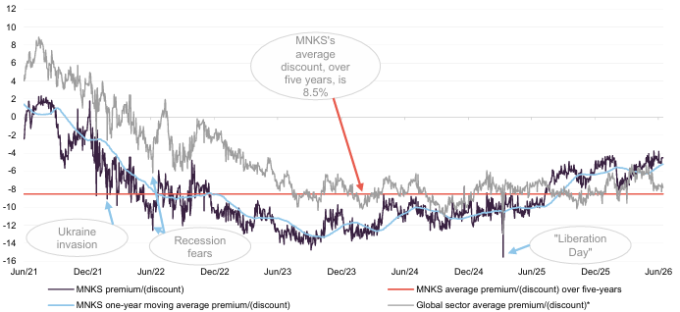
As Figure 17 shows, MNKS traded at a premium until late 2021, when rising inflation expectations and concerns over higher interest rates appeared to push growth stocks out of favour. The trust subsequently moved to a discount, which peaked at 14.7% in October 2023. The board then stepped up buybacks, which appeared to help stabilise the discount. Aside from a brief widening around “Liberation Day”, the discount has narrowed gradually over the past 18 months. This has been more apparent over the last year, which may have been supported by improved performance, including contributions from holdings such as SpaceX and Schiehallion, and by growing investor scrutiny of whether the large sums being invested in AI will generate satisfactory returns.
MNKS now trades at a narrower discount than its longer-term average, which perhaps reflects improving performance and renewed interest in its investment style as growth investing has shown signs of starting to come back into favour. Over the past 12 months, MNKS has traded between a 3.8% and 10.1% discount, averaging 6.3%. As at13 July 2026, it was trading on a discount of 4.5%.
Structure
Fees and costs
MNKS has a tiered management fee.
The manager receives an annual fee of 0.45% of total assets, less current liabilities excluding short-term bank borrowings used for share buybacks, up to £750m; 0.33% between £750m and £1.75bn; and 0.30% above £1.75bn. According to the company, to avoid double charging, this excludes MNKS’ holding in The Schiehallion Fund, which is also managed by Baillie Gifford. Fees are paid monthly in arrears, there is no performance fee, and the agreement can be terminated by either party on six months’ notice.
Baillie Gifford & Co Limited is MNKS’ AIFM and provides company secretarial and administrative services. The Bank of New York Mellon (International) acts as custodian and depositary. General administrative expenses were £474,000 for the year ended 30 April 2026, compared with £510,000 in 2025. Custody and depositary fees were £330,000 and £250,000 respectively, compared with £347,000 and £260,000 the previous year.
Figure 18: MNKS ongoing charges ratio (%)1
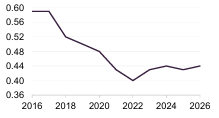
MNKS charges investment management fees fully to revenue. Transaction costs on purchases and sales are charged to capital, buyback and issuance costs are added to buyback costs or deducted from issue proceeds, and tax is allocated to revenue or capital according to the underlying item. The ongoing charges ratio was 0.44% for the year ended 30 April 2026, up fractionally from 0.43% in 2025 and in line with 2024.
As Figure 18 shows, MNKS’ ongoing charges have generally fallen over the past decade, which has been helped by growth in net assets and sustained share issuance during periods of demand. The main exceptions were FY2023 and FY2024. In FY2023, expenses fell but average NAV declined more sharply as growth stocks struggled. In FY2024, expenses edged higher while NAV remained depressed.
MNKS has previously traded at a premium and issued shares, which helped reduce ongoing charges by spreading fixed costs over a larger asset base. Rising inflation expectations in 2021 and 2022 appear to have contributed to the trust moving onto a discount, which prevented further issuance. However, with MNKS now trading on a mid-single-digit discount, a return to a premium and renewed issuance could see the ongoing charges ratio edge lower again, all else being equal.
Capital structure and life
MNKS has one class of ordinary share in issue.
MNKS has one class of ordinary shares, which is listed on the London Stock Exchange. As at 13 July 2026, it had 678,651,858 shares in issue, of which 99,143,930 were held in treasury and 154,027,530 were in general circulation.
The board has set a long-term gearing target of 10% of MNKS’ net assets.
Platforms account for around 46% of the share register, giving MNKS a retail presence. The trust is permitted to borrow and uses structural gearing, with the aim of enhancing long-term returns. The board has set a strategic borrowing target of 10% and expects effective gearing to remain within a range of -15% to +15%.
MNKS uses a mix of long-term structural debt, in the form of loan notes, and shorter-term borrowing. The loan notes were issued when interest rates were low, with covenants limiting total borrowings to 30% of adjusted NAV and requiring minimum adjusted NAV of £650m.
MNKS also has a three-year £100m unsecured floating-rate revolving credit facility with Royal Bank of Scotland International, expiring on 28 November 2027 and paying interest at 1.6% over SONIA. Its loan notes comprise:
- £60m 1.86% Notes repayable in 2054;
- £40m 1.77% Notes repayable in 2045;
- ¥2,500m 2.17% Notes repayable in 2037;
- €18m 4.55% Notes repayable in 2035;
- €35m 4.29% Notes repayable in 2033; and
- €18m 4.30% Notes repayable in 2030.
For the year ended 30 April 2026, the weighted average interest rate across MNKS’ borrowings was approximately 3.4%. As at 30 June 2026, gross gearing was 6.3% and net gearing was 5.3%.
MNKS has an indefinite life and no regular continuation vote or equivalent wind-up mechanism. Its year end is 30 April, with annual results typically released in July, interim results in December, the AGM held in September, and dividends usually paid in September.
Board
Director’s average length of service is 4.6 years.
MNKS’ board typically comprises five directors, but, according to the company, to support an orderly transition ahead of the retirements of Belinda Richards and Sir Nigel Shadbolt at the next AGM, it currently has seven independent non-executive directors. Belinda and Sir Nigel are the longest-serving directors, with tenures of 9.8 and 9.4 years respectively. There are no shared directorships outside the company, aggregate directors’ fees are capped at £400,000 per annum under the articles, and all directors stand for re-election annually. The board’s average tenure is 4.6 years, falling to 2.6 years if the two retiring directors are excluded.
At the time of writing, the board has a 57/43 gender split, with a male chair and women holding the next two senior roles: audit committee chair and senior independent director. It is currently 86% white and 14% Asian/Asian British, with diversity targets incorporated into succession planning.
As Figure 19 shows, five of the seven directors have personal investments in MNKS, with the average holding equivalent to 1.7 years of fees. Some investors view such investment positively as they can help align directors’ interests with those of other shareholders. Two directors bought MNKS shares over the past 12 months: Randeep Grewal purchased 2,000 shares at 1,523.34p on 20 January 2026, and David Ballance bought 4,000 shares at 1,488.91p on 15 October 2025. No directors sold shares during the period.
Figure 19: Board member – length of service and shareholdings
| Director | Position | Date of appointment | Length of service (years) | Annual fee (£)1 | Share-holding2 | Years of fee invested3 |
|---|---|---|---|---|---|---|
| Randeep Grewal | Chairman | 1 March 2024 | 2.4 | 52,000 | 2,875 | 0.9 |
| Claire Boyle | Chair of the audit and risk committee | 1 May 2020 | 6.2 | 43,000 | – | – |
| Stacey Parrinder-Johnson | Senior independent director | 1 March 2024 | 2.4 | 40,000 | 4,500 | 1.8 |
| Belinda Richards | Director | 28 September 2016 | 9.8 | 36,000 | 13,371 | 6.0 |
| Professor Sir Nigel Shadbolt | Director | 9 March 2017 | 9.4 | 36,000 | 2,313 | 1.0 |
| David Ballance | Director | 1 March 2025 | 1.4 | 36,000 | 4,000 | 1.8 |
| Richard Curling | Director | 1 October 2025 | 0.8 | 36,000 | – | – |
| Average (service length, annual fee, shareholding, years of fee invested) | 4.6 | 38,857 | 3,867 | 1.7 |
Randeep Grewal (chairman)
Randeep Grewal was appointed a director in March 2024 and became chairman in September 2025. He read Medicine and Computer Science at Jesus College, Cambridge, and trained as a vascular surgeon before moving into healthcare and technology investing. He joined Tudor Capital as an analyst and portfolio manager in 1998, later serving as a senior portfolio manager at F&C Asset Management and Trium Opportunistic Equity Fund. He is also a non-executive director of the Global Smaller Companies Trust Plc.
Claire Boyle (chair of the risk and audit committee)
Claire qualified as a chartered accountant with Coopers & Lybrand, specialising in litigation support and forensic accounting. She then spent 13 years in equity investment management at Robert Fleming Investment Management, American Express Asset Management and Oxburgh Partners LLP, where she was a partner responsible for its European Equity Hedge Fund. She is a non-executive director of Nippon Active Value Fund, a non-executive director and audit committee chair of Fidelity Special Values, and non-executive chair of Life Science REIT.
Stacey Parrinder-Johnson (senior independent director)
Stacey was appointed a director in March 2024 and became senior independent director in January 2026. She was chief investment officer of Investec Wealth & Investment UK until September 2023, where she also served on the executive management and risk committees and chaired the investment committee. She has 20 years’ experience in asset selection, portfolio management and manager analysis across UK and international mandates, and has experience in investment trust governance, sustainability and risk. She has also served as a pension trustee and has been a governor of the University of Portsmouth since November 2023.
Belinda Richards (chair of the management engagement committee)
Belinda is a former senior partner at Deloitte LLP, with a 30-year career focused on business operations and strategy, particularly in financial services and consumer products. She chairs the audit committee of Schroder Japan Growth Fund and is a non-executive director of Phoenix Group Holdings and YouGov.
Professor Sir Nigel Shadbolt (director)
Sir Nigel is principal of Jesus College, Oxford, a Professorial Research Fellow in the University of Oxford’s Department of Computer Science, and a visiting professor of artificial intelligence at the University of Southampton. He works in open data and artificial intelligence and also chairs the Open Data Institute.
David Ballance (director)
David has approximately 37 years’ investment management experience. He was a partner and investment director at Ruffer LLP from 2007 to 2022 and has been an external member of Christ Church Oxford’s Investment Group since 2012, becoming chair in January 2025. He is also an external investment adviser to the Nuffield Foundation, a trustee director of the NACAB (1991) pension plan, a member of the Book Tokens investment committee, and a trustee of the Fellowship of St John (UK) Trust Association, Pro Corda Trust and St Alban’s Holborn.
Richard Curling (director)
Richard is an investment trust director and fund manager with over 10 years’ specialist experience in investment companies. He chairs Montanaro European Smaller Companies Investment Trust and is a non-executive director of Schroder UK Mid Cap Fund.
IMPORTANT INFORMATION
Marten & Co (which is authorised and regulated by the Financial Conduct Authority) was paid to produce this note on Monks Investment Trust Plc.
This note is for information purposes only and is not intended to encourage the reader to deal in the security or securities mentioned within it.
Marten & Co is not authorised to give advice to retail clients. The research does not have
regard to the specific investment objectives financial situation and needs of any specific person who may receive it.
The analysts who prepared this note are not constrained from dealing ahead of it but, in practice, and in accordance with our internal code of good conduct, will refrain from doing so for the period from which they first obtained the information necessary to prepare the note until one month after the note’s publication. Nevertheless, they may have an interest in any of the securities mentioned within this note.
This note has been compiled from publicly available information. This note is not directed at any person in any jurisdiction where (by reason of that person’s nationality, residence or otherwise) the publication or availability of this note is prohibited.
Accuracy of Content: Whilst Marten & Co uses reasonable efforts to obtain information from sources which we believe to be reliable and to ensure that the information in this note is up to date and accurate, we make no representation or warranty that the information contained in this note is accurate, reliable or complete. The information contained in this note is provided by Marten & Co for personal use and information purposes generally. You are solely liable for any use you may make of this information. The information is inherently subject to change without notice and may become outdated. You, therefore, should verify any information obtained from this note before you use it.
No Advice: Nothing contained in this note constitutes or should be construed to constitute investment, legal, tax or other advice.
No Representation or Warranty: No representation, warranty or guarantee of any kind, express or implied is given by Marten & Co in respect of any information contained on this note.
Exclusion of Liability: To the fullest extent allowed by law, Marten & Co shall not be liable for any direct or indirect losses, damages, costs or expenses incurred or suffered by you arising out or in connection with the access to, use of or reliance on any information contained on this note. In no circumstance shall Marten & Co and its employees have any liability for consequential or special damages.
Governing Law and Jurisdiction: These terms and conditions and all matters connected with them, are governed by the laws of England and Wales and shall be subject to the exclusive jurisdiction of the English courts. If you access this note from outside the UK, you are responsible for ensuring compliance with any local laws relating to access.
No information contained in this note shall form the basis of, or be relied upon in connection with, any offer or commitment whatsoever in any jurisdiction.
Investment Performance Information: Please remember that past performance is not necessarily a guide to the future and that the value of shares and the income from them can go down as well as up. Exchange rates may also cause the value of underlying overseas investments to go down as well as up. Marten & Co may write on companies that use gearing in a number of forms that can increase volatility and, in some cases, to a complete loss of an investment.