Montanaro UK Smaller Companies
Investment companies | Annual overview | 23 June 2023
Riders on the storm
After a tough year for quality-growth strategies of all kinds, Montanaro UK Smaller Companies (MTU) may finally be seeing the light at the end of the tunnel, thanks to the possible plateauing of interest rates.
Manager Charles Montanaro remains focused on picking high-quality stocks with long-term growth potential, sticking with the approach despite the headwinds of early 2022. In fact, the selloff in UK small caps has meant that MTU has become even more attractive on a fundamental basis, with many of its holdings trading on attractive valuation multiples, despite demonstrating the same growth potential.
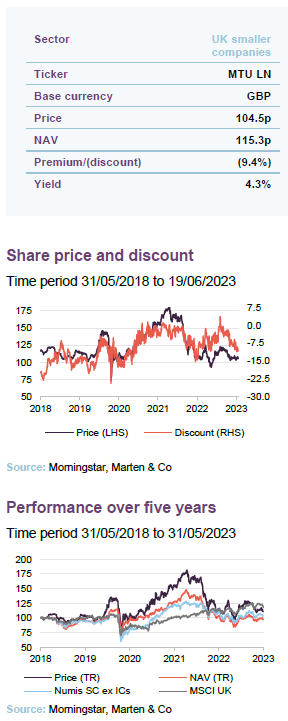
MTU’s discount has widened recently, currently trading on a 9.4% discount. Its combination of increasingly attractive valuations, a wide discount by recent standards, and a possible rebound in performance makes the current environment a potentially attractive entry point for investors looking to tap into a compelling growth strategy.
UK small cap with a bias to quality
MTU aims to achieve capital appreciation through investing in small quoted companies listed on the London Stock Exchange or traded on AIM, and to outperform its benchmark, the Numis Smaller Companies Index (excluding investment companies).

Fund profile
More information is available at the manager’s website www.montanaro.co.uk/muscit.
MTU is a UK smaller companies trust with a focus on capital growth. Montanaro Asset Management Limited (MAML) is the trust’s AIFM. Charles Montanaro established MAML in 1991, and MTU was launched in March 1995 with Charles as its lead manager. He has been the trust’s named manager for about three-quarters of its life, most recently returning in 2016. In 2022, Guido Dacie-Lombardo was appointed as back-up manager to MTU. However, Charles has assured the board that he is happy to remain as MTU’s named manager until at least 2026. Nonetheless, Charles is cognisant of the eventual need for a well-managed transfer of responsibilities, with Guido having a long horizon to gain experience as MTU’s manager.
The trust raised £25m at launch in 1995 and topped that up with a £30m C share issue the following year. Today, the trust has a market cap of £177m. While it has always retained the same focus on UK small-cap opportunities, it has evolved its dividend policy and pays out c.4% of its NAV each year (see page 23).
Readers may wish to refer to our last note.
MAML has one of the largest teams in Europe (and the largest in the UK) focused on researching and investing in quoted small- and mid-cap companies. It boasts 38 team members, including 17 analysts and portfolio managers. The team is experienced, multi-lingual, multi-national (11 different nationalities), and there is relatively little turnover of staff. MAML’s managers believe that the company is best served by operating with a maximum of 40 staff members, so as to preserve the culture of a boutique outfit. We find it encouraging that MAML will continue to devote its resources towards its current strategies, as opposed to aggressively growing the company, for example.
At the end of March 2023, MAML had AUM of more than £3.7bn. Charles Montanaro and his family together own 95% of the business, and head of investments Mark Rogers owns 5%. However, the wider team has options over about half of the equity.
The trust is benchmarked against the Numis Smaller Companies Index (excluding investment companies), and we have also used the MSCI UK Index as a performance comparator in this report. The benchmark plays no part in determining which stocks are selected for the portfolio, or how large positions are as a percentage of net assets.
MAML owns around 5% of the trust, with Charles Montanaro and family owning a further 2.5%, which helps align its interests with those of other shareholders.
Market update
In our last note, Selloff provides opportunities (published on 4 July 2022), we noted that markets had experienced a substantial period of change. Today, we could tell the same story, as over the 11-month period since our last note, we have seen three Prime Ministers, a disastrous budget and almost an entire rate-hiking cycle, all set against the ongoing war in Ukraine.
While political chaos in the UK introduced a new risk-factor, markets have adjusted to the realities of the Ukrainian conflict and rate-hiking cycle, which were recent phenomena at the time of our last note.
Given the strong growth bias of MTU, the overwhelming factor influencing its performance has been the trajectory of UK inflation, and by extension, the Bank of England’s (BoE) interest rate policy. The rate of UK inflation has remained stubbornly high over the last 11 months. Fiscal largesse in the face of COVID played a part in this; the Ukraine war and the jump in energy and food prices that it triggered exacerbated the problem. Now wages are rising, threatening to entrench core inflation.

Given that the UK – and most of the global economy, for that matter – is experiencing inflation rates, and consequently rising interest rates, not seen in three decades, MTU has faced one of the most difficult environments for growth stock investing in its history. Rising interest rates are often the bane of growth stock investing, as a larger portion of the net present value is based on their expected future earnings, hence they are also described as “long-duration” assets. Not only has the risk-free rate risen, but so too has the equity risk premium, as investors become more nervous of the impact of a slowing economy. These headwinds were so strong that 2022 would end up being the second-worst year for UK small-cap growth stocks relative to value in the last decade.
UK small-caps took longer to recover from the mini-budget sell off.
While interest rates and inflation are global phenomenon, the UK has also needed to deal with its own domestic issues, notably the extreme political turmoil that the country has endured over the past 11 months. When we wrote the last note, it would have been unforeseeable for Boris Johnson to have been forced out of power so soon, having overseen the UK’s navigation of COVID-19. However, in a short period we saw Johnson’s resignation, the ill-fated Truss government, and now the apparent stability of the Sunak premiership giving way to renewed infighting.
However, it would be the Truss government’s budget, which sent UK borrowing costs spiralling and encouraged international investors to attach an additional risk premium to UK assets, that did the most damage. This was likely one reason why the more domestically-focused small- and mid-cap areas of the market continued to lag large caps.

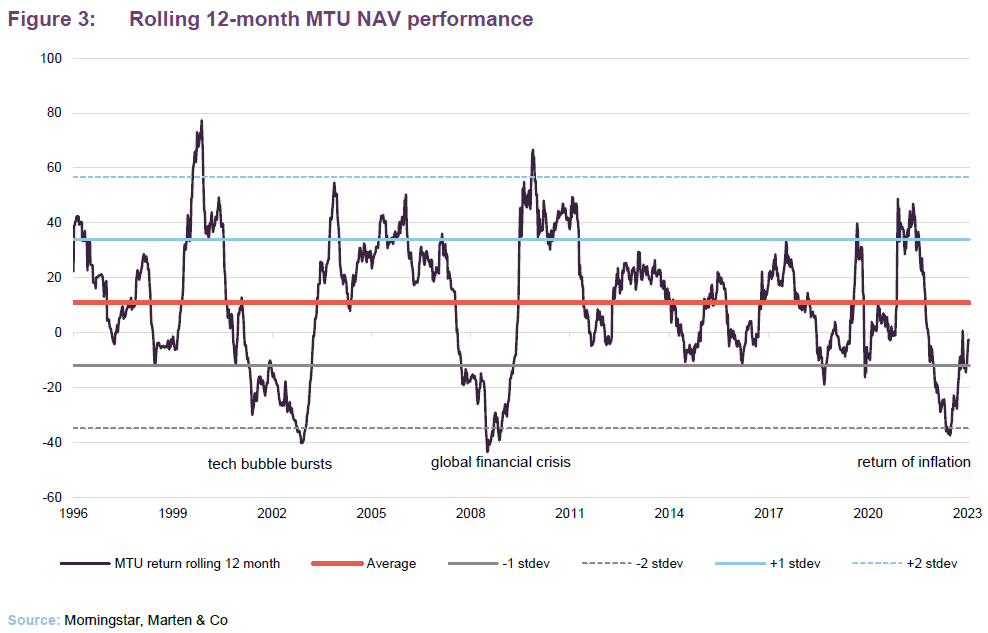
MTU’s negative returns performance rarely stay below two standard deviations for long.
Charles Montanaro, manager of MTU, has in recent conversation reiterated the extreme nature of UK markets, as the last three years have ranked as some of the most difficult and volatile of his multi-decade career.
The severity of the recent headwinds is evident in Figure 3, which shows the rolling 12-month performance of MTU since its inception. Over the last three years we have seen MTU’s performance bounce from being one standard deviation above its since-inception average to two standard deviations below.
As the saying goes, “past performance is not a reliable indicator of future returns”. However, encouragingly in the two other periods when MTU traded two standard deviations below its average, it quickly saw a reversal in its performance.
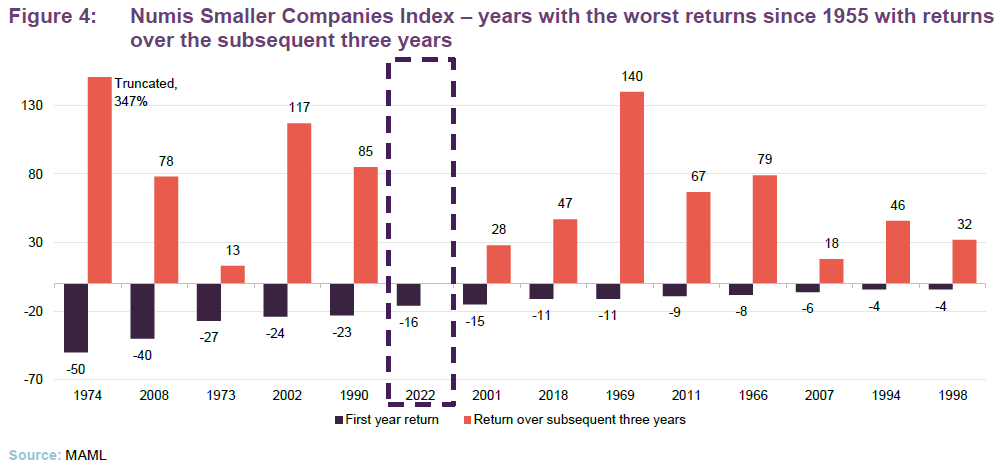
This rebound effect is not unique to MTU, however. Broadly speaking, the wider UK small-cap sector has shown a strong tendency to produce some impressive returns in the three years following its steepest drawdowns.
What goes down may come up
Charles has presented what he believes as a very promising valuation case for a recovery in MTU’s NAV. He says that the recent sell-off in UK small-cap growth stocks does not reflect the underlying fundamentals, at least in the case of MTU’s holdings. The investment cases for many of Charles’s holdings remain just as strong as they were during the 2021 peak of performance.
One of the metrics that Charles presents is the price-to-book (P/B) ratio of UK small caps. The MSCI UK Small Cap Growth Index is trading on a P/B ratio of 2.5 times currently, more than one standard deviation below that of its post-Global-Financial-Crisis (GFC) average, and a valuation opportunity seen once in a decade.
Even more striking is the earnings potential of the UK small cap sector, as its forward price-to-earnings ratio (which is based on the market’s earnings expectations for the next 12 months) recently went two standard deviations below its long-term average, as seen in Figure 5. Even though the index has begun to recover, the valuation opportunity is still one that we have only seen during the most aggressive selloffs of the past two decades; namely that of COVID-19 and the GFC.

A possible near-term end to UK and other developed world interest rate rises may be a powerful tailwind for growth stocks.
The upside potential of the UK small-cap space is not simply due to the market being oversold by skittish investors. The single largest tailwind will likely be the ending of the rate-hiking cycle, as the rate of inflation subsides. This has been helped by a sharp fall in energy prices which drove the earlier surge in inflation. Analysts are predicting a further 50–100bps increase in UK rates, potentially peaking at 6% by the end of the year. Ultimately, however, the market’s treatment of growth stocks will be based more on their expectations of inflation than the actual interest rate.
Whilst it seems unlikely this year, there is also the possibility of a rate cut in the US as its economy slows. There will be huge global implications if the US were to announce a rate cut, impacting even the UK small-cap growth market.
The EU has (just about) slipped into a recession whereas the UK has (just about) avoided one so far, recently posting 0.1% GDP growth over Q1. The BoE projects a flat economy over the rest of 2023 and modest growth thereafter.
We caution, however, that the possibility of unexpectedly sticky inflation in the UK may cause MTU’s current underperformance to buck the trend and persist longer than historically implied, as the UK’s recent high wage growth may give investors pause for thought.
M&A deal flow has been impacted by the higher cost of debt. However, there are still a number of companies and private equity firms that appear to be seeing the fall in UK valuations as an opportunity to acquire world-leading companies at very attractive prices.
MTU has benefitted directly, with the most recent example being the EQT bid for Dechra Pharmaceuticals, first reported in April 2023 – when the bid price was a 47% premium to the undisturbed share price – and recommended by Dechra’s board in June 2023. Dechra Pharmaceuticals was first bought by MTU at flotation in January 2000.
Investment process
MAML’s purpose is to deliver strong and sustainable investment returns to investors by investing responsibly in quoted, high-quality growth smaller companies. It invests conservatively and for the long term and does not invest in derivatives or lend the stock in its portfolios. It avoids loss-making companies, highly leveraged companies and unquoted/illiquid stocks. MAML’s staff are encouraged to invest in its funds, to better align their interests with those of the underlying investors.
MAML has a strong emphasis on proprietary research.
The company has a strong emphasis on proprietary research, while actively avoiding research from brokers. The size of the team makes that achievable and gives MAML a competitive edge.
MAML is an entrepreneurial boutique with a flat structure that allows for quick decision-making and avoids the politics that bog down more bureaucratic large asset managers.
Turnover and transaction costs are kept low, and the team follows its companies closely over many years. The manager says he would rather pay more for a higher-quality, more predictable company that can be valued with greater certainty than a more speculative business.
MAML does not encourage the development of “star” fund managers, but is focused on staff retention, including the granting of staff options over MAML equity. MAML’s “back office” functions are carried out in-house rather than being outsourced (as they are in many smaller investment management boutiques).
The underlying philosophy
MAML’s core values underpin its business and its approach to investing. They are:
- “My word is my bond.”
- “Look after your clients and they will look after you.”
- “Share the same investment risks that your clients do.”
- “You cannot be good at everything – stick to what you are good at.”
- “Stay humble.”
- “Treat your team as you would your family.”
The company invests in simple businesses it can understand.
MAML invests in:
- simple businesses that it can understand;
- niche businesses in growth markets (non-cyclical companies, growing organically);
- market leaders (strong, defensible market positions and pricing power);
- companies with high operating margins and high returns on capital (barriers to entry/a sustainable competitive advantage);
- profitable companies trading at sensible valuations;
- good management that it trusts (aligned to shareholders and demonstrating sound ESG practices); and
- companies that can deliver self-funded organic growth and remain focused on their core areas of expertise, rather than businesses that spend a lot of time on acquisitions.
This could be summed up as investing in high-quality growth businesses at sensible prices.
In addition, MAML believes that it is easier to add value through stock selection for a small and mid-cap portfolio, especially given the relative paucity of research available on these companies.
Selecting the underlying companies
An internal investment committee reviews the portfolio every quarter.
An internal investment committee, chaired by Charles, reviews the portfolio every quarter, which reduces the dependence on any one individual – including Charles – for performance.
MAML follows a two-staged investment process, designed to identify stocks that are both good businesses and good investments. MTU’s portfolio is drawn from a universe of around 1,600 companies, but the trust has a focus on the roughly 440 of those with a market cap between £100m to £1.5bn. Microcap companies (<£100m) are avoided based on the liquidity risk they can pose.
The trust, by virtue of its structure, can have exposure to less-liquid stocks and they have permission to hold up to 40% in AIM stocks. This is less than some of their competitors. In practice, though, it is unlikely that they would hold much more than 30%.
A well-resourced team allows analysts to be well prepared and to set the agenda for meetings with investee companies.
Within its portfolios, including MTU’s, MAML will not invest in tobacco companies; companies manufacturing weapons; those facilitating gambling or manufacturing alcohol; companies engaged in oil and coal-related E&P; companies involved with pornography; and those making high-interest-rate loans. MAML’s corporate governance checks include an assessment of a company’s remuneration policy. The application of this ethical screen reduces the target list to about 415 stocks.
MAML has always generated its own investment ideas rather than relying on brokers, which is fortunate as research coverage of MTU’s target universe continues to fall. A team of analysts, each with their own sector expertise, continually screens the investable universe for new ideas. Research responsibilities are distributed amongst the team on a sector basis (although analysts may also compare and contrast UK companies to global peers). Emphasis is placed on being well-prepared for meetings with potential investee companies, which is possible as the research team is well-resourced. MAML’s analysts can then set the agenda, challenge management and get the information that they need. Site visits are encouraged (another perk of having a large team is that it is not desk-bound).
On average, each analyst will seek to identify 20 stocks within their sector coverage worthy of closer scrutiny.
On average, each analyst will seek to identify around 20 stocks within their sector coverage worthy of closer scrutiny. These will form the pool from which portfolio constituents are drawn.
The first part of the process is to eliminate poor-quality companies. These stocks are identified by applying a quantitative screen to the wider universe. Stocks are ranked based on 14 quality criteria:
Growth
- 5-yr sales growth
- 5-yr EBIT growth
- 5-yr EPS growth
Profitability
- EBIT margin
- Return on assets
- Return on equity
- 5-year average RoE
Leverage
- Net debt/equity
- Interest cover
Cash
- Cash ratio
- Cash conversion ratio
Volatility
- 5-yr sales growth
- 5-yr EBIT growth
- 5-yr EPS growth
Loss-making companies, those with poor cash-flow, and highly indebted businesses are rejected. Stocks that fit structural growth themes that the team has identified may be prioritised. Each company within the universe is assigned a quality rating (D to AAA).
Both management and the board of potential investee companies are closely examined, as MAML looks to predict where a company might be in five to 10 years.
- Management’s track record is analysed to understand their goals and aspirations.
- The board structure is considered, as are the corporate governance and remuneration policies.
- The level of insider ownership is considered.
- On site visits, the team will meet employees who have often not met investors before, believing that doing so allows them to gain a better insight into the products and services provided and observe the culture of the company in a way that is hard to decode from reading an annual report.
Then the detailed work starts. The analysts build a financial model and conduct a “SWOT” analysis on each stock. They also check whether a stock meets MAML’s ESG criteria (see overleaf). Then the idea is put before MAML’s investment committee, who challenge assumptions and ask for more information if they feel this is warranted. Stocks that pass these quality thresholds may then go on to an approved list of over 250 companies. No fund manager can buy a company that is not on the approved list.
Various valuation tools are considered and the team operates with a time horizon of five to 10 years.
Then attention turns to valuation, which is considered as a distinct, second step in the investment process. In this second step, the team has to give consideration to the question of will the good company that it has identified actually make a good investment? These are two separate issues. Various valuation tools are considered (primarily discounted cash flows but also including P/E, free cash flow yields, and dividend yields relative to peers) and the team operates with a time horizon of five to 10 years. The ideal investment should provide a margin of safety in excess of 25% over its intrinsic value.
Analysts will also look at risk factors. Analysts will then assign a recommendation to each stock. These will be presented to the whole team at weekly meetings and the fund managers will then decide which stocks make it into portfolios. Once a stock makes it into a portfolio, it will usually remain there for many years. For example, Dechra Pharmaceuticals was first bought at flotation in January 2000 and so has been a portfolio constituent for 23 years.
Portfolio construction
MTU’s investment policy is more fully described in its annual report. It only invests in listed or quoted securities, and unquoted companies are not eligible for consideration.
Some other rules apply:
- MTU does not hedge its currency exposure;
- At the time of initial investment, a potential investee company must be profitable and no bigger than the largest constituent of the Numis Smaller Companies (ex IC index);
- For risk management purposes, the manager limits any one holding to a maximum of 4% of MTU’s investments at the time of initial investment; and
- MAML will hold no more than 10% of the voting rights in any company (across all funds managed by MAML).
The total number of holdings is typically around 40.
Typically, the target weighting for a new position will be between 1% and 3.5%, depending on both the strength of conviction that the manager has in the stock, and its liquidity. The target number of holdings is typically around 35 to 40 (currently 39). There is no obligation to sell a company if its market cap exceeds €5bn, but these will be gradually recycled into lower market cap companies. The manager will ensure that a single position does not exceed 7.5% of the portfolio, while he also cannot increase the size of a position once its weight exceeds 4%.
The manager adds that when entering into a new position, he typically buys 50% of the target weight initially. If the investment grows to the target weight organically, it is left alone. If it declines following the investment, the manager will add to the investment to take it to its target, if it still meets the required criteria.
ESG analysis.
Sustainability is embedded within the culture of the firm.
ESG analysis has been part of MAML’s investment process for well over 20 years, and sustainability is embedded within the culture of the firm. MAML has been a certified B Corporation since June 2019. Certified B Corporations are legally required to consider the impact of their decisions on their workers, customers, suppliers, community, and the environment. MAML has committed to achieving net zero emissions by 2030, offsets its business travel in conjunction with ClimateCare, supports a number of charities and promotes diversity, equality and wellness within the team.
Having become a signatory to the Net Zero Asset Managers initiative, MAML was the only UK investment boutique to be invited to join the Glasgow Financial Alliance for Net Zero (GFANZ) taskforce. It was also invited to co-chair the B Corporation Investment & Working Group and led a group of investment boutiques to the UN Climate Change Summit COP26 in Glasgow to discuss the benefits of being a B Corporation in the financial sector. MAML has won several ESG & Impact awards and has most recently been awarded the “Best Small & MidCap Sustainable Investment Boutique” award by Ethical Finance.
MAML has an eight-member internal sustainability committee, chaired by Christian Albuisson, which meets quarterly and oversees MAML’s efforts in this area. MAML also has its own handbook, policies and checklists (an ESG checklist is completed for every company, ranking stocks from 1–10 on a range of criteria). It votes on the shares it controls and engages with companies. MAML expects the companies that it invests in to improve their ESG awareness and it monitors their progress.
According to MAML, MTU’s portfolio had a scope 1 & 2 carbon intensity of 78.4 tonnes per million USD of sales, lower than the 118.2 of its benchmark. The trust’s internal ESG score (the weighted average of scores derived from the ESG checklist) was 6.54 at the end of April 2023, which compares to 6.10 at the end of May 2022 (the data we used in our last note).
MAML has recently announced that it will be carbon negative by 2023, having previously set a net zero carbon target in 2019, intending to remove all carbon it has emitted since its founding in 1991. They believe that they are the first UK asset manager to commit to this target. A critical step in achieving this is their partnership with the Danish Carbon Removal Platform company Klimate. Together they will implement projects such as direct air capture; deep storage bio-oil; ocean kelp; and restorative tree-planting; all of which will reduce the carbon footprint of MAML.
Sell discipline
Stocks will be sold if they no longer pass MAML’s quality threshold.
Stocks exit the portfolio for a variety of reasons – for example, when they become significantly overvalued, if they become too big, or due to takeovers.
Furthermore, stocks may leave the portfolio if the analysts identify unfavourable changes in the fundamentals of the business, or an unfavourable management change.
Stocks will also be sold if they no longer pass MAML’s quality threshold, or if a new opportunity comes along that offers better prospects.
Asset allocation
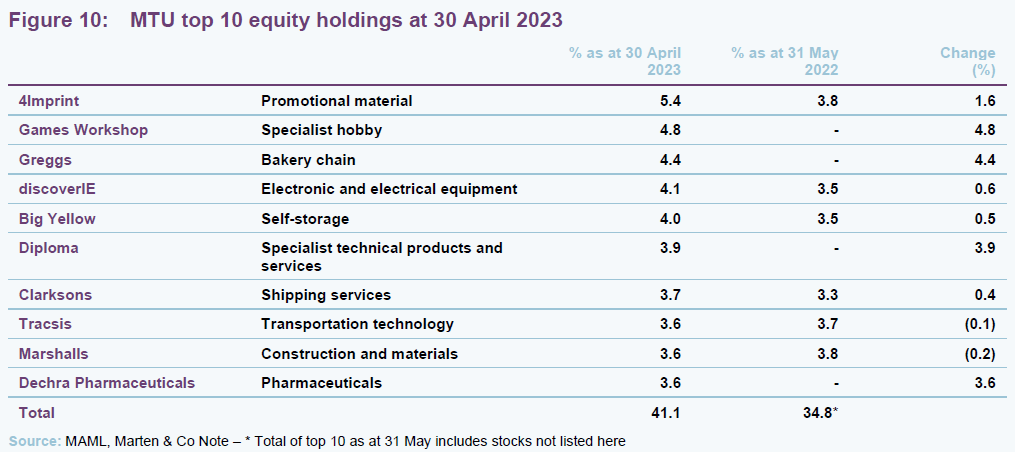
At the end of April 2023, MTU had 40 holdings, down from 44 in May 2022 (the last time we published a note), and the median market cap of the companies it was invested in was £731m. Reflecting the investment style, on average, MTU’s stocks tend to be higher-rated but faster-growing than typical UK smaller companies, with balance sheets also strong. Given the historic lack of “style-drift”, one can reasonably expect MTU to continue to demonstrate those characteristics irrespective of any shifts in asset allocation.
Looking at consensus estimates for the next financial year, the p/e ratio on the portfolio was 18.4x at end April 2023, EV/EBITDA 13.3x, and average EPS growth was estimated at -2.7%. Net debt/equity was forecast at -3.1 (i.e. more cash than debt). Whilst MTU’s P/E and EV/EBITDA are largely consistent with the figures in our last note, MTU’s EPS growth and Net debt/equity have both fallen. The fall in earnings expectations is likely a reflection on the increase in economic pessimism and higher input costs since our last note. However, the decline in the net/debt to equity ratio implies that the overall quality of MTU has increased, with over half of the companies in MTU’s portfolio now having net cash.
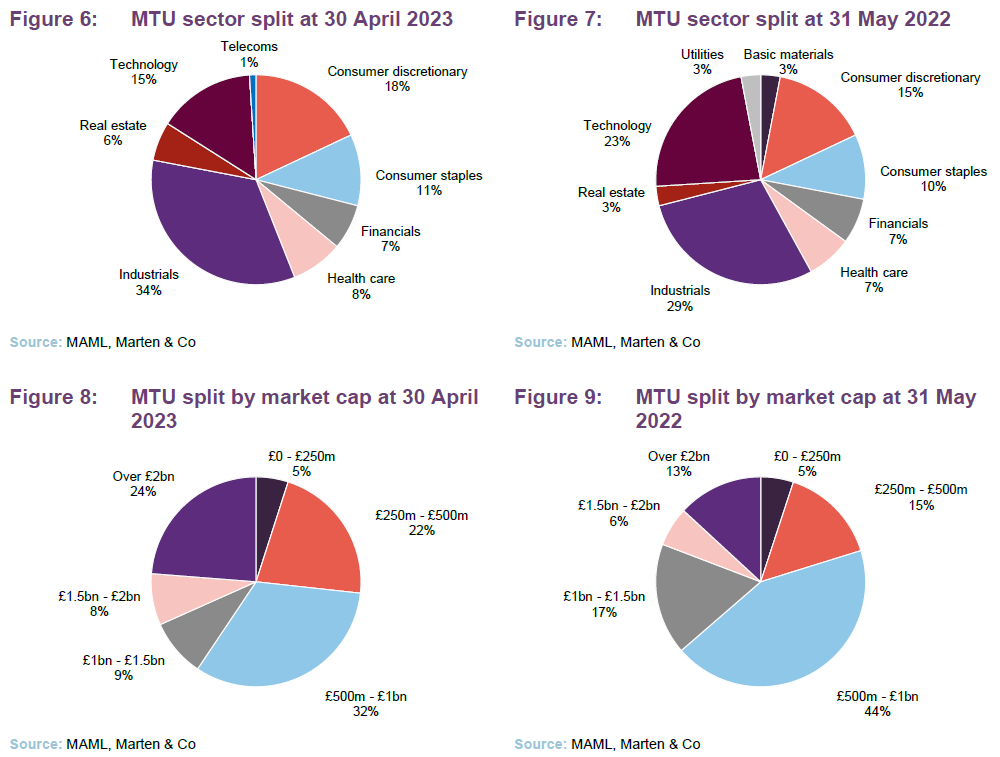
The sector split is driven by MAML’s stock selection decisions. At the end of April 2023, there was no allocation towards energy, basic materials, or utilities. The team has sold out of its utilities and basic materials investments since our last note, which is a reflection of a desire to concentrate the portfolio.
Charles comments that he wants to reduce the number of holdings in MTU to make better use of the closed-ended structure and allow him to back his higher-conviction, more-successful companies for longer. To achieve this, he has sold out of 12 holdings over the past 12 months, while adding two new positions. Ideally, MTU will now operate with a portfolio of 35-40 stocks. He has also increased the maximum position size for a single holding from 5% to 7.5%.
Industrials remain the portfolio’s biggest exposure, with consumer stocks having increased in weighting since our last note, whereas technology has seen a noticeable decrease. On a market-cap level, the largest change has been the increase in exposure to companies over £2bn, which is a result of the recent sales of AIM stocks, helping to reduce MTU’s exposure to the smaller end of the market.
Top 10 holdings
MTU has shifted to a more concentrated portfolio.
The list of MTU’s 10-largest holdings has seen some flux since our last note, turnover of about 20% over the last year is largely in line with that of our previous note. However, it still remains too high for the managers’ liking, and they would ideally like to see an annual turnover of about 10%. Since 31 May 2022, Big Yellow, Treatt, Ideagen and NCC have fallen out of the top holdings, while Dechra Pharmaceuticals, Games Workshop, Greggs, and Diploma moved up to replace them. We note that a large number of the new top-10 entrants are also amongst MTU’s top contributors, thus their shift in the rankings is in large part a reflection of their outperformance.
Games Workshop
Games Workshop (games-workshop.com) is a manufacturer of miniature wargames, and is the owner of the successful Warhammer franchise, which has made expansions into video games and books as well as having a TV series in the works with Amazon. Whilst Games Workshop has benefitted from a loyal consumer base, having been able to achieve meteoric growth between 2017 and 2022, its recent results have shown a fall in profits despite having achieved record revenue (up 7% year-on-year), as higher input costs weighed on the company. Games Workshop remains the world leader in table-top games, and continues to expand its overseas operations, as well as increasing its dividend by 20% for its current financial year.
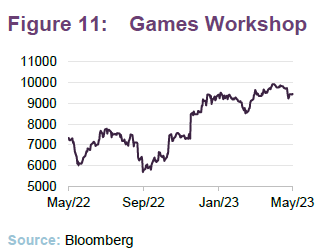
Games Workshop’s share price is still about 20% off its post-pandemic peak. However, it did recover from a setback in the third quarter of 2022 and remains on an upward trajectory, thanks in no small part to its ability to consistently grow its revenues. Its recovery has been so strong that it ranks amongst MTU’s most significant positive 12-month contributors to returns.
Dechra Pharmaceuticals
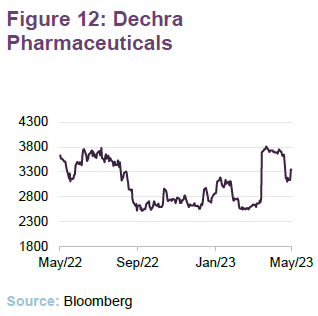
Global veterinary healthcare business Dechra Pharmaceuticals (dechra.com) has recently been subject of a takeover bid by Swedish buyout group EQT, offering £4.6bn for the company, a 47% premium on its close before being bid for. Prior to its takeover bid, Dechra had demonstrated strong growth potential, both organic and inorganic. While Dechra’s revenue had normalised from its post-pandemic boon, it still delivered strong revenue growth, growing 16% over its 2022 financial year. Recent acquisitions, including two US companies – Piedmont Animal Health and Med-Pharmex – contributed to this.
Greggs
Greggs (greggs.co.uk) is a major UK chain of bakeries, a well-known high-street brand, and a constituent of the FTSE 250. Its growth reflects robust demand for its affordable range of products and a successful expansion of its physical footprint, opening more than 160 stores in 2022 alone.
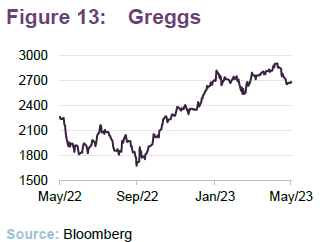
In its most recent update, Greggs reported an 17.1% increase in sales over the first nineteen weeks of 2023, as well as increasing the number of its stores by 6% to 2,365. While food price inflation is an industry-wide issue, profits are expected to rise by 10% this year. Consumers are switching towards lower-cost alternatives as their disposable income is squeezed by higher inflation. Gregg’s share price has substantially outperformed the wider UK small cap market, given its ability to continually demonstrate rising revenues and margins. However, its management has indicated that it expects the pace of growth to normalise in the near-term, as the effects of the post-COVID recovery fall out of the figures.
Diploma
Diploma (diplomaplc.com) is an international group of businesses supplying specialised technical products and services. It operates globally in three sectors: Life Sciences, Seals, and Controls. Because of Diploma’s role in supplying critical components, it has superior defensive characteristics and is less exposed to the cyclical spending habits of its clients than its competitors.
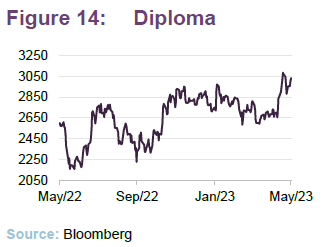
Like the other companies in this list, it also demonstrated strong earnings growth. At the end of its financial year (30 September 2022) it reported an operating margin of 18.9% and revenue growth of 29%. The main driver of this came from a 15% growth in revenues as the company was able to use its commanding position to raise prices to offset inflationary pressures.
New purchases
Although not included in MTU’s top 10 holdings, there have been two new purchases made since our last note; Big Technologies and Spirent Communications. Charles has also built up MTU’s position in LondonMetric Property. He has indicated that going forward, the normal situation will be one-in-one-out when it comes to portfolio changes.
Big technologies
Big Technologies (bigtechnologies.co.uk) produces devices to track and monitor individuals, such as the ankle tags used to track felons, with the criminal justice sector accounting for almost the entirety of its revenues. MTU’s managers were attracted to Big Technologies because of both its dominant global market position and its management’s focused and conservative approach to operations.
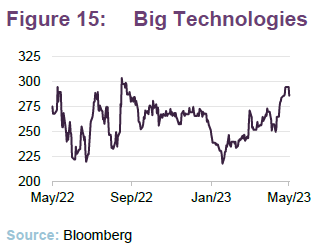
The growth potential of Big Technologies comes through its ability to penetrate a wide range of untapped markets, with it having recently signed a deal with the New Zealand Department of Correction. MTU’s managers also admire its frugal approach to business, such as spending decades in the same HQ building despite its growth. This combination of growth, quality, and cost control saw Big Technologies grow its revenue by 33% year-on-year for 2022, while maintaining profit margins of in excess of 70%. Within these figures, monthly recurring revenues grew by 44%, increasing its earnings visibility.
Spirent Communications
Spirent Communications (corporate.spirent.com) was purchased by the team as a way to capitalise on the global 5G rollout. Located in West Sussex, Spirent focuses on providing telecommunications testing services across the world, with a strong presence in the US.
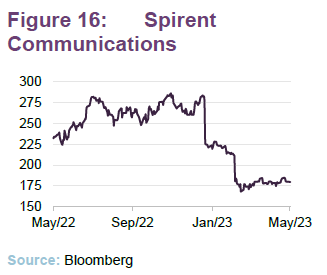
Despite the structural growth themes underpinning Spirent, it was still subject of an aggressive selloff earlier in the year, after announcing a slowdown in client decision making that would make the first half of its year challenging. However, management remains confident in the structural growth drivers behind 5G. We note that despite the caution expressed by Spirent’s management, it still posted a 9% increase in profits for 2022.
LondonMetric Property
LondonMetric Property or LMP (londonmetric.com) is a c.£2bn FTSE 250-listed REIT that owns a portfolio of logistics properties alongside a grocery-led long income portfolio. It categorises its property portfolios in six segments: distribution, retail parks, long income, office, residential, and development.
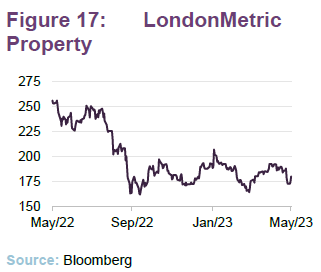
LMP was purchased by the team in Q1 2023, following a major fall in its share price in July 2022. The fall in LMP’s value is not unique to the company, but rather reflects a wider selloff in the sector as investors fear both downward revaluation on the back of higher interest rates, and wider disruption in the commercial property market (a decline in demand for commercial offices, for example). Widespread selloffs create opportunity for more patient investors. LMP’s resilient and diverse portfolio, combined with the fact that interest rate expectations may already be fully reflected in LMP’s share price, makes this an attractive entry point. LMP has recently taken steps to further diversify its portfolio through a £200m bid for CT Property Trust.
Performance
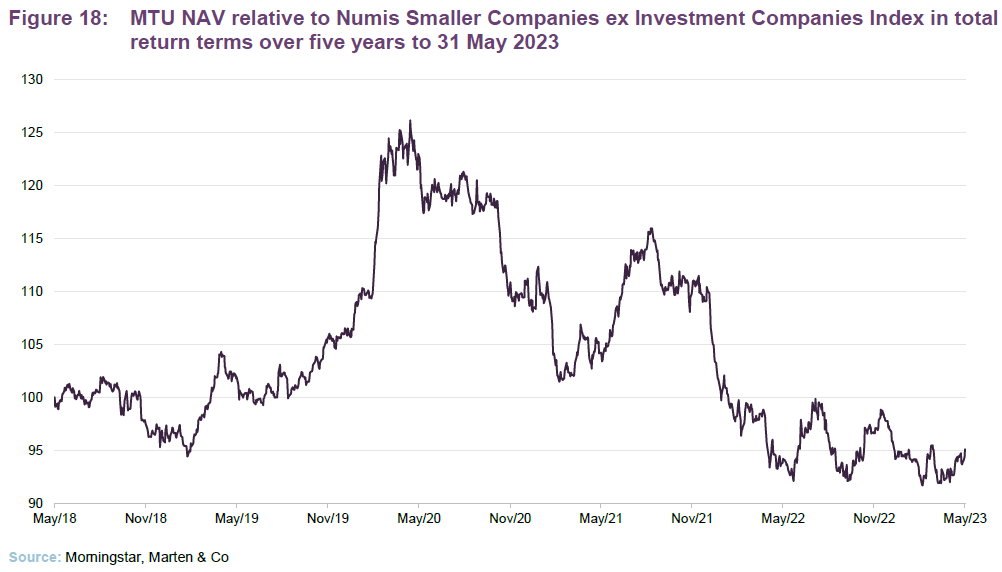

Whilst there are many stock-specific stories behind MTU’s performance, it has been swept up by wider macroeconomic head and tail winds, primarily driven by rising interest rates. MTU’s performance between 2019 and 2021 reflects the powerful tailwinds behind growth stocks, with investors placing an ever-increasing premium on their long-term growth potential, while 2022 saw the reverse in light of rising interest rates. The majority of MTU’s underperformance occurred in the first two quarters of 2022, the period which saw the start of the global interest-hiking cycle.
As we highlight in our market view section, the actual fundamentals of MTU’s portfolio remain largely intact.
There are encouraging signs that MTU’s performance relative to its index benchmark and its peer group is improving. In the near term, stubborn UK inflation is unhelpful. However, Charles remains confident about the longer-term outlook for MTU, based on the factors we outlined on page 5. As UK and global inflation rates
Attribution
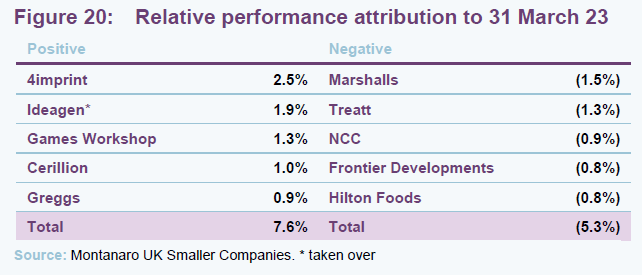
There were a number of standout performers as well as key detractors over the 12 months to 31 March 2023. The top and bottom five performers are listed in Figure 20, and more information about some of them is detailed in the following pages.
Positive contributors
Games Workshop and Greggs were discussed in the asset allocation section above.
4imprint
4imprint (4Imprint.co.uk) is one of the UK’s leading merchandise manufacturers with operations around the world, including a strong presence in the US, but with its headquarters in the UK. Thanks to some very impressive results, its share price has been largely unaffected by the wider market downturn. The company reported organic revenue growth of 45% over 2022 and a more-than-doubling of its operating profit year-on-year.
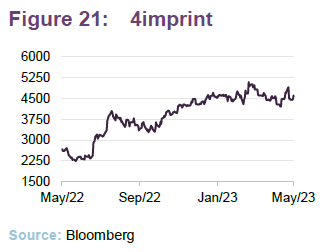
This meteoric growth is in no small part due to the advertising campaign that 4imprint’s management commissioned. This saw it invest heavily in TV and radio, adding more than 300,000 new customers in 2022. The recent rise in 4imprint’s share price may also have been helped by the $2.0 per share special dividend it announced.
Cerillion
Cerillion (cerillion.com) is a UK-based provider of telecom software, providing billing, charging, and customer management systems. Like 4imprint, Cerillion has been going from strength to strength. Not only did Cerillion post strong results for its 2022 financial year ending 30 September, its interim results for end March 2023 reveal equally impressive growth. Over the six-month period, it grew its revenues by 27%, and its profit by 46%, with forecasted full-year revenues of £38.5m and pre-tax profit of £13.8m. However, given its sizable order book, and ability to win new contracts, there is a distinct possibility that it will surpass expectations.
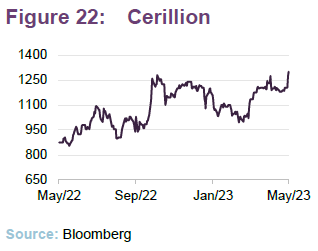
This growth has been generated organically. Cerillion is well placed to capitalise on the trend of increased digitisation of telecoms companies’ operations. Cerillion’s share price has followed an eye-watering trajectory, having IPO’d at 76p per share in March 2016, it now trades in excess of 1400p per share.
Negative contributors
Frontier Developments
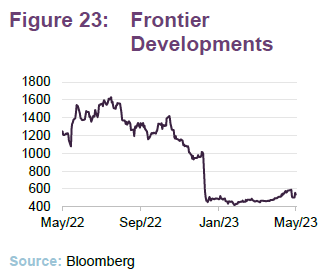
Cambridge-based Frontier Developments (frontier.co.uk) is a developer of software games using Cobra, a proprietary cross-platform technology. It publishes a number of its own game franchises such as Elite Dangerous, Planet Coaster, Jurassic World and Planet Zoo. This is the second note in a row that has featured Frontier as a major detractor from MTU’s returns. This time, there was a sharp fall in its share price in January, following an announcement that the sales of a recently released F1 management game “fell materially below original expectations”. Frontier lowered its revenue expectations as a result, effectively stalling its growth. Unfortunately, this is one in a series of disappointments, following the previous announcements regarding the underperformance of other releases, including Elite Dangerous: Odyssey and Jurassic World Evolution 2.
Hilton Food
Hilton Food (hiltonfoods.com) is a UK-based provider of intentional meat processing and packaging services. Its share price was hit by a profit warning in September 2022. Hilton was hit by a double whammy from higher input costs and consumers cutting back on their consumption of more expensive foods, including meat and poultry. Hilton’s margin came under pressure due to the different customer contract structures that it has in place within the businesses that it has acquired over the last year or so. Unlike the contracts within its existing business, the contracts used by the acquired businesses do not operate on a 100% cost-plus basis. This has meant that Hilton could not automatically pass on price rises as a result, leaving it exposed to the significant hike in seafood prices that occurred in Q2 2022 (following Russia’s invasion of Ukraine). While Hilton could have pushed for higher prices, it took the strategic decision not to aggressively push the full inflationary impact onto the customers of the newly acquired businesses, in order to maintain these relationships. The company was forced to cut its 2022 half-year dividend by 13% as a result.
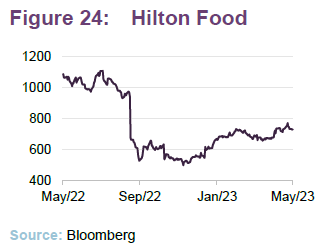
In its 2022 full-year results, management continues to highlight the difficult operating environment, especially the “unprecedented” inflationary pressures it faced, reporting a fall in earnings of 37.5%. Thankfully, from October onwards Hilton will be revising its contracts, aiming to align them with its existing 100% cost-plus basis, which should avoid a repeat of this issue in the future. The MTU team expect its margins to recover over 2023.
Treatt
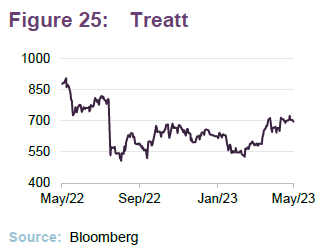
Treatt (treatt.com) is a Suffolk-based firm and is one of the world’s major suppliers of fragrance and flavourings. Treatt’s share price was impacted by problems it faced in the US beverage markets, particularly a weakening demand for iced-tea products and Treatt’s difficulty in penetrating the “hard seltzer” drinks segment. The combination of poor performance in the US as well as a weakened pound led it to announce a profit warning in August 2022, almost halving its full-year expectations, which triggered a 30% drop in its share price. The manager has sold out of Treatt on the back of this weakness, as well as some confusing comments made by the CEO that muddied the ability to make future projections.
NCC Group
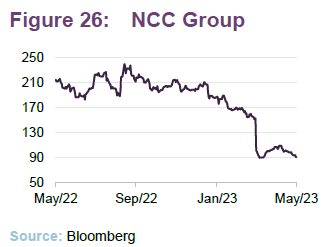
NCC Group (nccgroup.com) is a UK-based cybersecurity firm with operations in both the UK and across the developed world. Its share price fell nearly 50% in a single day on 31 March following a profit warning issue by the company. NCC’s management cited a material increase in market volatility hampering near-term revenues and profitability, particularly in the North American technology sector. As a result, NCC cut its profit forest for the year from £47m to c.£30m. Its management team also expect the current challenges to continue into its next financial year.
Peer group comparison
The peer group that we have used in this note is a subset of funds within the AIC’s UK smaller companies sector. We have omitted split-capital companies, trusts with a small market capitalisation, and those with an exclusive focus on micro-cap companies.
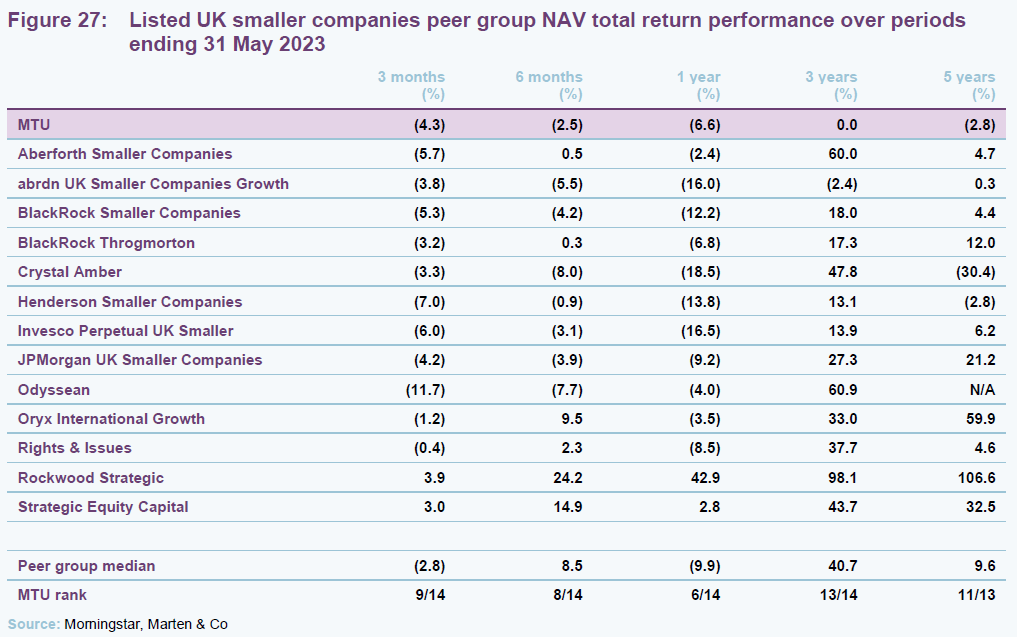
As was the case when we last wrote on MTU, the shift in sentiment away from growth and quality means that its longer-term NAV performance remains amongst the bottom of the pack. However, MTU has begun to climb back up the rankings over the last year, thanks to the possibility of an easing of global inflationary pressures, and a combination of, on average, decent underlying earnings growth and more attractive valuations.
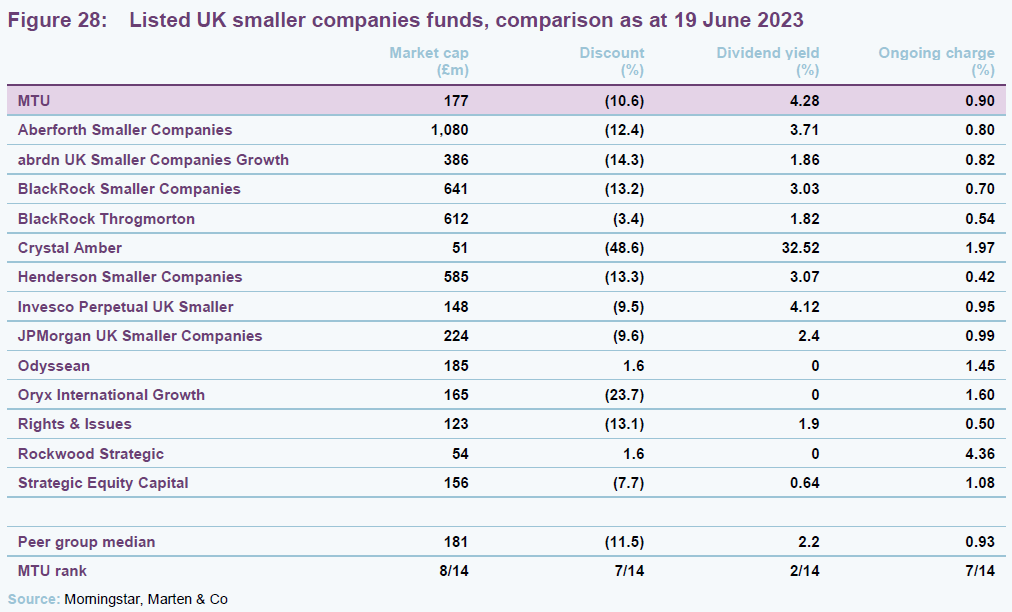
Comparing MTU on other measures as shown in Figure 28, it is a reasonable size – about middle of the pack for this peer group. MTU’s discount has widened since our last note (as have virtually all UK-listed trusts) and is currently middle-of-the-pack, however there is a fairly tight clustering of the peer group around its median discount, so it only takes a small movement to shift within the rankings. We note that MTU has historically ranked higher with respect to its discount, thanks to its loyal shareholder base, and in no small part due to its attractive dividend policy. If we discount Crystal Amber, whose yield is distorted as it is in the throes of winding up, MTU is the highest-yielding trust in the sector.
MTU has a competitive ongoing charges ratio, which is towards the middle of the peer group, especially given its size. MTU’s ongoing charges ratio is comparable to those of much bigger funds in the peer group.
Dividend
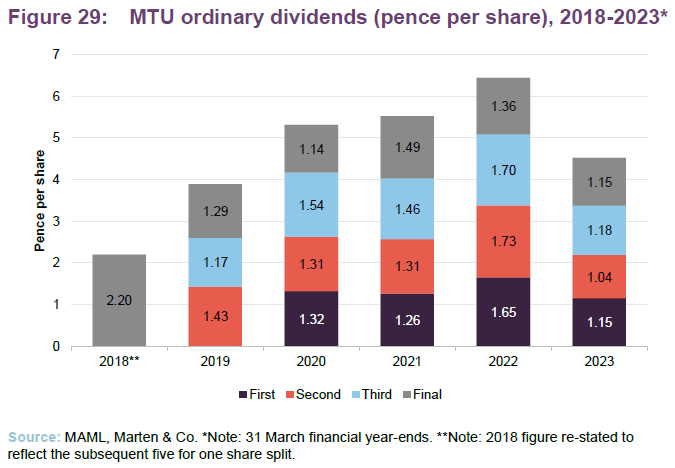
In accordance with a policy introduced in July 2018, MTU pays out 1% of its NAV each quarter as a dividend – a level it considers to be meaningful for investors. Dividends are paid each quarter equivalent to 1% of the company’s NAV on the last business day of the preceding financial quarter, being the end of March, June, September and December. As a result of this dividend policy, the nominal pay out will shift with market performance, with the 2023 dividend being noticeably lower than 2022’s due to the selloff of quality growth stocks.
The enhanced dividend policy has had no impact on the way in which the fund is managed or the yield on the underlying portfolio. To the extent that MTU’s revenues are insufficient to cover the dividend, the balance is met from reserves. MTU’s primary objective is to generate capital growth, with the income generation of the underlying portfolio considered to be a by-product of the stock selection process.
It is important, in our view, to highlight how unique such a dividend profile is amongst the wider investment universe available to UK investors. The combination of a c.4% dividend yield and a quality-growth profile is, outside of the investment trust universe, an effectively unheard-of idea. Companies within the remit of growth and quality-growth strategies do not offer a dividend profile anywhere close.
Premium/(discount)
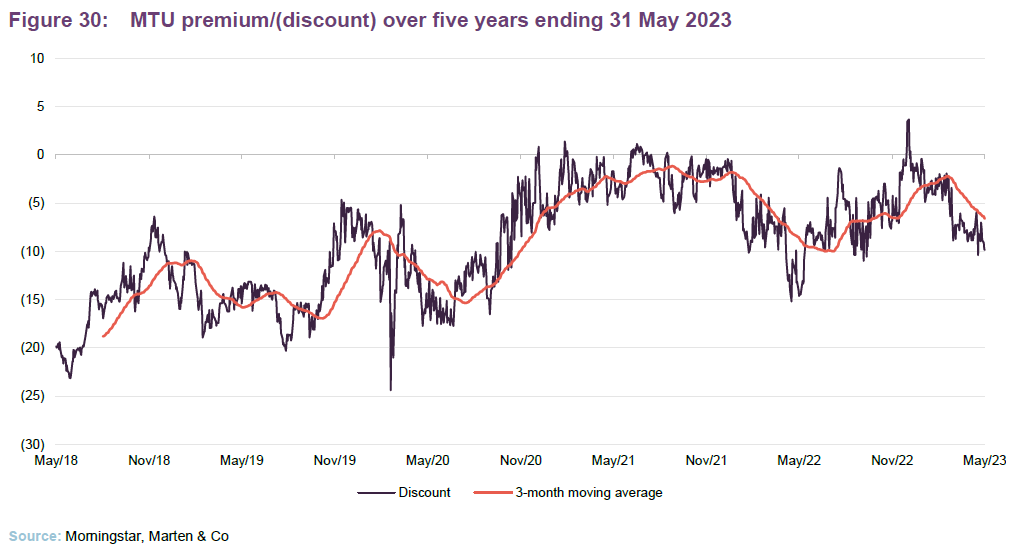
Over the year ended 31 May 2023, MTU’s shares traded in a range from a discount of 14.6% to a premium of 3.7% with an average of a 5.9% discount (and a median discount of 6.3%).
As of 23 June 2023, MTU’s shares were trading at a discount of 9.4%.
MTU’s discount, which began to narrow noticeably upon the introduction of its current dividend policy in July 2018, has widened since the start of 2023, reflecting the negative sentiment around the growth investing, with MTU being given surprisingly credit for its quality bias.
At time of writing MTU’s discount has widened once again, returning to a similar level to that of our last note. This does buck the trend of previous months, given the improving NAV returns of MTU, and may reflect a period of somewhat irrational risk-off behaviour by the market, and thus a possible entry point for investors looking to buy into a growth-biased strategy.
Fees and costs
MTU pays a management fee equivalent to 0.50% of the trust’s gross assets.
As MTU’s investment manager, MAML is entitled to receive a management fee of 0.50% of the trust’s gross assets. There is no performance fee. The AIFM receives an annual fee of £50,000.
For accounting purposes, the management fee is allocated 75:25 between capital and revenue account split. The same allocation is applied to interest accrued on MTU’s borrowings.
MAML may terminate the management agreement on giving 12 months’ notice in writing. The trust may terminate the agreement by notice in writing forthwith or at a specified date. In the event that the trust is the party terminating, the manager will be entitled to a termination fee of 1% of the gross assets of MTU at the end of business on the last day of the calendar month immediately preceding the effective date of termination of the contract.
The company’s ongoing charges ratio for the year ended 31 March 2023 was 0.9%, above the 0.78% of the previous year.
Capital structure and life
MTU has 167,379,790 ordinary shares in issue and no other classes of share capital.
At the AGM held on 12 August 2021, over 99% of shareholders voted in favour of the continuation of MTU for a further five years. The next continuation vote is scheduled to be held in 2027.
MTU’s financial year ends on 31 March. It tends to announce annual results in June and hold its AGMs in July, with this year’s due to be held on 27 July 2023.
Gearing
The AIFM, in consultation with the board, is responsible for determining the net gearing level of the company and approves the arrangement of any gearing facility.
On 17 December 2021, the borrowing facilities with ING Bank were renewed for a period of three years. The interest rate on the £20m fixed rate term loan was reduced by approximately 0.2% per year, which represents a saving for shareholders. Similarly, the £10m revolving credit facility (RCF) was renewed with a lower commitment fee.
At 28 April 2023, MTU was 5.2% geared.
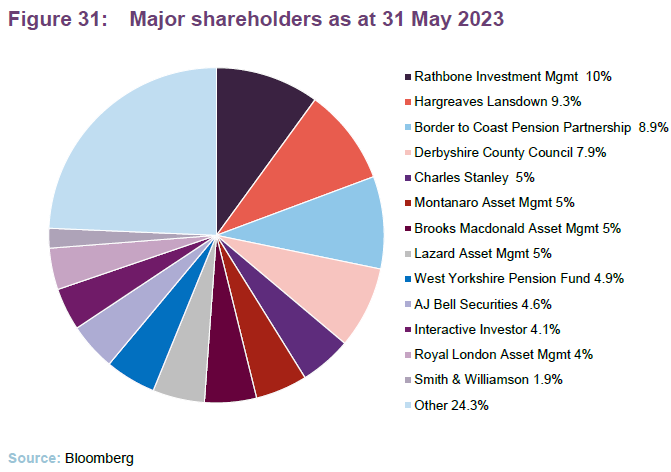
Major shareholders
Board

MTU is managed with a tight board of just four non-executive directors, all of whom are independent of the manager and do not sit together on other boards. Arthur Copple, the chairman, was elevated to that position in July 2019 following the retirement of Roger Cuming. The trust believes a smaller board to be appropriate for its size, allowing it to keep costs down – ongoing charges have been falling.
Having spent more than 9 years with MTU, James Robinson has announced his intention to retire form the company at the July 2023 AGM. He will be succeeded by Barbara Powley as Chair of the Audit and Management Engagement Committee. The other Directors considered their collective skills and used this exercise as a basis for identifying the criteria for a replacement director for James, as well as also considering the updated diversity and inclusion Listing Rule guidance.
Arthur Copple (chair)
Arthur has specialised in the investment company sector for over 30 years. He was a partner at Kitcat & Aitken, an executive director of Smith New Court Plc, and a managing director of Merrill Lynch. Arthur was previously a non-executive chairman of Temple Bar Investment Trust Plc and was formerly the vice-chair of the University of Brighton Academies Trust.
James Robinson (senior independent director and chair of the audit and management engagement committee)
James was chief investment officer (investment trusts) and director of hedge funds at Henderson Global Investors prior to his retirement in 2005. A chartered accountant, he has over 35 years’ investment experience and is a director of JP Morgan Elect Plc. James is also chairman of Polar Capital Global Healthcare Trust Plc, a governor of Lord Wandsworth College and a former chairman of the investment committee of the British Heart Foundation.
Catriona Hoare (independent director)
Catriona’s experience includes having been an investment partner at Veritas Investment Management in London since 2013. Before joining Veritas, Catriona held the position of fund manager at Newton Investment Management.
Barbara Powley (chair of the nomination and remuneration committee)
Barbara was appointed to the board as an independent director in November 2020 before being made chair of the nomination and remuneration committee in April 2021. She has more than 30 years of experience in the investment trust industry, combined with a strong corporate governance and accountancy background.
Previous publications
Readers interested in further information about MTU may wish to read our previous notes listed below. You can read them by clicking on the links or by visiting the QuotedData website.
Figure 33: QuotedData’s previously published notes on MTU
| Title | Note type | Date |
| Reputation restored | Initiation | 5 March 2020 |
| Long COVID effect requires a focus on corporate health | Update | 16 April 2021 |
| Selloff provides opportunities | Annual overview | 04 July 2022 |
Source: Marten & Co
Legal
This marketing communication has been prepared for Montanaro UK Smaller Companies Investment Trust Plc by Marten & Co (which is authorised and regulated by the Financial Conduct Authority) and is non-independent research as defined under Article 36 of the Commission Delegated Regulation (EU) 2017/565 of 25 April 2016 supplementing the Markets in Financial Instruments Directive (MIFID). It is intended for use by investment professionals as defined in article 19 (5) of the Financial Services Act 2000 (Financial Promotion) Order 2005. Marten & Co is not authorised to give advice to retail clients and, if you are not a professional investor, or in any other way are prohibited or restricted from receiving this information, you should disregard it. The note does not have regard to the specific investment objectives, financial situation and needs of any specific person who may receive it.
The note has not been prepared in accordance with legal requirements designed to promote the independence of investment research and as such is considered to be a marketing communication. The analysts who prepared this note are not constrained from dealing ahead of it, but in practice, and in accordance with our internal code of good conduct, will refrain from doing so for the period from which they first obtained the information necessary to prepare the note until one month after the note’s publication. Nevertheless, they may have an interest in any of the securities mentioned within this not.
This note has been compiled from publicly available information. This note is not directed at any person in any jurisdiction where (by reason of that person’s nationality, residence or otherwise) the publication or availability of this note is prohibited.
Accuracy of Content: Whilst Marten & Co uses reasonable efforts to obtain information from sources which we believe to be reliable and to ensure that the information in this note is up to date and accurate, we make no representation or warranty that the information contained in this note is accurate, reliable or complete. The information contained in this note is provided by Marten & Co for personal use and information purposes generally. You are solely liable for any use you may make of this information. The information is inherently subject to change without notice and may become outdated. You, therefore, should verify any information obtained from this note before you use it.
No Advice: Nothing contained in this note constitutes or should be construed to constitute investment, legal, tax or other advice.
No Representation or Warranty: No representation, warranty or guarantee of any kind, express or implied is given by Marten & Co in respect of any information contained on this note.
Exclusion of Liability: To the fullest extent allowed by law, Marten & Co shall not be liable for any direct or indirect losses, damages, costs or expenses incurred or suffered by you arising out or in connection with the access to, use of or reliance on any information contained on this note. In no circumstance shall Marten & Co and its employees have any liability for consequential or special damages.
Governing Law and Jurisdiction: These terms and conditions and all matters connected with them, are governed by the laws of England and Wales and shall be subject to the exclusive jurisdiction of the English courts. If you access this note from outside the UK, you are responsible for ensuring compliance with any local laws relating to access.
No information contained in this note shall form the basis of, or be relied upon in connection with, any offer or commitment whatsoever in any jurisdiction.
Investment Performance Information: Please remember that past performance is not necessarily a guide to the future and that the value of shares and the income from them can go down as well as up. Exchange rates may also cause the value of underlying overseas investments to go down as well as up. Marten & Co may write on companies that use gearing in a number of forms that can increase volatility and, in some cases, to a complete loss of an investment.
