
 Reputation restored
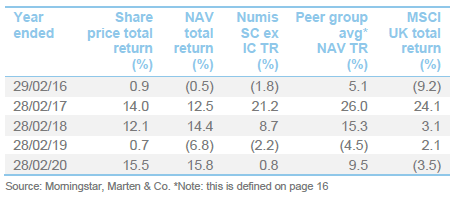
Over the last three and a half years, under Charles Montanaro’s direction, Montanaro UK Smaller Companies Trust (MTU) has rebuilt its long-term record of outperformance of its benchmark. A strong NAV uplift over the second half of 2019 (helped by some clarity on Brexit), where the trust ranked second of 11 funds in our peer group, has improved the trust’s standing against its competitors.
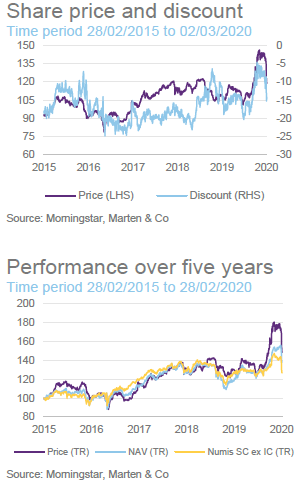
Shareholders have also been rewarded by a marked narrowing of the trust’s discount, although there may be more of this to come – MTU’s discount looks anomalously wide relative to peers (see page 17 in the attached PDF version). In an uncertain economic environment, the trust’s focus on quality companies should serve it well. The manager also notes that the qualities of the portfolio are often appreciated by bidders and expects last year’s strong M&A activity to continue this year, with UK assets attractively priced.
UK small cap with a bias to quality
MTU aims to achieve capital appreciation through investing in small quoted companies listed on the London Stock Exchange or traded on AIM and to outperform its benchmark, the Numis Smaller Companies Index (excluding investment companies).
Returning to quality growth roots
Charles Montanaro established Montanaro Asset Management Limited (MAML) in 1991, and MTU was launched in March 1995 with Charles as its lead manager. He has been the trust’s named manager for about two-thirds of its life, most recently returning in 2016. The trust raised £25m at launch and topped that up with a £30m C share issue the following year. Today the trust has a market cap of £233m.
MTU has lived through some major market events, including the dot-com crash between 2000 and 2002, and the 2008/2009 global financial crisis. The trust’s performance over its history, relative to its benchmark, is captured by Figure 1.
MTU survived its first major market test well, after Charles largely steered clear of technology companies in the late 1990s, believing they were not appropriate for the portfolio. A focus on good quality companies kept the trust away from loss-making, speculative investments. It has also shown up in the portfolio’s experience of M&A – over the trust’s lifespan, 95% of its original portfolio has been taken over.
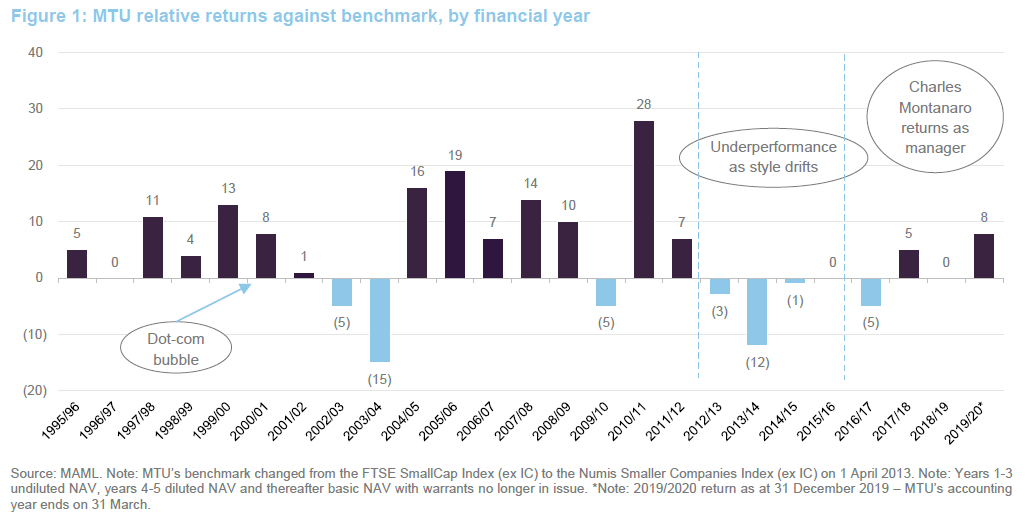
MTU’s most sustained period of underperformance relative to its benchmark came between 2012 and 2016, a period when Charles had stepped back from the lead management role. Performance in 2013/2014 was particularly poor as the trust drifted from its focus on quality growth. At its nadir, MTU’s discount peaked at about 23%.
Charles reassumed the reins in 2016, and a number of steps were taken to improve returns and make the trust more attractive to investors, especially retail investors. Notable moves included selling out of housebuilder stocks and increasing the allocation to technology and asset managers. The trust had no exposure to AIM under the previous lead manager, but this changed in 2016; the trust’s exposure to AIM is limited, however, as we explain later.
Management fees were cut in 2014 and again in 2017, to a competitive 0.5% of the trust’s gross assets. This shows up in the trust’s ongoing charges ratio, which was 0.80% for the year ended 31 March 2019 (details of fees are on page 19; Figure 27 on page 17 shows how MTU compares to its peers). The shares have been split (on a five for one basis) to make them more liquid and an enhanced dividend policy was introduced, more details of which can be found on page 17. Regarding his own future, Charles says that he will stay on as manager at least until 2021 and probably beyond then.
Fund profile
MTU is a UK smaller companies trust with a focus on capital growth. MAML, the trust’s AIFM, has one of the largest teams in Europe focused on researching and investing in quoted small and mid-cap companies. The team is 30-strong all together, including an investment team of 12. The team is multi-lingual and multi-national (10 countries in all). All but two of the fund managers also have research responsibilities. At the end of December 2019, MAML had AUM of over £2.5bn. Charles owns 100% of the business, but staff have options over about half of that.
Day-to-day management of MTU’s portfolio is Charles’s specific responsibility. The trust is benchmarked against the Numis Smaller Companies Index (excluding investment companies) and we have also used the MSCI UK Index and a peer group average (defined on page 16) as performance comparators in this report. The benchmark plays no part in determining which stocks are selected for the portfolio, or how large positions are as a percentage of net assets.
Market backdrop – 2020 likely to be quieter
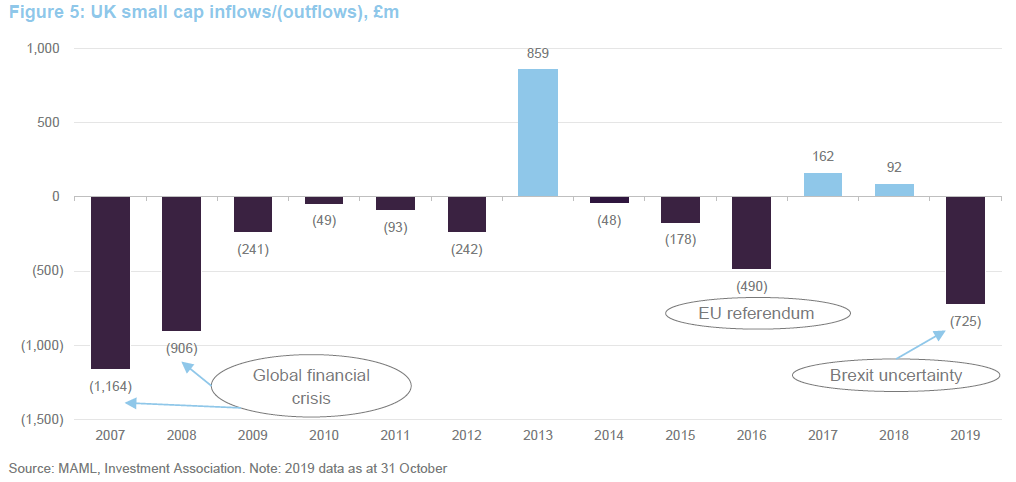
A central message from Charles in our meeting with him was that the portfolio is very much bottom-up-driven. MTU does not attempt to pre-empt macroeconomic shifts. He believed that a strong end to 2019 was likely based on fundamentals and the relative value opportunity that had built up in the portfolio. Net outflows from UK small cap funds in 2019 were the highest since the global financial crisis (see Figure 5). Charles positioned the portfolio to reflect this (see the asset allocation section), with turnover in the holdings and gearing increasing to high levels for the trust.
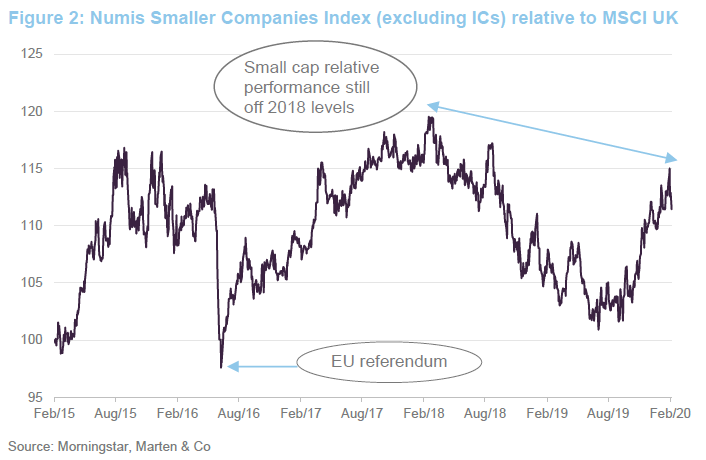
As Figure 2 illustrates, the “buy UK exporters/sell UK domestics” trade that pervaded from around March 2018 meant that a lot of smaller UK companies were attractively valued. With Brexit central to sentiment since 2016, the catalyst for the resurgence in UK domestics was the dodging of a disorderly exit on 31 October 2019, coupled with confidence in the Conservative government’s likelihood of winning a parliamentary majority in the December election. Since the election, moves in UK smaller company stocks and sterling have been muted, with attention switching to the Government assigning a 31 December 2020 deadline to carry out a trade deal with the EU.
Growth in the UK economy has been lacklustre, with GDP growth remaining flat over the fourth quarter of 2019 according to the Office for National Statistics – annual growth was 1.4% compared to 1.3% the year before.
Charles expects a quieter year for small caps in 2020, with less likelihood of the peaks and troughs seen last year. He expects changes to the portfolio to be kept to a minimum. Corporate takeover activity is expected to increase, underpinned by relatively attractive pricing, notwithstanding continued uncertainty over the terms of the UK’s exit, given attractive valuations in UK assets and a historically weak currency (see
Figure 3).
The scale and human cost of the Coronavirus (which at the time of publication is unclear) may provide a significant caveat with respect to broader risk appetite.
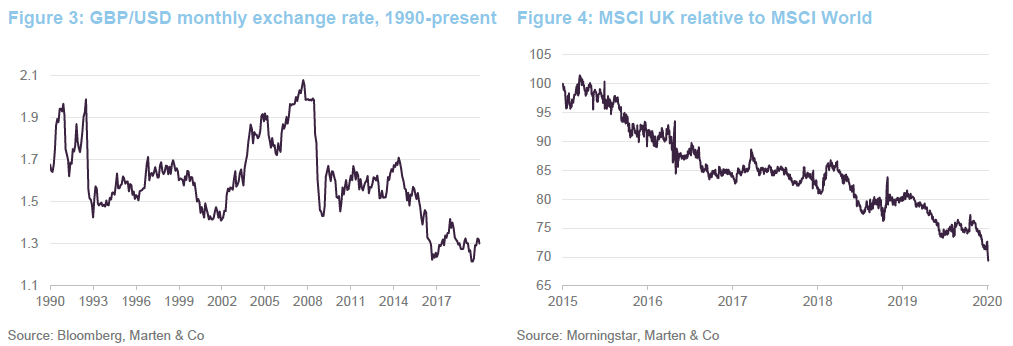
The pre-election rally staged by small caps recouped losses suffered since 2018 (as reflected by the performance of MTU’s benchmark). Charles believes there is more to come with small caps well positioned structurally to outperform most other equity asset classes globally over the next few years. Valuations are above average, but not excessively so. A return of international capital flows should allow UK assets more broadly to revert to mean, particularly as the UK equity market remains inexpensive compared to most developed markets. This should predominantly benefit domestically-focused companies while sterling, as reflected by Figure 3, remains close to its lowest levels relative to the dollar since 1990.
Investment process
MAML invests conservatively and for the long term in quality growth companies. It does not invest in derivatives or lend the stock in its portfolios. It avoids loss-making companies, highly leveraged companies and unquoted/illiquid stocks. MAML’s staff are encouraged to invest in its funds, to better align their interests with those of the underlying investors.
We believe that, post-MiFID II, less research is being produced on small and medium-sized companies, in particular, and the overall quality of that research has declined. MAML counters this with a strong emphasis on proprietary research, while actively avoiding brokers. It also encourages some theoretical research and lateral creative thought. The size of the team makes that achievable and gives MAML a competitive edge. The manager adds that, in addition to the counter provided by its own strong in-house research emphasis, he has found companies to be more receptive to meeting with MAML.
MAML is an entrepreneurial boutique with a flat structure that allows for quick decision-making and avoids the politics that bog down more bureaucratic large asset managers. MAML does not encourage the development of ‘star’ fund managers, but is focused on staff retention, including the granting of staff options over MAML equity. MAML’s ‘back office’ functions are carried out in-house rather than being outsourced (as they are in many smaller investment management boutiques).
The underlying philosophy
MAML invests in:
- simple businesses that it can understand;
- niche businesses in growth markets (non-cyclical companies, growing organically);
- market leaders (strong, defensible market positions and pricing power);
- companies with high operating margins and high returns on capital (barriers to entry/a sustainable competitive advantage);
- profitable companies trading at sensible valuations;
- good management that it trusts (aligned to shareholders and demonstrating sound ESG practices); and
- companies that can deliver self-funded organic growth and remain focused on their core areas of expertise, rather than businesses that spend a lot of time on acquisitions.
This could be summed up as investing in high quality businesses at sensible prices. Furthermore, MAML believes it is important to:
- do the work yourself (rather than relying on brokers);
- be passionate; and
- learn from mistakes (humility goes a long way).
In addition, MAML believes that it is easier to add value through stock selection for a small and mid-cap portfolio, especially given the relative paucity of research available on these companies.
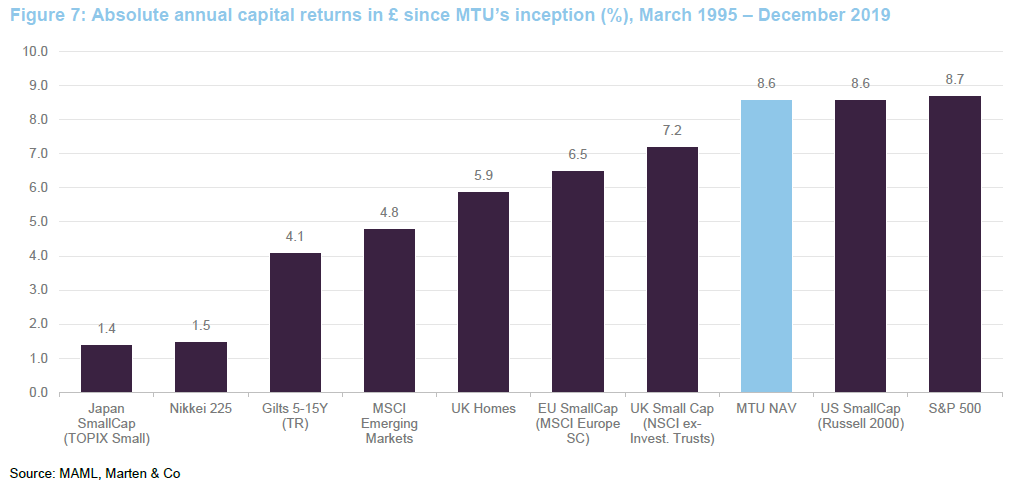
Small cap investing works
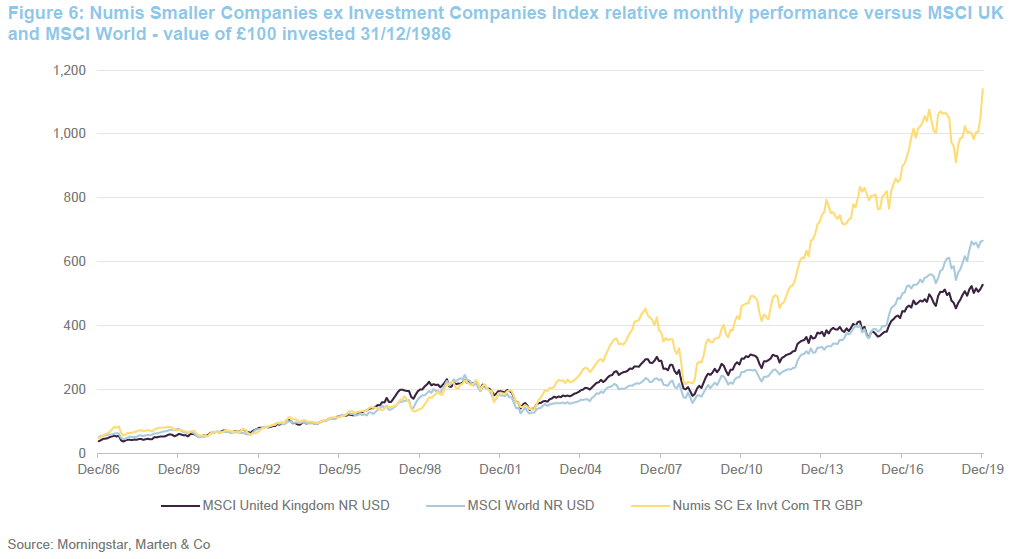
Figures 6 and 7 might suggest that this approach works. Since the global financial crisis in 2008 in particular, UK smaller companies (as represented by Numis SC ex Investment Companies index) have comfortably outperformed the larger companies (as represented by the MSCI UK and World indices).
Selecting the underlying companies
An internal investment committee of six, chaired by Charles, reviews the portfolio every quarter, which reduces the dependence on any one individual – including Charles – for performance.
MAML follows a two-staged investment process, designed to identify matching good businesses and good investments. MTU’s portfolio is drawn from a universe of about 2,000 companies, with a focus on those with a market cap between £100m to £1.5bn (see Figure 10). Microcap companies (<£100m) are avoided based on the liquidity risk they can pose.
The trust, by virtue of its structure, can have exposure to less liquid stocks and they have permission to hold up to 40% in AIM stocks. This is less than some of their competitors. In practice, though, it is unlikely that they would hold much more than 35%.
MAML has always generated its own investment ideas rather than relying on external analysts. A team of 10 analysts, each with their own sector expertise, continually screens the investable universe for new ideas. Research responsibilities are distributed amongst the team on a sector basis (although analysts may also compare and contrast UK companies to global peers). Emphasis is placed on being well-prepared for meetings with potential investee companies, which is possible as the research team is well-resourced. MAML’s analysts can then set the agenda, challenge management and get the information that they need. Site visits are encouraged (another perk of having a large team is that it is not desk-bound).
Both management and the board of potential investee companies are closely examined, as MAML looks to predict where a company might be in 5 to 10 years:
- management’s track record is analysed to understand their goals and aspirations;
- the board structure is considered, as are the corporate governance and remuneration policies; and
- the level of insider ownership is considered.
On site visits, the team will meet employees who have not met investors before, believing that doing so allows them to gain a better insight into the products and services provided and observe the culture of the company in a way that is hard to decode from reading an annual report.
The size of the team allows for some theoretical research and lateral creative thought is encouraged. On average, each analyst will seek to identify 20 stocks within their sector coverage worthy of closer scrutiny. These will form the pool from which portfolio constituents are drawn. The first part of the process is to eliminate poor-quality companies. These stocks are identified by applying a quantitative screen to the wider universe. Loss-making companies, those with poor cash-flow, and highly indebted businesses are rejected. Stocks that fit structural growth themes that the team has identified may be prioritised. Each company within the universe is assigned a quality rating (D to AAA).
Then the detailed work starts. The analysts build a financial model and conduct a ‘SWOT’ analysis on each stock. They also check whether a stock meets MAML’s ESG criteria (see overleaf). Then the idea is put before MAML’s investment committee, who challenge assumptions and ask for more information if they feel this is warranted. Stocks that pass these quality thresholds may then go on to an Approved List of approximately 200 companies. No fund manager can buy a company that is not on the approved list.
Now, attention turns to valuation. Various valuation tools are considered (primarily discounted cash flows but also including P/E, free cash flow yields and dividend yields relative to peers) and the team operates with a time horizon of five to 10 years. The ideal investment should provide a margin of safety in excess of 25% over its intrinsic value.
Analysts will also look at risk factors. Analysts will then assign a recommendation to each stock. These will be presented to the whole team at weekly meetings and the fund managers will then decide which stocks make it into portfolios. Once a stock makes it into a portfolio, it will usually remain there for many years.
Portfolio construction
MTU’s investment policy is more fully described in its Annual Report. It only invests in listed or quoted securities and MAML says that unquoted companies are not eligible for consideration.
Some other rules apply:
- MTU does not hedge its currency exposure;
- At the time of initial investment, a potential investee company must be profitable and no bigger than the largest constituent of the Numis Smaller Companies (ex IC index). At the start of 2020, this was any company below £1.68bn in size (£1.33bn at the start of 2019);
- For risk management purposes, the manager limits any one holding to a maximum of 4% of MTU’s investments at the time of initial investment; and
- MAML will hold no more than 10% of the voting rights in any company (across all funds managed by MAML).
Typically, the target weighting for a new position will be between 1% and 3.5%, depending on both the strength of conviction that the manager has in the stock, and its liquidity. The total number of holdings is typically around 50. There is no obligation to sell a company if its market cap exceeds €5bn, but these will be gradually recycled into lower market cap companies. The manager will ensure that a single position does not exceed 7.5% of the portfolio while he also cannot increase the size of a position once its weight exceeds 4%.
The manager adds that when entering into a new position, he typically buys 50% of the target weight initially. If the investment grows to the target weight organically, it is left alone. If it declines following the investment, the manager will add to the investment to take it to its target, if it still meets the criteria.
ESG analysis
MAML’s focus on quality is supported by its commitment to ESG principles. It has an internal ESG committee that meets quarterly and oversees MAML’s efforts in this area. MAML also has its own handbook, policies and checklists. It votes the shares it controls, and engages with companies. MAML expects the companies that it invests in to improve their ESG awareness and it monitors their progress.
Some sectors are excluded from portfolios on ESG grounds. MAML portfolios will not contain tobacco companies; companies manufacturing weapons, facilitating gambling or manufacturing alcohol; companies engaged in oil and coal-related E&P; companies involved with pornography; and those making high interest-rate loans. Corporate governance checks include an assessment of a company’s remuneration policy.
MAML’s attention to ESG issues extends to its own business. Following an extensive evaluation process, it was made a B Corp Certified company in June 2019 (more information is available at bcorporation.net).
Sell discipline
Stocks exit the portfolio for a variety of reasons. For example, when they become significantly overvalued, if they become too big, or due to takeovers.
Furthermore, stocks may leave the portfolio if the analysts identify unfavourable changes in the fundamentals of the business, or an unfavourable management change.
Stocks will also be sold if they no longer pass MAML’s quality threshold, or if a new opportunity comes along that offers better prospects.
Asset allocation
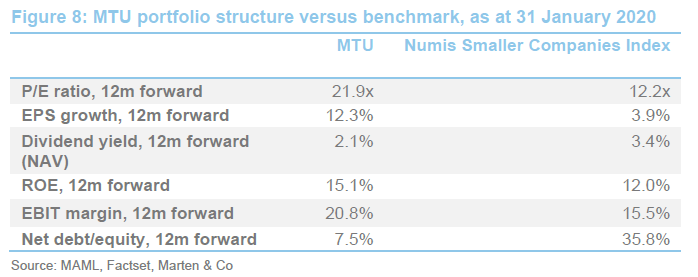
There were 51 holdings in the portfolio at the end of January 2020, including 21 allocations (32.7% of the portfolio) to AIM-listings. Figures 9 and 10 give an indication of the split of the portfolio by industry and market cap. The portfolio has a high active share relative to the Numis Smaller Companies ex Investment Companies index (89% at the end of December) and, based on Factset consensus estimates, has a bias to stocks trading on higher-valuation multiples but exhibiting higher predicted earnings growth, margins and returns on equity, and with stronger balance sheets. These factors are indicative of MTU’s bias to high-quality companies.

In terms of sector exposure, MTU has no investments in oil and gas, commodities, banks, telecommunications and utilities. The portfolio has a deliberate overweight exposure to healthcare, industrials and technology relative to its benchmark. MAML estimates that the portfolio is about 44% exposed to overseas earnings and 56% to the domestic UK economy.
Top 10 holdings
The company’s 10 largest equity holdings as at 31 January 2020 are shown in Figure 11.
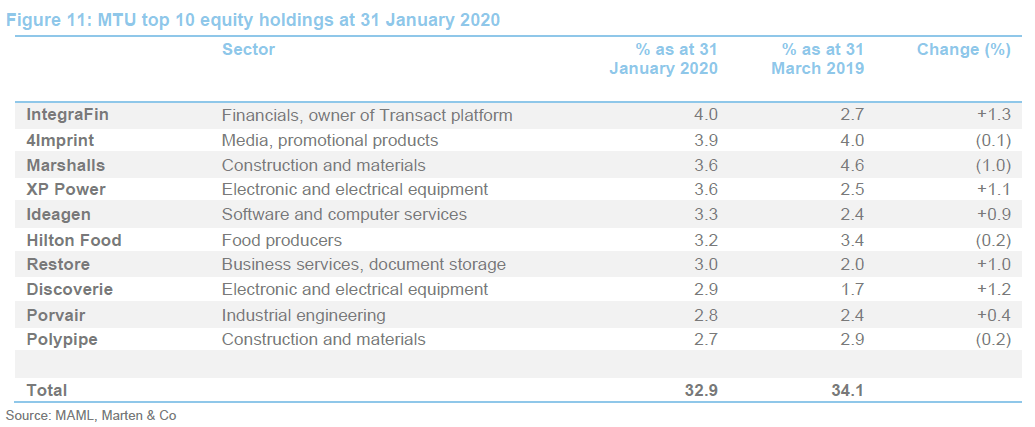
Turnover of 29.2% in the portfolio over 2019 was relatively high for the trust (up from 22.6% in 2018), reflecting efforts to optimally position the portfolio in preparation for what the manager expected to be a strong end to the year. This included removing exposure to any holdings that Charles believed were not growth-oriented.
Another contributing factor was the takeover of four portfolio companies, cumulatively representing around 5% of NAV. The most notable was Entertainment One (a media rights business which owned, inter alia, the Peppa Pig franchise), making it the biggest positive stock contributor to returns in the calendar year (see the performance section). Also bought out were Charles Taylor (a management services business focused on the insurance sector), Consort Medical (drug and delivery device manufacturing for the pharmaceutical industry) and BCA (owner of the webuyanycar website).
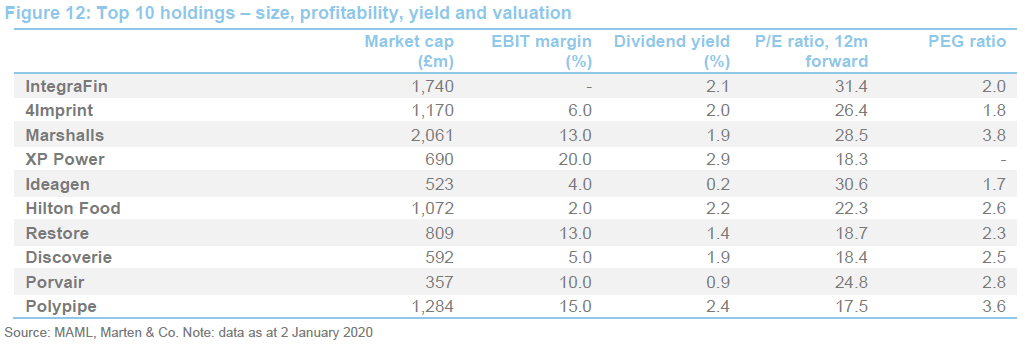
Looking at some of the largest holdings:
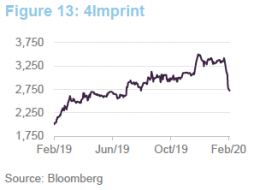
4Imprint
4Imprint (investors.4imprint.com/) is a direct marketing firm specialising in promotional products. It has operations in North America, the UK and Ireland. The company is operating in a very fragmented market (at the half-year stage in 2019, the company thought it had a market-leading 2.6% share of a $28.1bn market. A TV campaign in 2019 helped drive sales as was evidenced in a trading update published in January. Group revenue for 2019 was estimated to be 17% higher than in 2018 and the company was expecting profits at the upper end of analysts’ forecasts.
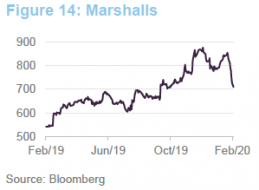
Marshalls
Marshalls (marshalls.co.uk/investor) is a manufacturer and supplier of hard landscaping products, primarily in the UK but also in continental Europe and China. The company is a beneficiary of increased pedestrianisation of cities in the UK. It has also picked up orders in connection with projects such as Crossrail. Charles says it is embracing new technology to digitalise orders and manage its inventory. A trading statement published in January said that revenue for 2019 was likely to be 10% higher than 2018, largely driven by progress in its public and commercial markets.
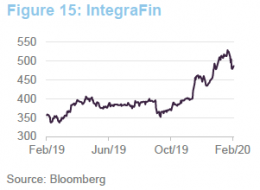
IntegraFin
IntegraFin (integrafin.co.uk/) is the owner of the Transact platform, which is used by UK financial advisers and their clients and provides a range of tax wrappers. It was a notable early provider of access to investment companies. Funds under direction were £39.3bn at the end of December 2019 (up from £31.6bn a year earlier).
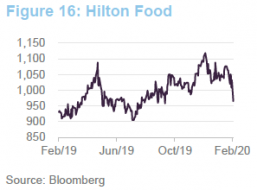
Hilton Food
Hilton Food Group (hiltonfoodgroupplc.com/) is a specialist food packing business with operations across the UK, Europe, Australia and New Zealand. The company started life packing meat for Tesco in Huntingdon. It now works on a much wider range of products for Tesco and with a range of other retailers, including Woolworths in Australia. It recently agreed a joint venture with a Dutch vegetarian product manufacturer and is seeing the benefits of its 2017 acquisition of a fish and seafood business, Seachill, which is working with Tesco and Waitrose.
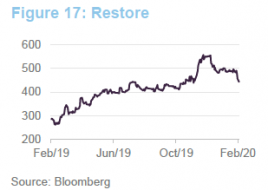
Restore
Restore (restoreplc.com/) is a document storage business focused on the UK. Over the years it has expanded into office moves, secure shredding and recycling. Growth has come both organically and through bolt-on acquisitions (over 30 since its launch in 2010, including TNT Business Solutions in 2018). It has said that trading is in line with expectations with double digit growth in revenue and profits forecast for 2019. The integration of the TNT business is said to be complete.
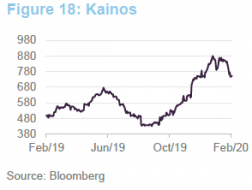
Outside of the top 10, MAML has also been building positions in Kainos.
Kainos
Kainos (kainos.com/) is a software business. It says that it leads large-scale digital transformation across the commercial, public and healthcare sectors. Charles made an investment in the company early in Q4, taking a half weighting, as is his typical approach. The shares have appreciated rapidly since then, however. Interim results, covering the six months ended 30 September 2019, released in mid-November, showed revenue growth of 29% and profit growth of 38%. Kainos is doing a lot of work with various UK government departments and thinks Brexit may stimulate more activity as systems are adapted to reflect the new reality. It is a distribution partner for Workday (an App-based ERP tool) and has been busy opening offices in Europe and North America to support this.
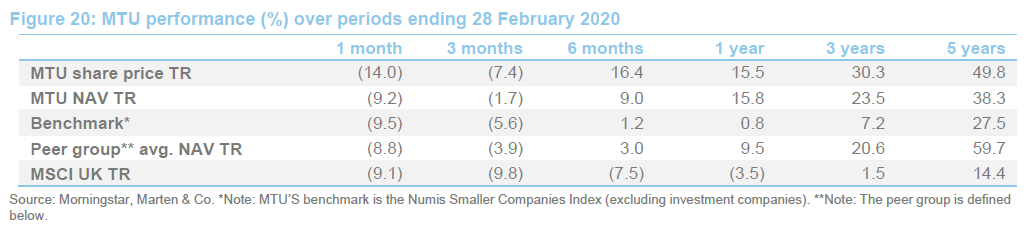
Performance
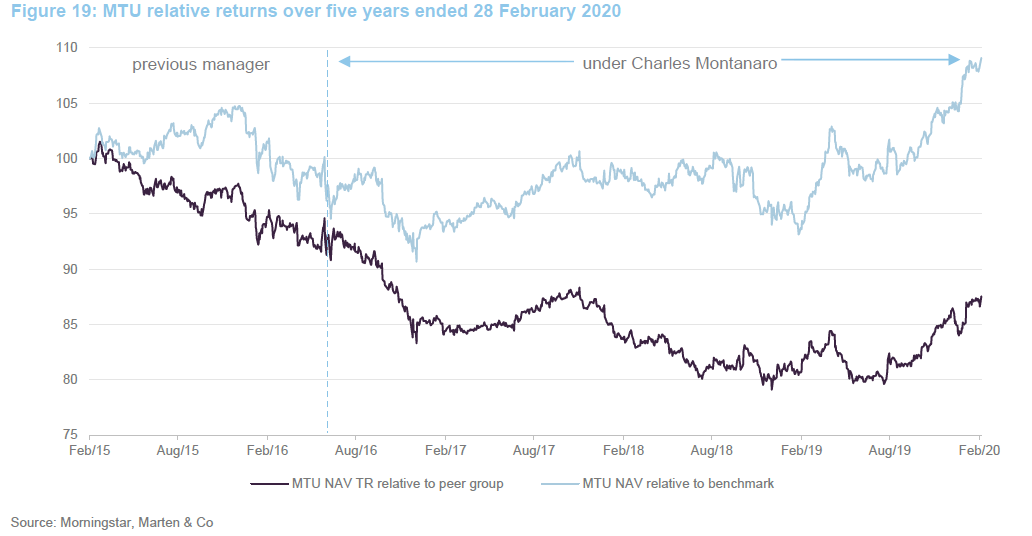
Figures 19 and 20 illustrate MTU’s relative NAV total return performance against its benchmark and peer group (defined below). The marked revival in UK small cap stocks over the fourth quarter of 2019 provided a greater catalyst for MTU’s NAV than either the benchmark or peer group. Performance was particularly good over the first and fourth quarters – December 2019 saw UK small caps have their best month in eight years, as judged by MTU’s benchmark.
Performance attribution
MTU has a greater allocation to the industrials (including 16% in support services) and technology sectors than the benchmark and nearly all of the funds in our peer group. Several companies within these sectors performed very well over the final months of 2019. Having no exposure to the oil & gas sector has also helped.
Figures 21 and 22 show the five largest positive and negative contributions to MTU’s performance over the 12 months ended 31 December 2019.
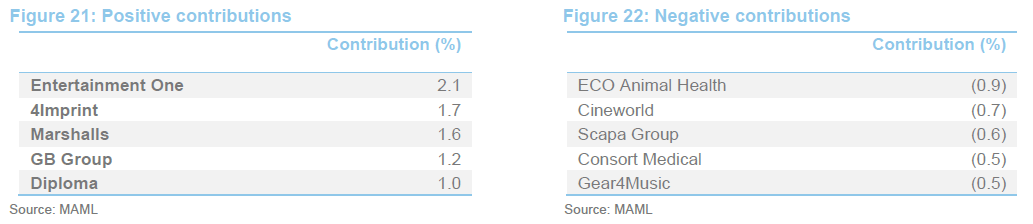
Entertainment One led stock-specific positive contributions to NAV, after it was bought by Hasbro at a 31% premium to its 30-day volume weighted average price. 4Imprint’s shares increased by more than 65% over 2019 while GB Group, a specialist in identity data intelligence, had an even better year with its shares increasing by over 85%. The company continued its upward momentum following a positive trading update in October.

Among the detractors, it was a challenging year for Cineworld (its shares were down nearly 30%), the world’s second-largest cinema-chain. It warned on profits after below-par box office performance from the likes of the Lion King and Frozen 2. Cinema sales were down year-on-year, not helped by the release of some highly-anticipated films, like Avatar 2, being pushed back until 2020. Sentiment towards the cinema business has not been helped by Netflix offering very short cinema release windows for potentially lucrative films, like The Irishman – Cineworld has been targeted by hedge fund short sellers over recent months.
![]()
In the wake of the threat posed by steaming services, the cinema industry has been consolidating – Cineworld announced in December that it had reached an agreement to acquire Canada’s Cineplex for $2.1bn – the deal would make it the largest cinema company in North American by number of screens. Charles says he will stick by Cineworld – he does not believe the company’s balance sheet is as stretched as many believe. He adds that he is not overly concerned by profit warnings, so long as they are not unexpected.
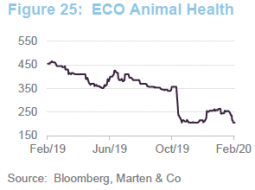
Eco Animal Health, a manufacturer of non-antibiotic pharmaceutical products for pigs and poultry mainly, suffered (the shares were down around 45% at the year-end) as Chinese orders (China accounted for around 20% of sales over the most recent period) fell following an outbreak of avian flu, which has resulted in around a quarter of the world’s pig population being killed. The trade war has also negatively impacted performance. Charles says the company was hit by the perfect storm and that he had not expected the impact to be as big. The shares have recovered some ground over recent weeks and – at least in terms of growth in the business – the fact that revenue has increased over three successive years offers encouragement while operations outside of North America and China have been performing well. The manager added that he saw value in the shares in December, using the sell-off to top up the trust’s position.
Peer group comparison
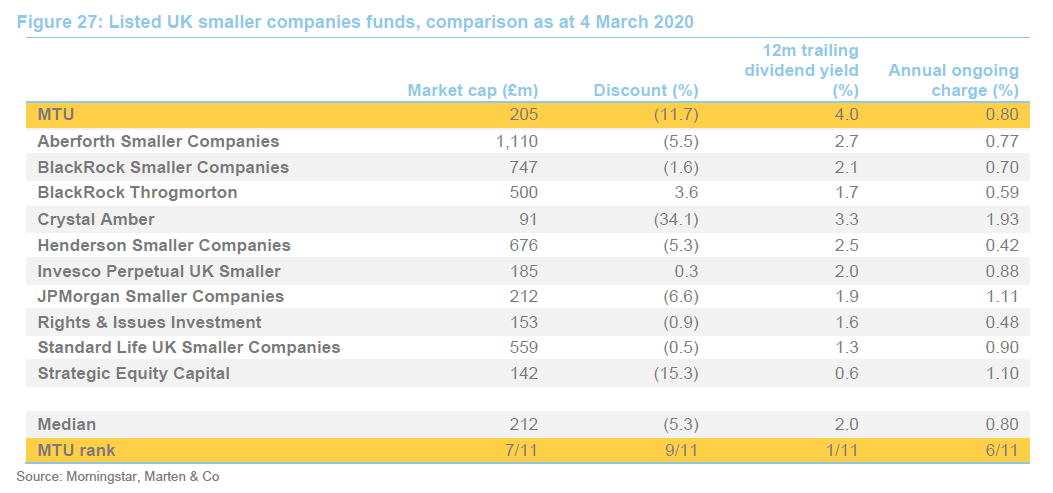
The peer group we have used for the purposes of this note is comprised of a subset of funds in the AIC’s UK smaller companies sector. We have omitted split-capital companies, trusts with a small market capitalisation, and those with an exclusive focus on micro-cap companies. A complete list of the subset is provided in Figures 26 and 27.
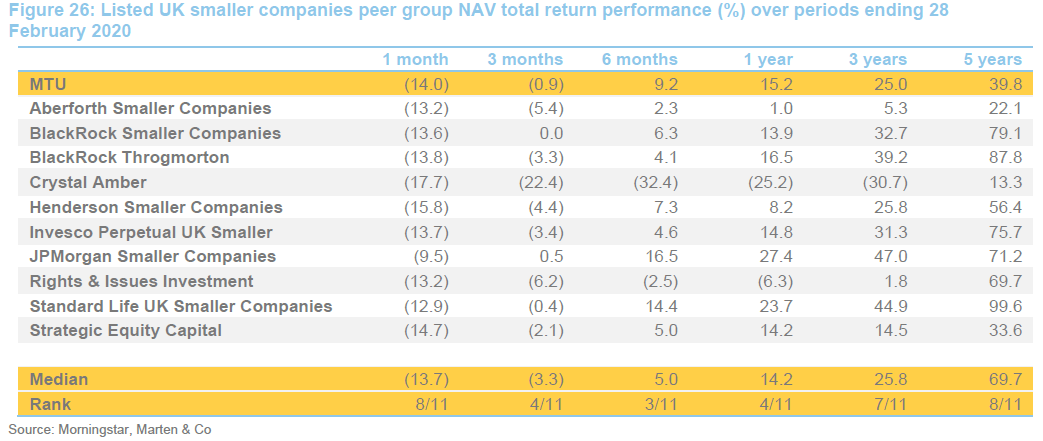
MTU’s relative performance has improved considerably over the past six months particularly. The manager increased gearing in the portfolio towards the end of the year anticipating a strong close to 2019. This came to fruition with MTU delivering the third-best three- and six-month returns in NAV terms. Sentiment towards the trust improved too with a price return of 27% over the three-month period from 1 November 2019 – ahead of peers including BlackRock Smaller Companies, BlackRock Throgmorton and Standard Life UK Smaller Companies.
MTU’s dividend yield, illustrated in Figure 27, merits highlighting. It is the sector’s highest – reflecting the shift to quarterly distributions in mid-2018 (see the dividend section). We note that MTU’s forward (12 months) dividend yield currently stands at 4.4%. Also worth mentioning is MTU’s ongoing charges ratio, which is competitive for its size, while its discount remains higher than the sector’s median, representing an opportunity if recent strong performance encourages this to narrow.
Dividend
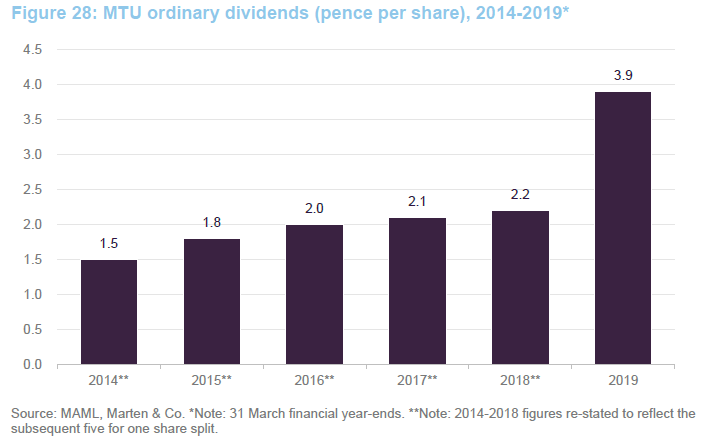
In accordance with a policy introduced in July 2018, MTU pays out 1% of its NAV each quarter as a dividend – a level it considers to be meaningful for investors. Figure 28 illustrates the difference the change in policy had on the total distribution in 2019.
The decision to switch to quarterly distributions was made to increase the relative appeal of the trust, particularly among retail investors, with interest rates around the world remaining artificially low.
Charles says that the revised dividend policy has had no impact on the way in which the fund is managed or the yield on the underlying portfolio. MTU’s primary objective is to generate capital growth with the income generation of the underlying portfolio considered to be a by-product of the stock selection process.
The capital account is used to make up for any shortfalls in the revenue account. Dividends are declared in July, October, January and April and paid in August, November, February, May.
Premium/(discount)
As exhibited by Figure 29, MTU’s discount had narrowed sharply from October 2019, after the threat of a hard Brexit dissipated (for the time being) and confidence increased in the likelihood the Conservative government would claim a majority in the Christmas general election.
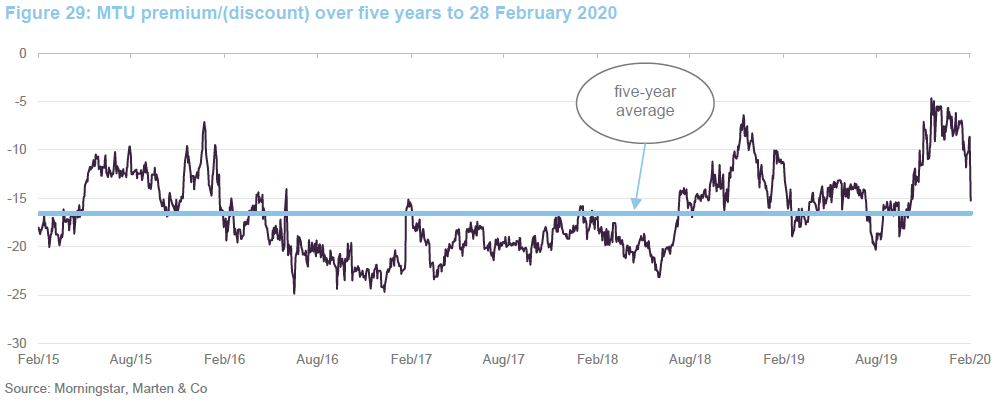
Charles does not believe that discounts are correlated to performance and buybacks have no lasting effect, whilst amendments to dividend policy and fee structures can impact the discount. The revision in MTU’s dividend policy, most notably in July 2018 (see the dividend section), provided one catalyst for the discount to narrow. Another catalyst was the five-for-one share split introduced around the same time – it helped to increase liquidity in the shares (see the capital structure and life section).
On buybacks, in which MTU has not engaged since 2009, the trust has taken the view that they should mainly be used to provide liquidity in the shares, which can be particularly beneficial for longstanding investors. An example used was the facilitation of Merchant Investors Ltd’s exit in 2000. The company may buy back shares when it considers it to be in shareholders’ best interests.
At the 2019 AGM, MTU took powers to repurchase up to 14.99% of its then-issued share capital. Shares repurchased may be held in treasury and reissued. Any shares reissued from treasury will be at a lower discount than when purchased and at a higher share price, thereby ensuring that the round trip is profitable for shareholders. If its pool of treasury shares were to be exhausted, MTU has also taken powers at the AGM to issue up to 5% of its then-issued share capital as new shares. Such shares would be issued at a premium to NAV.
MTU were an early adopter of treasury shares which is a good thing but they took the view that as long as the roundtrip made money for shareholders, it was ok to reissue at a discount – controversial in some quarters.
Fees and costs
As MTU’s investment manager and AIFM, MAML is entitled to receive a management fee of 0.50% of the trust’s gross assets (this was reduced from 0.85% with effect from 1 April 2017). Over the year to 31 March 2019, the manager received a monthly fee equivalent to 1/12 of 0.50% of MTU’s gross assets valued at the end of the last business day of each month.
There is no performance fee charged (one was last charged in 2012) and with respect to MTU’s allocation of the management fee, the capital/revenue account split is 75:25. The same breakdown is applied to the accounting treatment of interest accrued on MTU’s borrowings.
Except in certain circumstances, the management agreement may only be terminated by the manager on giving 12 months’ notice in writing to the MTU. MTU is entitled to terminate the agreement by notice in writing to the manager immediately, or at a specified date. In the event that the trust is the party terminating, the manager will be entitled to a termination fee of 1% of the gross assets of MTU at the end of business on the last day of the calendar month immediately preceding the effective date of termination of the contract.
The company’s ongoing charges ratio for the year ended 31 March 2019 was 0.80% – this compared with 0.78% the year before. This is calculated as the company’s annualised capital and revenue expenses (excluding finance costs and certain non-recurring line items) taken as a percentage of MTU’s average monthly net assets over the course of the accounting year.
Capital structure and life
MTU has 167,379,790 ordinary shares in issue and no other classes of share capital. The shares were subdivided in July 2018 on a five-for-one basis. The objective of this exercise was to increase the liquidity of the shares and make it easier to make relatively small investments into the trust (making it better suited to monthly savings plans and the like).
MTU’s passed its most recent continuation vote in 2017 with 97.4% support – the next one is expected in 2022.
MTU’s financial year ends on 31 March. It tends to announce annual results in June and hold its AGMs in July.
Gearing
Charles says that the first and fourth quarters often deliver the strongest returns, and has often used gearing to anticipate this market seasonality. This was especially evident over the fourth quarter of 2019, where gearing increased to around 12% – the very top end of MTU’s range. Going into the period, Charles’s conviction was that the trust was positioned for a strong end to the year, which he says was independent of the election outcome. He does not expect gearing to be as high going forward.
MTU has credit facilities totalling £30m with ING Bank NV, which were agreed in December 2016. This is made up of a five-year £20m fixed rate term loan and a five-year £10m floating rate revolving credit facility (RCF). As at 30 September 2019, £20m was utilised through the fixed rate term loan. Interest is payable at a fixed rate of 2.68% per annum in both the current and prior year.
The RCF had not been utilised as at 30 September 2019. When drawn down, interest is payable at LIBOR plus a margin of 1.65% per annum and mandatory costs.
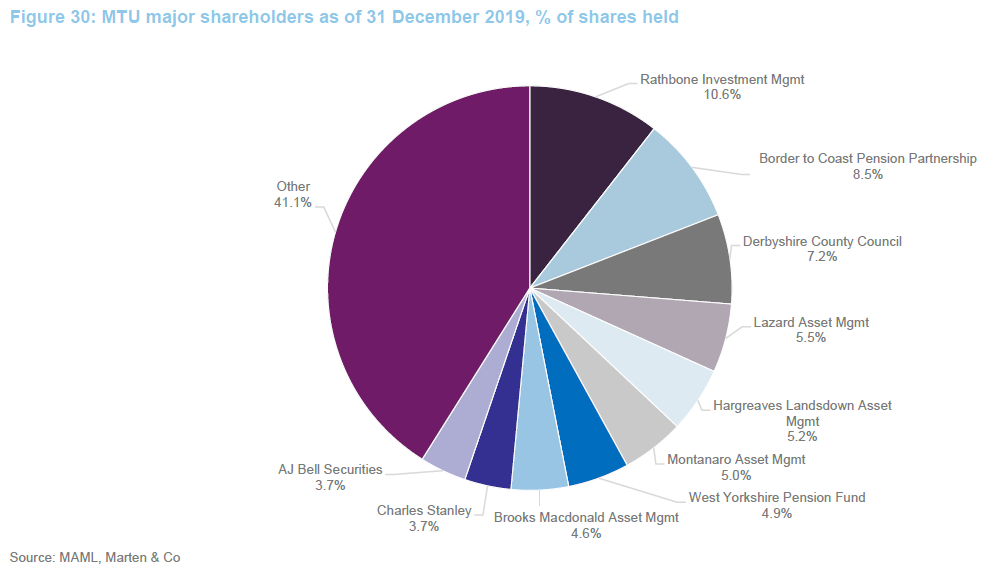
Major shareholders
Figure 30 shows MTU’s major shareholders, at 31 December 2019. Included here is the manager’s 8.7% stake, comprising Montanaro Asset Management’s 5% (Charles owns 100% of MAML) and a large proportion of AJ Bell’s 3.7% stake.
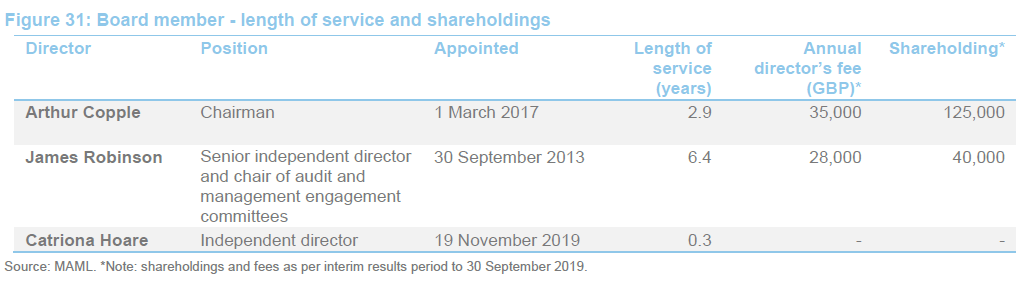
Board
MTU is managed with a tight board of just three non-executive directors. Arthur Copple, the chairman, was elevated to that position in July 2019 following the retirement of Roger Cuming. The trust believes a three-person board to be appropriate for its size, allowing it to keep costs down – ongoing charges have been falling. On 19 November 2019, MTU announced the appointment of Catriona Hoare as independent director. Catriona replaced Kate Bolsover, following her resignation after over five years of service. Kate’s resignation was effective the same day as Catriona’s appointment.
Arthur Copple (chairman)
Arthur Copple has specialised in the investment company sector for over 30 years. He was a partner at Kitcat & Aitken, an executive director of Smith New Court Plc, and a managing director of Merrill Lynch. He is also non-executive chairman of Temple Bar Investment Trust Plc and vice-chair of the University of Brighton Academies Trust.
James Robinson (senior independent director and chair of the audit and management engagement committees)
James Robinson recently replaced Kate Bolsover as senior independent director while retaining his role as chair of the audit and management engagement committees. James was chief investment officer (investment trusts) and director of hedge funds at Henderson Global Investors prior to his retirement in 2005. A chartered accountant, he has over 35 years’ investment experience and is a director of JP Morgan Elect Plc. He is also chairman of Polar Capital Global Healthcare Trust Plc, a governor of Lord Wandsworth College and a former chairman of the investment committee of the British Heart Foundation.
Catriona Hoare (independent director)
Catriona Hoare’s experience includes having been an investment partner at Veritas Investment Management in London since 2013. Before joining Veritas, Catriona held the position of fund manager at Newton Investment Management.
The legal bit
This marketing communication has been prepared for Montanaro UK Smaller Companies Trust by Marten & Co (which is authorised and regulated by the Financial Conduct Authority) and is non-independent research as defined under Article 36 of the Commission Delegated Regulation (EU) 2017/565 of 25 April 2016 supplementing the Markets in Financial Instruments Directive (MIFID). It is intended for use by investment professionals as defined in article 19 (5) of the Financial Services Act 2000 (Financial Promotion) Order 2005. Marten & Co is not authorised to give advice to retail clients and if you are not a professional investor, or in any other way are prohibited or restricted from receiving this information you should disregard it. The note does not have regard to the specific investment objectives, financial situation and needs of any specific person who may receive it.
The note has not been prepared in accordance with legal requirements designed to promote the independence of investment research and as such is considered to be a marketing communication. The analysts who prepared this note are not constrained from dealing ahead of it but, in practice and in accordance with our internal code of good conduct, will refrain from doing so. Nevertheless, they may have an interest in any of the securities mentioned in this note.
This note has been compiled from publicly available information. This note is not directed at any person in any jurisdiction where (by reason of that person’s nationality, residence or otherwise) the publication or availability of this note is prohibited.
Accuracy of Content: Whilst Marten & Co uses reasonable efforts to obtain information from sources which we believe to be reliable and to ensure that the information in this note is up to date and accurate, we make no representation or warranty that the information contained in this note is accurate, reliable or complete. The information contained in this note is provided by Marten & Co for personal use and information purposes generally. You are solely liable for any use you may make of this information. The information is inherently subject to change without notice and may become outdated. You, therefore, should verify any information obtained from this note before you use it.
No Advice: Nothing contained in this note constitutes or should be construed to constitute investment, legal, tax or other advice.
No Representation or Warranty: No representation, warranty or guarantee of any kind, express or implied is given by Marten & Co in respect of any information contained on this note.
Exclusion of Liability: To the fullest extent allowed by law, Marten & Co shall not be liable for any direct or indirect losses, damages, costs or expenses incurred or suffered by you arising out or in connection with the access to, use of or reliance on any information contained on this note. In no circumstance shall Marten & Co and its employees have any liability for consequential or special damages.
Governing Law and Jurisdiction: These terms and conditions and all matters connected with them, are governed by the laws of England and Wales and shall be subject to the exclusive jurisdiction of the English courts. If you access this note from outside the UK, you are responsible for ensuring compliance with any local laws relating to access.
No information contained in this note shall form the basis of, or be relied upon in connection with, any offer or commitment whatsoever in any jurisdiction.
Investment Performance Information: Please remember that past performance is not necessarily a guide to the future and that the value of shares and the income from them can go down as well as up. Exchange rates may also cause the value of underlying overseas investments to go down as well as up. Marten & Co may write on companies that use gearing in a number of forms that can increase volatility and, in some cases, to a complete loss of an investment.