
At the foothills of an AI mountain
Over the past 12 months, Polar Capital Technology (PCT) has posted stunning outperformance of its benchmark, with its NAV total return almost doubling that of the Dow Jones Global Tech Index. The results highlight the payoff from its maximalist strategy in AI. It has taken comparatively outsized positions in seemingly obscure names that it believes will benefit from bottlenecks in the AI infrastructure supply chain, and dumped others that it considers to be on the wrong side of the trade.
This has catapulted returns in recent months and seen it come away largely unscathed as markets baulked at US mega-cap stocks’ enlarged 2026 capex plans. As commentators argue over whether the sector is in a bubble, PCT’s manager is adamant that we are only at the foothills of AI’s ascent – as illustrated by the advancement in innovation (with Alphabet’s Gemini 3 the latest model launch) and the rapid growth in enterprise adoption (which is likely to gather pace with agentic AI).
Global growth from tech portfolio
PCT aims to maximise long-term capital growth through investing in a diversified portfolio of technology companies around the world, diversified across both regions and sectors within the overall investment objective to reduce investment risk.
| Year ended | Share price TR (%) | NAV total return (%) | DJ Global Tech TR (%) | MSCI ACWI TR (%) | MSCI UK TR (%) |
|---|---|---|---|---|---|
| 31/01/2022 | 1.9 | 5.8 | 16.3 | 16.0 | 22.7 |
| 31/01/2023 | (18.3) | (15.7) | (13.2) | 0.8 | 9.5 |
| 31/01/2024 | 42.1 | 38.4 | 40.6 | 11.7 | 2.2 |
| 31/01/2025 | 35.2 | 33.2 | 33.7 | 23.7 | 16.0 |
| 31/01/2026 | 36.9 | 34.2 | 18.3 | 11.3 | 23.9 |
Fund profile
More information can be found at the trust’s website: www.polarcapitaltechnologytrust.co.uk
PCT aims to maximise long-term capital growth through investing in a diversified portfolio of technology companies around the world, diversified across both regions and sectors. PCT launched as Henderson Technology Trust in December 1996 and, following a change of manager, became Polar Capital Technology Trust in April 2001.
Hear about the fund
Management arrangements
PCT’s AIFM is Polar Capital LLP and the lead manager assigned to the trust is Ben Rogoff, a partner in Polar Capital LLP. He is supported by a team of 11 technology specialists, including another partner, Nick Evans, and deputy fund manager Alastair Unwin. Polar believes that this is one of the best-resourced teams dedicated to this sector within Europe. In addition to PCT, the team also manages two open-ended funds, Polar Capital Global Technology Fund and the Artificial Intelligence Fund. Collectively, these funds had AUM of $19.5bn at 31 December 2025.
Ben joined the team from Aberdeen in 2003, having started his career in the years running up to the technology boom. The events surrounding the collapse of the tech bubble have influenced the way in which he manages money. One important lesson is that there is limited permanence in the technology sector; it is forever engaged in a process of creative disruption. Change in the sector is a non-linear process. Once-great companies can disappear and minnows can become giants.
Nick joined the team from Framlington in 2007. He complements Ben in that Nick has a more bottom-up approach to selecting stocks, whereas Ben has a bias to a top-down stance.
Market overview
Maximalist approach seen PCT prosper from AI supply chain bottlenecks
“Expect the pace of change in the AI world to be frenetic” has been the message from PCT’s manager Ben Rogoff and relayed in our notes on the company over the past few years. Being an AI “maximalist” means that Ben and his team think differently to other tech fund managers and look to get ahead of the pack in trades and themes. This was evident in the company’s growing exposure to power and networking companies from 2024 and hard disk drive and memory names in 2025. These play on the supply and demand imbalance and bottlenecks building up in the AI infrastructure rollout – and are a theme that the company believes has a lot further to run across multiple sectors.
Figure 1: Caterpillar
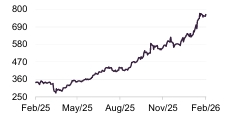
A recent example of PCT’s nimbleness and “maximalist” approach was its investment in construction equipment manufacturer Caterpillar – one of the least traditional tech names that it has ever owned. PCT took a starter position in Caterpillar in October 2025 as it became apparent that the company’s industrial generators would provide a solution to a lack of supply of turbines to power data centres. Caterpillar is also a key player in the copper industry, not as a direct miner, but as a leading manufacturer of surface and underground mining equipment used to extract copper (along with other metals like gold, lithium, and iron ore).
PCT’s manager says that the Caterpillar trade illustrates the bleeding edge of where it and the AI investment landscape is. It is the essence of what the manager describes as being “an active, active manager”. PCT’s investment process and large, experienced team means that it has everything in place for the requisite high-turnover portfolio.
Active, active
PCT’s manager contends that being an active manager is not enough when investing in AI. The sector is moving at such pace that it requires a large team that understands the eco-system, the threats and opportunities and has high conviction in their thinking. The surface area for AI disruption is increasing with new fields being drawn in, and requires a degree of risk-taking to seek out the new frontiers.
AI bull and bear cases are increasingly turning up, and an “active, active approach” will see stocks cut at the first indication of an AI bear case at the expense of once-obscure companies with a hint of an AI bull case. Both can move a stock into a different range – as was the case with Caterpillar where its valuation looked expensive on traditional metrics but, taking its copper and mining exposure into account, cheap against diversified industrials. For this reason, the manager expects turnover within PCT’s portfolio to remain as elevated as the market backdrop is fluid.
PCT’s recent trades have reflected the shift of AI capex from a “spreadsheet” thing to a “real-world” thing, raising the questions: “how is the infrastructure needed going to keep up with demand?”, “where are bottlenecks being created due to this supply-demand imbalance?”, and “how are solutions going to be found?”
Power remains number one infrastructure bottleneck
The number one bottleneck, and the hardest to overcome, according to the manager, remains powering data centres. Goldman Sachs forecasts that global power demand from data centres will increase 50% by 2027 and by as much as 165% by the end of the decade (compared with 2023). Question marks still linger over the ability to resolve the power squeeze, but PCT’s manager’s null hypothesis is that capitalism will find a way, including through imperfect solutions.
Optical networking, which links up remote data centres through fibre-optic cables, is one area that PCT’s manager is excited by. Ciena, a PCT holding, is an interesting case in point, having recently returned to the S&P 500 index after a 17-year absence. Its shares have almost tripled in the past year due to soaring demand from cloud providers. We detail Ciena and another optical networking holding, Lumentum (whose share price has risen 850% in the last year), on page 13.
Bubble fears grow on capex upgrades
Hyperscaler 2026 capex plans 60% up on 2025
Mega-cap US tech stocks sold off heavily at the beginning of February after a number of the leading names upgraded their capex plans for this year. Quarterly earnings updates put estimates on the proposed 2026 outlay on data centres and specialist chips from the top four hyperscalers (Alphabet, Amazon, Meta and Microsoft) at $660bn – a 60% rise on 2025 spend and a 165% increase from 2024.
Figure 2: Hyperscaler capex announcements ($bn)
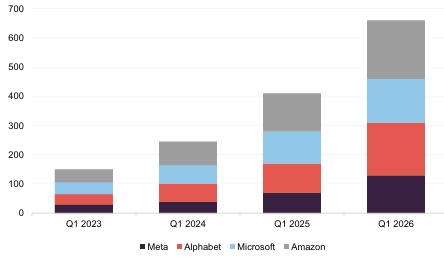
In quarterly earnings updates, Amazon announced that it plans to spend $200bn this year ($50bn more than expected), Alphabet between $175bn and $185bn (against expectations of $115bn), Meta between $115bn and $135bn (above the $110bn expected), and Microsoft around $150bn (based on quarterly capex of $37.5bn). All argue that the large sums were needed to position for a boom in AI.
Shares in US mega-cap stocks taken a hit
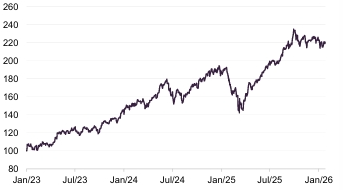
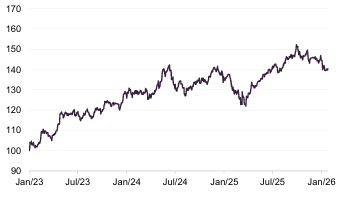
Investors baulked at the capex plans, however, with Microsoft down 19% since the turn of the year and the other three also down. This is illustrated in Figure 3, which shows the Dow Jones Global Technology Index losing momentum. Figure 4 suggests that investors have moved into other sectors at the expense of tech stocks.
Figure 3: Dow Jones Global Technology Index1
31 January 2023.
Figure 4: Dow Jones Global Technology index relative to MSCI ACWI1
31 January 2023.
This has overshadowed the reporting of large annual revenue uplifts from the mega-cap tech names. For example, Meta reported revenue growth of 24% year-on-year in the fourth quarter, Alphabet 18%, Microsoft 17%, and Amazon 12% (with Amazon Web Services up 24% year-on-year).
PCT’s manager states that data centre financing needs for 2026 can be funded from hyperscaler cashflows and investment grade bond markets, estimating that Alphabet, Amazon, Meta and Microsoft have $700bn of additional capacity based on 1x net debt to 2026 EBITDA and $1.45trn based on 2x. Looking further ahead, combined operating cashflows could reach $1.1trn by 2029 and should help cover future capex requirements, it adds.
Capex justified by enterprise adoption rates
The capex numbers reflect the extreme capacity constraints being felt across the sector, both currently, and more importantly, incorporating future expectations, according to PCT’s manager. Companies are alert to the potential for oversupply and will tread that line very carefully. Increased enterprise demand for AI has accelerated (and is expected to hasten further with the launch of upgraded Agentic AI models such as the recently released Claude Cowork from Anthropic) and wider adoption rates are continuing at pace, which the manager believes more than justifies the increased capex.
Here are just some examples of AI adoption among the different platforms:
- Weekly average users of OpenAI’s ChatGPT were 900m as of January 2026, up from 300m in mid-2025, while the company had more than 5 million paying business users in August 2025, up from 3 million in June 2025.
- Microsoft processed over 500 trillion tokens (units of data processed by AI models) served by Foundry APIs in 2025, up 7x year-on-year.
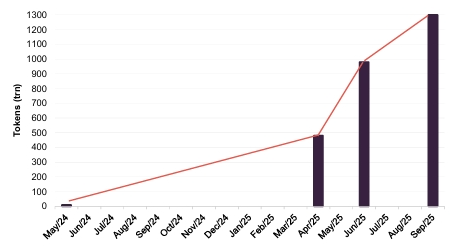
- Alphabet processed over 1.3 quadrillion tokens across its AI services in September 2025 (before the launch of Gemini 3, which Alphabet says consistently processes 3x as many daily tokens on average as its predecessor). This was up from a monthly run-rate of 980 trillion tokens in June 2025 and 480 trillion tokens in April 2025. Meanwhile, its Gemini app had more than 750 million monthly average users at the end of December 2025 versus 450 million in July 2025.
Figure 5: Progression of monthly tokens processed by Alphabet
OpenAI ARR increased to $20bn in December
Add to this impressive growth in annual recurring revenue (ARR) by OpenAI, which increased over 2025 from $6bn in January to more than $20bn in December, and Anthropic, which saw its ARR increase from $1.5bn at the start of the year to more than $7bn by October and market estimates of $9bn by the year end.
OpenAI reached $10bn ARR less than three years after the launch of ChatGPT, and Anthropic is on course to do the same in four years. This compares to eight years at Google and 10 years at Meta. OpenAI’s revenue projections have increased to $100bn in 2028, up from $86bn previously. Anthropic is projecting $40bn revenue in 2027 and $70bn in 2028.
PCT’s manager believes the launch of Claude Cowork in January will herald the take-off of adoption and demand for agentic AI (AI that goes beyond just responding to prompts and queries and moves on to designing and creating systems that can run autonomously to perform tasks and automate workflows) across most sectors, resulting in demand for inference tokens to grow meaningfully. This is driven by the potential for significant productivity gains and earnings growth, with Goldman Sachs estimating a 10% to 30% earnings per share boost from full AI adoption to most S&P 500 sectors.
The manager contends that some sectors need to be using AI to remain competitive. Coding is a good example, where around 30% to 40% of code is now written by AI. Call centres are another, where it is now generally accepted that half of inbound calls should be dealt with by AI. The manager expects use cases to continue to expand across sectors and industries.
Valuations in line with seven-year average
It is in this light that the debate around whether the market has entered a bubble should be viewed, the manager says. Although valuations are elevated, the manager views them as reasonable, with the S&P IT sector trading at around 26 times forward earnings, 1.2 times the wider S&P 500 index, and with NASDAQ trading at around 25 times – in line with its seven-year average. Most of the performance in recent years has been driven by strong fundamental growth rather than higher market valuations, it adds.
The manager also points out that, unlike previous booms, the IPO market has so far been subdued, although it expects this will change with both OpenAI and Anthropic rumoured to be mulling the prospect of an IPO – perhaps as early as this year.
Whilst macro uncertainty remains elevated and geopolitical tensions persist, with concerns mounting over the future independence of monetary policy in the US after President Trump announced Kevin Warsh as his nominee for the next Fed chair, PCT’s manager insists that it is unlikely to unsettle the AI growth story.
The US labour market cooled in 2025, which eased inflationary pressure with CPI in January below expectations at 2.4%. A further easing of monetary policy may follow in 2026, following the 25bps rate cut in December that lowered federal funds target range to 3.5% to 3.75% (the lowest level since 2022).
With the Fed cutting rates, earnings growing by double digits, and AI infrastructure only just breaking ground, PCT’s manager’s conviction that the AI bull market has a lot further to run is as strong as ever.
Investment process
PCT’s management team (profiled on page 16) carries out many hundreds of meetings a year, with both portfolio and prospective companies. The team uses surveys and speaks to domain experts to cross-reference what customers think of products, where appropriate.
Identify companies that can earn super-normal profits
The manager selects from a universe of more than 4,000 stocks and looks to construct a diversified portfolio with about 100 stocks in aggregate. These should represent the best opportunities within the investment themes that the manager has identified, and should come at the right price. The team looks at the value chain and identifies areas where it is possible to generate super-normal profits (where companies have an unfair advantage) and recurring revenue.
On average, the stocks that are selected for the portfolio should be capable of generating 30% to 50% higher growth than the average stock in the benchmark index and the manager is prepared to pay up for this growth – roughly 20% to 30% more than the benchmark, on average.
Valuation is a secondary consideration
There is little merit in first screening for value, in the manager’s opinion. It is better to think about which companies PCT should have exposure to, and only then about what is the price he is prepared to pay. The team is much more likely to screen for improving business fundamentals or stocks that it may have missed at the periphery of PCT’s investment universe that may not be perceived as tech stocks today, but might be in the future. An important part of this process is to think about the potential downside in a stock. For many of these stocks, missing an earnings forecast can be devastating to their rating.
PCT may miss out on the odd stock as a result, but the manager believes that this is an acceptable price to pay for avoiding the worst of the downside.
Sell discipline
The manager thinks that it is important to run your winners, but also to sell when an investment thesis did not play out as anticipated. Fair value is a moveable target and the potential upside and downside from any position needs to be reassessed regularly. The team has a bull, bear and base case for each stock, with a weighted probability to each of these scenarios.
Holdings will be trimmed as they approach the team’s target price. Sometimes Ben will hold onto a small position in a stock that he feels it is important to stay in touch with. The ability to have exposure to this type of opportunity is a benefit of PCT’s closed-end structure.
Portfolio construction
PCT aims to manage its risk relative to the benchmark
PCT is managed very much with an eye to risk. It is designed to deliver 3%+ annual outperformance versus its benchmark after fees on a consistent basis, with typical active share of 40–50%. It rarely makes outsized stock-level bets, preferring to add value by avoiding losers (often mature or blue-sky companies) and correctly identifying the most important secular themes (and allocating between them where value is perceived to be most compelling). This means that PCT ends up holding around 100 stocks. Whilst this means that other, less risk-aware funds may perform better over shorter periods, this risk-adjusted/diversified approach should allow PCT to outperform over the medium/longer timeframe.
From time to time, a handful of stocks can dominate the benchmark index. The board allows the manager to take a neutral position in any stock that accounts for more than 10% of the index (up to a maximum of 20% of the portfolio) but PCT cannot have an overweight exposure to these companies.
PCT is emphatically not a closet-tracking fund. If the manager does not like a company, PCT will have no exposure to it, regardless of its weight within the benchmark (see Figure 10).
Typically, the maximum exposure to a stock will be a 3.0%-3.5% active weighting. The portfolio’s active share has ranged from about 30% to just over 50% max.
Investment in emerging markets is permitted, but this is capped at 25% of gross assets. The board has also given the following indicative ranges for PCT’s asset allocation:
- North America up to 85%;
- Europe up to 40%;
- Japan and Asia up to 55%; and
- rest of the world up to 10%.
It has set specific upper exposure limits for certain countries where it believes there may be an elevated risk.
The remit allows investment in unquoted companies (subject to prior board approval and capped at 10% of gross assets) but in practice, this has not been used.
Asset allocation
At the end of January 2026, there were 98 stocks in PCT’s portfolio (compared to 97 six months ago). The portfolio’s active share is near recent highs at 49%, due to the manager’s larger individual stock bets. The manager is happy to have zero weightings in index names when he feels that their growth prospects do not merit their inclusion within the portfolio.
Cash and equivalents, which includes puts on the Nasdaq, were 5.0% of the portfolio at the end of January.
Figure 6: Geographic exposure at 31 Jan 2026
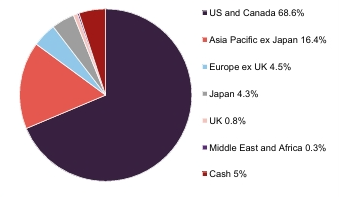
Figure 7: Sector exposure at 31 Jan 2026
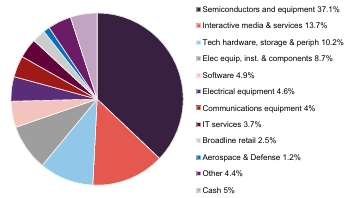
The manager does not try to add value through geographic asset allocation. However, PCT’s exposure to the US has fallen substantially over the past six to 12 months with exposure to Asia Pacific growing. In Figure 7, the most significant change has been the growth in exposure to hardware and storage at the expense of software, reflecting the manager’s belief that the AI cycle is fundamentally a hardware rather than a software cycle.
Top 10 holdings
There have been a couple of changes to the constituents of PCT’s top 10 holdings since our last note, with LAM Research and Samsung entering and Oracle and Cloudflare slipping out. Oracle had climbed into the top 10 after the manager built a position on the back of its industry-leading sovereign cloud business, but it has since exited its position entirely due to financing concerns. There have also been some large changes to position sizes, as shown in Figure 8.
Figure 8: Profile of top 10 holdings at 31 January 2026
| Company | Country | Mkt cap ($bn)1 | % of NAV 31/01/26 | % of NAV 31/07/25 | Change(%) |
|---|---|---|---|---|---|
| NVIDIA | US | 4,442 | 9.7 | 12.5 | (2.8) |
| Alphabet | US | 3,698 | 8.8 | 3.3 | 5.5 |
| Taiwan Semiconductor | Taiwan | 1,898 | 5.4 | 4.2 | 1.2 |
| Meta Platforms | US | 1,618 | 4.4 | 6.7 | (2.3) |
| Apple | US | 3,755 | 4.3 | 3.0 | 1.3 |
| Microsoft | US | 2,980 | 4.1 | 8.4 | (4.3) |
| Broadcom | US | 1,542 | 3.8 | 5.6 | (1.8) |
| Advanced Micro Devices | US | 338 | 2.9 | 2.7 | 0.2 |
| Samsung Electronics | South Korea | 701 | 2.8 | 0.0 | 2.8 |
| LAM Research | US | 294 | 2.7 | 0.4 | 2.3 |
| Total | 48.9 |
Figures 9 and 10 show PCT’s largest overweight and underweight exposures relative to the Dow Jones Global Technology Index at 31 December 2025.
Figure 9: 10 largest overweight exposures at 31 December 2025
| Company | Fund (%) | Index (%) | Active (%) |
|---|---|---|---|
| LAM Research | 2.32 | 0.69 | 1.63 |
| Ciena Corp | 1.57 | 0.11 | 1.46 |
| Lumentum Holdings | 1.50 | 0.08 | 1.41 |
| Siemens Energy | 1.33 | – | 1.33 |
| Advanced Micro Devices | 2.40 | 1.13 | 1.28 |
| KLA | 1.79 | 0.52 | 1.27 |
| Seagate Technology | 1.41 | 0.19 | 1.22 |
| Alibaba Group | 1.08 | – | 1.08 |
| Amazon | 1.08 | – | 1.08 |
| Taiwan Semiconductor | 4.89 | 3.84 | 1.05 |
Figure 10: 10 largest underweight exposures at 31 December 2025
| Company | Fund (%) | Index (%) | Active (%) |
|---|---|---|---|
| Apple | 3.48 | 12.97 | (9.50) |
| Microsoft | 5.53 | 11.61 | (6.08) |
| NVIDIA | 10.05 | 14.64 | (4.59) |
| Alphabet | 8.88 | 10.59 | (1.71) |
| ASML Holding | – | 1.36 | (1.36) |
| Meta Platforms | 3.44 | 4.64 | (1.21) |
| Oracle | – | 1.06 | (1.06) |
| Palantir Technologies | 0.34 | 1.31 | (0.97) |
| Salesforce.com | – | 0.81 | (0.81) |
| SAP | 0.09 | 0.81 | (0.71) |
We have discussed Ben’s views on many of PCT’s largest holdings and over- and underweight exposures in previous notes (links to which can be found on page 21). Some noteworthy portfolio developments since our last note include Alphabet, LAM Research, Ciena and Lumentum Holdings.
Alphabet
Figure 11: Alphabet
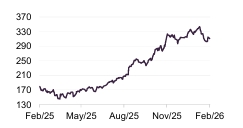
PCT’s long-standing underweight position in Alphabet – 171bps at the end of December, but which has been above 400bps in recent times – has dragged on relative performance in 2025, with the company’s share price rising 73.4% over the last 12 months. This was on the back of the success of the Gemini 3 model (which demonstrated significant improvements in reasoning, speed and multimodal capabilities) and the commercialisation of its custom-made TPUs (tensor processing units) chips at scale for the first time. It signed a major TPU deal with Anthropic in October and is rumoured to be in discussions with Meta about a potential multibillion-dollar deal.
PCT increased its exposure to Alphabet at the end of 2025 and a decent-sized equity call option somewhat shielded it from major relative underperformance. The call options had originally been put in place to hedge the outcome of the Department of Justice’s antitrust case against the company, which ultimately went in favour of Alphabet and paid off for PCT. The call options also gave a degree of protection on the TPU and Gemini share price reaction – but it has not fully participated in Alphabet’s performance relative to the benchmark.
PCT’s manager says recent developments have put Alphabet at the front of the AI race and taken some market share from NVIDIA (whose graphics processing units (GPUs) are largely depended on by other foundation model providers) and OpenAI (with the TPU-backed Anthropic making strong competitive gains). The race is by no means over, it adds. The first new AI models trained on NVIDIA Blackwell are expected from OpenAI, Meta and Grok in the first half of 2026.
PCT’s manager says that it may make use of cheap call options on other underweight mega-cap tech names in order to hedge the upside risk, having also used them in Microsoft and Apple.
LAM Research
Figure 12: LAM Research
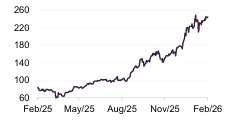
LAM Research was PCT’s largest overweight position at the end of 2025 at 163bps. The company, a leading global memory chip manufacturer for the semiconductor industry, has been a beneficiary of bottlenecks building up in the supply of memory chips needed in AI data centres. This has been particularly acute in DRAM (fast, short-term working memory for a device) and NAND (slower, long-term storage that keeps data even when the power is off), where the company specialises, and reflected in pricing. LAM’s share price has risen 193% over 12 months.
Ciena
Figure 13: Ciena
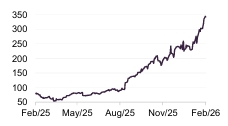
Optical networking leader Ciena is another overweight holding in PCT’s portfolio, at 146bps at the end of December. As mentioned earlier, the manager has placed a high conviction on optical networking as a solution to traditional electrical networking, as power-intensiveness increasingly becomes a greater potential threat to data centre viability. The company posted an acceleration in orders in the second half of last year, prompting it to raise its revenue guidance for this year to 24% from 17%, with $5bn of the $6bn revenue guide already in the backlog. It signed up its first hyperscaler customer as well as successes in its scale-across applications, which connects data centres over significant distances. Figure 13 shows that Ciena’s share price has rallied an astonishing 326% over the past 12 months.
Lumentum Holdings
Figure 14: Lumentum
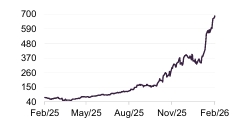
Fellow optical networking company Lumentum has witnessed an even more mesmeric share price performance over the past year, up 850%. At the end of December was PCT’s third-largest overweight position at 141bps. It grew revenue by 58% in 2025 and guidance was well above expectations, thanks to customer demand across its product portfolio. The company also has high exposure to Alphabet, so should benefit from that company’s recent momentum, and has other hyperscaler customers.
Performance
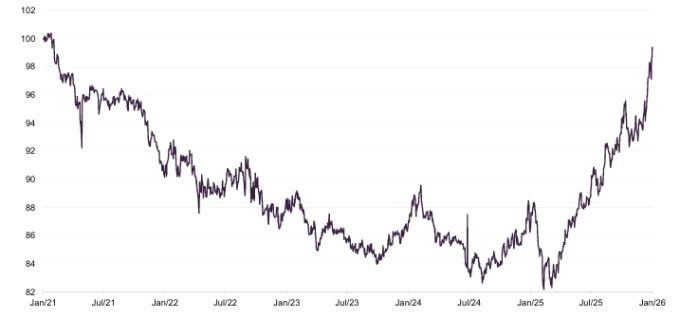
Figure 15: PCT NAV total return relative to benchmark over five years ending 31 January 2026
Visit QuotedData.com for up-to-date information on PCT and its peer group
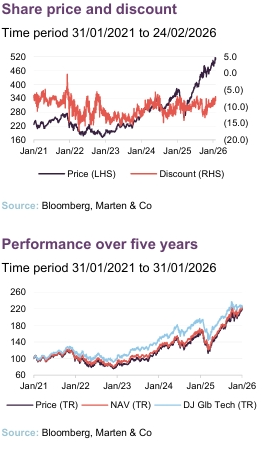
PCT’s substantial outperformance of its Dow Jones Global Technology benchmark over the past year has seen it regain almost all of the performance it had given up over the five-year period to the end of January 2026. Its AI maximalist approach and its scepticism around some names of the so-called Magnificent Seven are playing out.
Figure 16: Cumulative total return performance to 31 January 2026
| 1 month(%) | 3 months(%) | 6 months(%) | 1 year(%) | 3 years(%) | 5 years(%) | |
|---|---|---|---|---|---|---|
| PCT share price | 7.2 | 4.3 | 23.6 | 36.9 | 163.0 | 118.9 |
| PCT NAV | 4.6 | (0.6) | 21.3 | 34.2 | 147.4 | 120.7 |
| Benchmark | (0.2) | (4.5) | 11.5 | 18.3 | 122.5 | 124.7 |
| MSCI ACWI | 0.7 | (0.3) | 9.1 | 11.3 | 53.8 | 79.8 |
| MSCI UK | 3.0 | 6.0 | 13.9 | 23.9 | 46.8 | 97.2 |
Dividend
PCT historically has not paid dividends, given the nature of its focus on longer-term capital growth. The board reviews this stance on a periodic basis and would declare a dividend if this was needed to maintain the company’s status as an investment trust. Over the years, PCT’s running expenses have exceeded its revenue and therefore the revenue reserve remains negative. To pay a dividend, PCT would need to eliminate its revenue reserve deficit (£158.4m at 31 October 2025).
Premium/discount
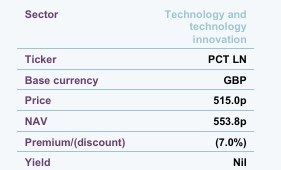
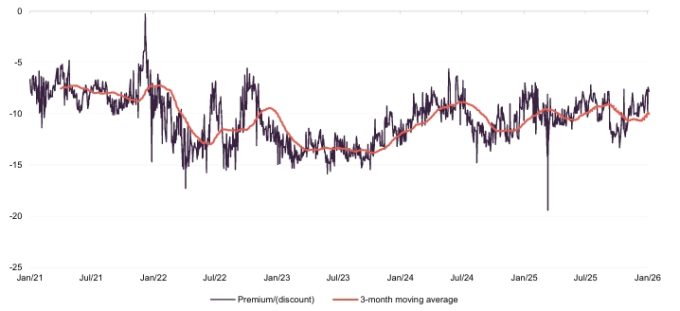
Over the 12 months to 31 January 2026, PCT traded between a discount of 7.0% and 19.4%. The average discount over this period was 9.9%. At 24 February 2026, PCT’s shares were trading at a discount of 7.0%. Given the manager’s proven ability to identify AI winners in the AI supply chain, and its “active, active investment approach”, this still feels too wide.
Figure 17: Premium/(discount) over five years to end January 2026
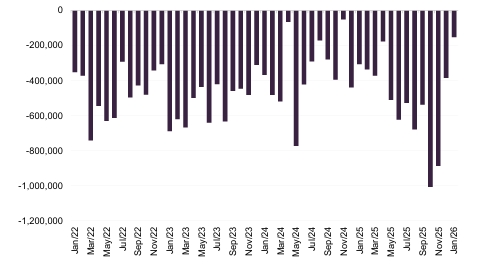
PCT issues and repurchases shares with the aim of ensuring that its shares do not trade at excessive premiums or discounts. Shareholders are asked at each AGM to approve the issuance of up to 10% of PCT’s issued share capital and the repurchase of up to 14.99% of its issued share capital. Shares are only issued at a premium to NAV. Shares repurchased may be held in treasury and reissued.
Figure 18: PCT share repurchases since 31 December 2021
Fees and costs
New management fee arrangements came into effect on 1 May 2025. The tiered fee payable is now 0.75% on the first £2bn of NAV and 0.6% on amounts above £2bn. There is no performance fee.
The ongoing charges ratio is 0.77%.
Capital structure
PCT has 1,116,103,155 ordinary shares in issue and admitted to trading plus a further 257,046,845 shares held in treasury, as at 24 February 2026. There are no other classes of share capital.
PCT’s financial year end is 30 April and AGMs are usually held in September. PCT has an unlimited life, but at the 2025 AGM, shareholders were asked whether they want the fund to continue. Shareholders backed the proposal overwhelmingly (98.6% of those voting). The same question will be put to shareholders in 2030 and every five years thereafter.
The use of gearing and derivative instruments is permitted and overseen by the board.
Derivative instruments such as financial futures, options, contracts-for-difference and currency hedges would be used for the purpose of efficient portfolio management. Any leverage resulting from the use of such derivatives will be subject to the restrictions on borrowings. PCT has no long-term borrowings and, at present, no short-term borrowings either.
Management team
Ben Rogoff
Ben is the lead manager of Polar Capital Technology Trust and is a fund manager of the Polar Capital Global Technology Fund and Polar Capital Automation and Artificial Intelligence Fund.
Ben has been a technology specialist for 25 years. Prior to joining Polar Capital, he began his career in fund management at CMI, as a global technology analyst. He moved to Aberdeen Fund Managers in 1998, where he spent four years as a senior technology manager. Ben graduated from St Catherine’s College, Oxford in 1995.
Alastair Unwin
Alastair is the deputy manager, having joined Polar Capital in 2019 as a fund manager and senior analyst. Before joining Polar Capital, he co-managed the Arbrook American Equities Fund. Between 2014 and 2018, Alastair launched and then managed the Neptune Global Technology Fund, and managed the Neptune US Opportunities Fund. Prior to Neptune, he was a technology analyst at Herald Investment Management. Alastair has a BA (1st Class Hons) in history from Trinity College, Cambridge and is a CFA Charterholder.
Nick Evans
Nick Evans joined Polar Capital in 2007. He has 23 years’ experience as a technology specialist and has been lead manager of the Polar Capital Global Technology Fund since January 2008. He is also a fund manager on the Polar Capital Technology Trust and Polar Capital Automation and Artificial Intelligence Fund.
Prior to joining Polar, Nick was head of technology at AXA Framlington and lead manager of the AXA Framlington Global Technology Fund and the AXA World Fund (AWF) – Global Technology from 2001 to 2007 (both rated five stars by S&P). He also spent three years as a Pan-European investment manager and technology analyst at Hill Samuel Asset Management. Nick has a degree in Economics and Business Economics from Hull University, has completed all levels of the ASIP, and is a member of the CFA Institute.
Xuesong Zhao
Xuesong joined Polar Capital in 2012. He has 14 years’ investment experience and is a lead manager of the Polar Capital Artificial Intelligence Fund. He is a partner fund manager on the Polar Capital Technology Trust and Polar Capital Global Technology Fund.
Prior to joining Polar Capital, Xuesong spent four years working as an investment analyst within the emerging markets & Asia team at Aviva Investors, where he was responsible for the technology, media and telecom sectors. Previously, he worked as a quantitative analyst and risk manager for the emerging market debt team at Pictet Asset Management and started his career as a financial engineer at Algorithmics, now owned by IBM, in 2005. Xuesong holds an MSc in Finance from Imperial College of Science & Technology and a BA in Economics from Peking University, and is a CFA Charterholder.
Fatima Iu
Fatima joined Polar Capital in 2006. She has 15 years’ investment experience and is a fund manager on the Polar Capital Technology Fund, Polar Capital Technology Trust and Polar Capital Automation and Artificial Intelligence Fund. Fatima is responsible for the coverage of European Technology, Global Security, Networking, Clean Energy and Medical Technology.
Prior to joining Polar, Fatima spent 18 months working at Citigroup Asset Management with a focus on consumer products and pharmaceuticals. She holds an MSc in Chemistry with Medicinal Chemistry from Imperial College of Science & Technology in London. Fatima is also a CFA Charterholder.
Paul Johnson
Paul joined Polar Capital in 2012. Prior to this, he helped manage a private investment fund between 2010 and 2012. Paul holds a BA in History and Politics and a Masters in History from Keele University. He has successfully passed all three levels of the CFA programme.
Nick Dumas-Williams
Nick joined Polar Capital in 2019 as an analyst on the Polar Capital Technology team. Prior to joining Polar Capital, he worked at Neptune Investment Management as the assistant fund manager on its US Opportunities growth fund. Previously, he worked in academia at the University of Oxford. Nick holds an MChem in Chemistry from the University of Oxford.
Patrick Stuff
After graduating in 2016 from the University of Warwick with a BSc in Economics, Patrick joined Polar Capital as an operations executive, where he provided operational support to all fund management teams at Polar, including the technology team. During this period, he successfully passed all three levels of the CFA program first time and subsequently, after a successful eight months seconded to the technology team, joined on a full-time basis in May 2021 as an investment analyst with a focus on small- and mid-cap companies.
Fred Holt
Fred joined Polar Capital in 2023 as an investment analyst in the technology team. Prior to joining Polar Capital, he worked at Janus Henderson Investors as a portfolio analyst on the global technology leaders and sustainable future technologies strategies.
Lina Ghayor
Lina joined Polar Capital in 2023 as an investment analyst in the technology team. Prior to joining Polar Capital, she worked at Exane BNP Paribas as an equity research analyst.
Paddy Drewett
Paddy joined Polar Capital as an operations executive in 2019 from the global markets division of Société Générale. He transferred to the technology team as a data analyst in June 2024 and provides expertise on AI implementation while bolstering the wider data analysis capabilities of the team. Paddy is a CFA Charterholder.
Adam Gildea
Adam joined Polar Capital in January 2026 as an analyst from Bank of America, where he was an equity research analyst on the European consumer discretionary team. Prior to that he worked in baseball operations and analytics for the Philadelphia Phillies and Los Angeles Dodgers.
Board
PCT’s board comprises six non-executive directors, all of whom are independent of the manager and who do not sit together on other boards. Each of the directors stands for re-election at each AGM. Three members of the board are approaching nine years of service. A programme of recruitment, appointment, and retirement is due to be carried out in 2026 and concluded by the end of 2027.
Figure 19: Board member – length of service and shareholdings
| Director | Position | Date of appointment | Length of service (years) | Annual director’s fee (GBP) | Shareholding |
|---|---|---|---|---|---|
| Catherine Cripps | Chair | September 2021 | 4.3 | 67,200 | 4,810 |
| Tim Cruttenden | Senior independent director | March 2017 | 8.8 | 41,200 | 12,690 |
| Jane Pearce | Chair of the audit committee | September 2021 | 4.3 | 46,000 | 10,970 |
| Charles Park | Director | January 2018 | 8.0 | 37,000 | 18,400 |
| Stephen White | Director | January 2018 | 8.0 | 37,000 | 100,000 |
| Adiba Ighodaro | Director | December 2024 | 1.1 | 37,000 | 2,448 |
Catherine Cripps
Catherine was appointed to the board in September 2021 and took over as chairman in September 2022. She is a qualified Chartered Accountant with more than 30 years’ senior investment industry experience in a number of trading, risk management and investing roles including investment director and head of research at GAM. Catherine is also a non-executive director of Goldman Sachs International and Goldman Sachs International Bank, where she is chair of the risk committees and a member of the audit committees. She is also a non-executive director of the National Wealth Fund and was previously non-executive director of CQS Management Limited, where she chaired the remuneration and performance management committees and was a member of the audit committee.
Tim Cruttenden
Tim is currently chief executive officer of VenCap International Plc, having been with that company in various positions since 1994. VenCap invests in venture capital funds in the US, Asia and Europe, with a primary focus on early-stage technology companies. Tim is a non-executive director of Chrysalis Investments Limited.
Jane Pearce
Jane is an experienced non-executive director and Chartered Accountant with over 20 years’ financial markets experience. She is experienced as a technology equity analyst and as an equity strategist at leading investment banks including Lehman Brothers and Nomura International.
Jane is a non-executive director and member of the audit committee of Shires Income Plc and also a non-executive director of Morgan Stanley Bank International Limited, Morgan Stanley & Co International Plc, and Morgan Stanley Investment Management Limited.
Charles Park
Charles has over 25 years of specialist investment experience and was a co-founder of Findlay Park Partners, an investment firm specialising in quoted American equity investments. Prior to this, he was a US fund manager at Hill Samuel Asset Management.
Charles is a non-executive director of North American Income Trust Plc and Evenlode Investments.
Stephen White
Stephen qualified as a Chartered Accountant at PwC before starting a career in investment management. He has more than 35 years’ investment experience, most notably as head of European Equities at F&C Asset Management, where he was manager of F&C Eurotrust Plc and deputy manager of The F&C Investment Trust Plc. He also held the role of head of European and US Equities at British Steel Pension Fund.
Stephen is a non-executive director and chairman of Brown Advisory US Smaller Companies Trust Plc. He is also non-executive director and chairman of the audit committees of BlackRock Frontiers Investment Trust Plc
Adiba Ighodaro
Adiba is an experienced non-executive director with a background in corporate and commercial law. She has extensive experience in global private markets from over 30 years of working in legal structuring, development finance, private equity investment, and fundraising.
Adiba is currently an independent non-executive director and member of the audit and management engagement committees of ICG Enterprise Trust Plc, and an independent non-executive director, chair of the credit committee and member of the risk committee and the nomination, governance & remuneration committee of Standard Chartered Bank Nigeria Ltd. She is also a non-executive director of M-Kopa Holdings Ltd.
SWOT and bull versus bear analysis
Figure 20: SWOT analysis for PCT
| Strengths | Weaknesses |
|---|---|
| Great long-term track record of NAV and share price growth | Exposed to high market volatility |
| One of largest tech teams in Europe, with strong track record in investing in AI | |
| Opportunities | Threats |
| If only at the beginning of AI bull story, potential for exponential growth to come | Stock valuations plummet on investor nerves around an AI bubble |
| Many more sectors to be encompassed by AI | US economic and foreign policy hits global share prices |
| New Chinese AI models launch, taking away market share from US companies |
Figure 21: Bull versus bear case for PCT
| Aspect | Bull case | Bear case |
|---|---|---|
| Performance | Great long- and short-term | Underweight Mag7 stock outperform |
| Dividends | N/A | N/A |
| Outlook | Only at the foothills of a transformative new technology | Tech valuations have got ahead of themselves |
| Discount | Manager’s skillset in picking AI winners and avoiding losers is recognised and trust’s discount narrows | Market anxiety over AI bubble weighs on discount |
Previous publications
Readers interested in further information about PCT may wish to read our earlier notes. You can read them by clicking on the links below or by visiting our website.
Figure 22: QuotedData’s previously published notes on PCT
| Title | Note type | Publication date |
|---|---|---|
| Confidence building | Initiation | 12 May 2020 |
| More to go for | Update | 15 December 2020 |
| Exciting times | Annual overview | 7 July 2021 |
| Eyes on the prize | Update | 10 May 2022 |
| Jockeying for position | Annual overview | 8 December 2022 |
| Me, myself and AI | Update | 14 June 2023 |
| The AI’s have it | Annual overview | 9 January 2024 |
| AI caramba! | Update | 25 June 2024 |
| AI captain | Annual overview | 16 January 2025 |
| AI of the tiger | Update | 14 August 2025 |
Important Information
This marketing communication has been prepared for Polar Capital Technology Trust Plc by Marten & Co (which is authorised and regulated by the Financial Conduct Authority) and is non-independent research as defined under Article 36 of the Commission Delegated Regulation (EU) 2017/565 of 25 April 2016 supplementing the Markets in Financial Instruments Directive (MIFID). It is intended for use by investment professionals as defined in article 19 (5) of the Financial Services Act 2000 (Financial Promotion) Order 2005. Marten & Co is not authorised to give advice to retail clients and, if you are not a professional investor, or in any other way are prohibited or restricted from receiving this information, you should disregard it. The note does not have regard to the specific investment objectives, financial situation and needs of any specific person who may receive it.
The note has not been prepared in accordance with legal requirements designed to promote the independence of investment research and as such is considered to be a marketing communication. The analysts who prepared this note are not constrained from dealing ahead of it, but in practice, and in accordance with our internal code of good conduct, will refrain from doing so for the period from which they first obtained the information necessary to prepare the note until one month after the note’s publication. Nevertheless, they may have an interest in any of the securities mentioned within this note.
This note has been compiled from publicly available information. This note is not directed at any person in any jurisdiction where (by reason of that person’s nationality, residence or otherwise) the publication or availability of this note is prohibited.
Accuracy of Content: Whilst Marten & Co uses reasonable efforts to obtain information from sources which we believe to be reliable and to ensure that the information in this note is up to date and accurate, we make no representation or warranty that the information contained in this note is accurate, reliable or complete. The information contained in this note is provided by Marten & Co for personal use and information purposes generally. You are solely liable for any use you may make of this information. The information is inherently subject to change without notice and may become outdated. You, therefore, should verify any information obtained from this note before you use it.
No Representation or Warranty: No representation, warranty or guarantee of any kind, express or implied is given by Marten & Co in respect of any information contained on this note.
Exclusion of Liability: To the fullest extent allowed by law, Marten & Co shall not be liable for any direct or indirect losses, damages, costs or expenses incurred or suffered by you arising out or in connection with the access to, use of or reliance on any information contained on this note. In no circumstance shall Marten & Co and its employees have any liability for consequential or special damages.
Governing Law and Jurisdiction: These terms and conditions and all matters connected with them, are governed by the laws of England and Wales and shall be subject to the exclusive jurisdiction of the English courts. If you access this note from outside the UK, you are responsible for ensuring compliance with any local laws relating to access.
No information contained in this note shall form the basis of, or be relied upon in connection with, any offer or commitment whatsoever in any jurisdiction.
Investment Performance Information: Please remember that past performance is not necessarily a guide to the future and that the value of shares and the income from them can go down as well as up. Exchange rates may also cause the value of underlying overseas investments to go down as well as up. Marten & Co may write on companies that use gearing in a number of forms that can increase volatility and, in some cases, to a complete loss of an investment.