June
Monthly | Investment companies
Winners and losers in May 2025
A number of sectors made good progress over May as markets continued their recovery from April’s tariff-related sell-off. Leading the charge in May was the Financials & Financial Innovation sector, where Augmentum Fintech’s discount narrowed from an overly wide level.
Technology & Technology Innovation was not far behind, underpinned by a resurgence in investor appetite for AI, semiconductors, and platform technologies. Late May strength in the Nasdaq, driven by Nvidia and Microsoft, filtered through to tech-heavy trusts like Polar Capital Technology and Manchester & London, which lean heavily into AI leaders.
Best performing sectors in May 2025 by total price return
| Median share price total return (%) |
Median NAV total return (%) |
Median discount 31/05/25 (%) |
Median sector market cap 31/05/25 (£m) | Number of companies in the sector | |
|---|---|---|---|---|---|
| Financials & Financial Innovation | 14.5 | 2.7 | (21.5) | 362.1 | 2 |
| Technology & Technology Innovation | 11.5 | 11.7 | (10.7) | 2,353.9 | 2 |
| Infrastructure Securities | 9.2 | 5.4 | (10.4) | 113.5 | 2 |
| Country Specialist | 9.1 | 6.7 | (15.3) | 314.4 | 4 |
| UK All Companies | 8.9 | 7.4 | (9.5) | 285.2 | 5 |
That resurgence in the AI story benefitted power producers too (AI consumes a lot of power). The two infrastructure securities trusts outperformed benchmarks over May as they recovered somewhat from the DeepSeek-related sell-off earlier in the year.
The Country Specialist sector saw a recovery likely driven by markets such as South Korea, where structural reforms to improve shareholder returns have reignited foreign investor interest. Vietnam’s market bounced too, perhaps as Trump-family projects in the country raise the prospect of a more lenient tariff regime.
Meanwhile, UK All Companies posted healthy returns, showing a rebound in domestic equities, particularly in value-oriented and cyclically sensitive stocks. The FTSE 250, which has lagged global indices over the past year, appears to be catching up as economic data hints at a shallow landing rather than recession. Trusts exposed to smaller companies have been among the beneficiaries.
Looking at the fallers, the Biotechnology & Healthcare sector continues to face headwinds. An executive order from Trump on drug pricing unveiled on 12 May was unhelpful. There has also been a slowdown in M&A, likely related to heightened economic uncertainty. Sentiment towards long-duration, cash-burning biotech firms remains tepid. Syncona and Biotech Growth Trust have the highest exposure to these types of companies. They both saw significant drawdowns, reflecting investor concern around pipeline delays and funding runway.
All four of the other worst-performing sectors invest in property. The Property – Rest of World sector remains deeply out of favour, with the widest average discount. This is indicative of illiquidity and widespread uncertainty around the valuation of international assets. Country specific political uncertainties are also a contributing factor, with the deterioration of the already poor Cuba and US relationship affecting Ceiba Investments’ returns, for example.
Of the others, the share price falls were negligible, with Property – UK Commercial actually eking out a small share price gain.
Worst performing sectors in May 2025 by total price return
| Median share price total return (%) |
Median NAV total return (%) |
Median discount 31/05/25 (%) |
Median sector market cap 31/05/25 (£m) | Number of companies in the sector | |
|---|---|---|---|---|---|
| Biotechnology & Healthcare | (3.5) | (2.3) | (8.6) | 294.2 | 8 |
| Property – Rest of World | (2.0) | (0.5) | (69.3) | 15.1 | 3 |
| Property – UK Residential | (1.0) | 0.8 | (37.4) | 194.3 | 6 |
| Property – Europe | (0.4) | (0.5) | (32.1) | 196.8 | 4 |
| Property – UK Commercial | 0.6 | 1.5 | (17.4) | 157.1 | 10 |
Best performing investment companies
Manchester & London enjoyed a strong month across both NAV and share price returns, helped by its highly concentrated tech exposure which aligned well with the late May rally in US large cap stocks. Polar Capital Technology and Allianz Technology also benefitted from this upswing. On the share price side, Seraphim Space led the way as a result of a growing recognition of the strategic value of space-tech assets in a defence focused world, with investors responding to both external geopolitical catalysts and internal updates around funding strength and operational traction across the portfolio.
Best performing trusts in total NAV (LHS) and share price (RHS) terms over May 2025
| Fund | Sector | (%) | Fund | Sector | (%) |
|---|---|---|---|---|---|
| Manchester & London | Global | 19.5 | Seraphim Space Investment Trust | Growth Capital | 41.7 |
| Polar Capital Technology | Technology & Technology Innovation | 12.7 | HydrogenOne Capital Growth | Renewable Energy Infrastructure | 31.5 |
| Aberforth Geared Value & Income | UK Smaller Companies | 12.0 | VH Global Energy Infrastructure | Renewable Energy Infrastructure | 26.2 |
| Weiss Korea Opportunity | Country Specialist | 11.8 | Manchester & London | Global | 23.6 |
| Geiger Counter | Commodities & Natural Resources | 11.8 | Augmentum Fintech | Financials & Financial Innovation | 22.8 |
| Onward Opportunities | UK Smaller Companies | 11.7 | Schiehallion Fund | Growth Capital | 17.6 |
| Pershing Square Holdings | North America | 11.3 | Aquila Energy Efficiency Trust | Renewable Energy Infrastructure | 17.3 |
| Odyssean Investment Trust | UK Smaller Companies | 11.2 | US Solar Fund | Renewable Energy Infrastructure | 16.7 |
| Rights & Issues Investment Trust | UK Smaller Companies | 10.8 | Geiger Counter | Commodities & Natural Resources | 16.3 |
| Allianz Technology | Technology & Technology Innovation | 10.8 | Aberforth Geared Value & Income | UK Smaller Companies | 16.0 |
As investors’ appetite for risk has improved since April, HydrogenOne Capital Growth’s discount has been narrowing but it remains very wide – it was a similar story for US Solar Fund, although not quite so dramatic. Elsewhere in the renewables sector, VH Global Energy Infrastructure announced plans to pursue an asset realisation strategy and Aquila Energy Efficiency’s discount narrowed as its shareholders received a distribution in connection with its managed winddown.
There was no news of note from Augmentum Fintech, but its discount narrowed as investors’ confidence improved. The Korean market continued to recover from the tariff-related shock of April, benefitting Weiss Korea Opportunity. An election was underway over May that ultimately saw a victory by opposition leader Lee Jae Myung. Geiger Counter will have ridden on the coattails of an improving uranium price, but that has a long way to go to recover last-year’s highs. UK smaller companies funds registered impressive rebounds, including Odyssean, Aberforth Geared Value & Income, Onward Opportunities, and Rights and Issues. This suggests growing confidence in a domestic small-cap recovery. Meanwhile, Pershing Square’s NAV uplift reflects continued strength in its concentrated US portfolio. It concluded its deal with Howard Hughes Holdings during the month. Schiehallion’s share price bounce marks tentative reengagement with growth private equity strategies following major dips in recent months.
Worst performing investment companies
In terms of the worst performers, Livermore Investments is a thinly-traded and volatile stock and regularly features in these tables. The same is true of JPMorgan Emerging EMEA. It announced another delay to the Russian court case it is involved in.
Worst performing trusts in total NAV (LHS) and share price (RHS) terms over May 2025
| Fund | Sector | (%) | Fund | Sector | (%) |
|---|---|---|---|---|---|
| International Biotechnology | Biotechnology & Healthcare | (9.7) | Livermore Investments | Flexible Investment | (15.5) |
| Fidelity Asian Values | Asia Pacific Smaller Companies | (6.0) | JPMorgan Emerg EMEA Sec Plc | Global Emerging Markets | (14.7) |
| Biotech Growth | Biotechnology & Healthcare | (4.5) | Syncona | Biotechnology & Healthcare | (11.6) |
| abrdn European Logistics Income PLC | Property – Europe | (4.2) | abrdn Property Income Trust | Property – UK Commercial | (10.4) |
| NB Distressed Debt Inv Extended Life | Debt – Loans & Bonds | (3.6) | Majedie Investments | Flexible Investment | (9.0) |
| Fidelity China Special | China / Greater China | (2.9) | LMS Capital | Private Equity | (9.0) |
| Worldwide Healthcare | Biotechnology & Healthcare | (2.7) | International Biotechnology | Biotechnology & Healthcare | (8.6) |
| UIL | Flexible Investment | (2.3) | Third Point Investors USD | Hedge Funds | (7.6) |
| Polar Capital Glb Healthcare | Biotechnology & Healthcare | (2.3) | Warehouse REIT | Property – UK Logistics | (6.9) |
| Nippon Active Value | Japanese Smaller Companies | (1.2) | SDCL Efficiency Income | Renewable energy infrastructure | (6.3) |
Biotech and healthcare names were weak for the reasons highlighted above, most notably Trump’s executive order on pricing. International Biotechnology’s position in Cytokinetics was affected by an FDA delay to a new drug approval.
Indian mid-caps and China A shares sold off over May, knocking Fidelity Asian Values and Fidelity China.
abrdn Property Income has just one asset left – its forestry estate in the Cairngorms, it may be that investors are frustrated by a lack of progress in its sale.
Third Point Investors announced the result of its strategy review. Its decision to become an insurance company did not go down well with some shareholders, notably AVI, which bemoaned the lack of an exit opportunity at NAV given such a radical change of direction.
Warehouse REIT fell as Blackstone reopened negotiations on its takeover price, disputing the valuations of some assets.
SDCL Efficiency Income’s discount widened, possibly because it has more exposure to the US (and so Trump’s anti-environment policies) than many peers.
Moves in discounts and premiums
More expensive (LHS) and cheaper (RHS) relative to NAV over May 2025
| Fund | Sector | Disc/ Prem 30/04/25 (%) |
Disc/ Prem 31/05/25 (%) |
Fund | Sector | Disc/ Prem 30/04/25 (%) |
Disc/ Prem 31/05/25 (%) |
|---|---|---|---|---|---|---|---|
| Seraphim Space Investment Trust | Growth Capital | (48.7) | (27.4) | JPMorgan Emerg EMEA Sec Plc | Global Emerging Markets | 390.8 | 314.3 |
| VH Global Energy Infrastructure | Renewable Energy Infrastructure | (48.5) | (35.3) | Livermore Investments | Flexible Investment | (12.4) | (26.2) |
| Augmentum Fintech | Financials & Financial Innovation | (50.9) | (39.7) | abrdn Property Income Trust | Property – UK Commercial | (13.8) | (27.5) |
| Schiehallion Fund | Growth Capital | (31.1) | (20.9) | Majedie Investments | Flexible Investment | 0.6 | (10.7) |
| Life Settlement Assets | Insurance & reinsurance | (26.6) | (16.6) | Third Point Investors | Hedge funds | (17.3) | (25.3) |
Seraphim Space’s discount narrowing discount was driven by renewed interest in defence-linked tech amid rising geopolitical tensions. VH Global Energy Infrastructure’s decision to adopt a managed wind down policy helped narrow its discount. Augmentum Fintech rebounded as confidence in later stage fintech improved, Schiehallion Fund gained ground as investors reengaged with less mature private equity assets.
JPMorgan Emerging EMEA may have been knocked by the lack of progress in Russia/Ukraine peace talks as well as the ongoing court case. Majedie Investments returned to trading on a discount after a brief period of trading on a premium. That might reflect a shift in investors’ attention from defensively positioned trusts to those offering greater risk/reward. Third Point Investors’ strategic review outcome failed to inspire confidence.
Money raised and returned
Money raised (LHS) and returned (RHS) over May 2025 in £m
| Fund | Sector | £m raised | Fund | Sector | £m returned |
|---|---|---|---|---|---|
| Invesco Bond Income Plus | Debt – Loans & Bonds | 7.5 | The European Smaller Companies Trust PLC | European Smaller Companies | (225.0) |
| CQS New City High Yield | Debt – Loans & Bonds | 6.6 | Scottish Mortgage | Global | (84.1) |
| M&G Credit Income Investment | Debt – Loans & Bonds | 5.6 | JPMorgan European Discovery | European Smaller Companies | (50.7) |
| Law Debenture Corporation | UK Equity Income | 4.4 | Smithson Investment Trust | Global Smaller Companies | (34.0) |
| JPMorgan Global Growth & Income | Global Equity Income | 4.1 | Bellevue Healthcare | Biotechnology & Healthcare | (30.5) |
Capital raising in May was modest and narrowly concentrated in income focused trusts, particularly those in the Debt – Loans and Bonds sector benefitting from higher interest rates. These inflows suggest that investor attention is still skewed toward dependable yield, especially in light of central banks signalling peak interest rates and the potential for easing later in the year.
In terms of money returned, European Smaller Companies Trust concluded its 42.5% tender offer. As usual, Scottish Mortgage returned a substantial amount. Bellevue Healthcare’s outflows illustrate the problems of running a discount control mechanism in an out of favour sector.

Major news stories and QuotedData views over May 2025
Portfolio developments
- Capital Gearing beats inflation and is now ahead of CPI over five years
- CQS Natural Resources Growth and Income – Strategic review leads to tender offer and shareholder-friendly changes
- HydrogenOne first quarter NAV broadly stable, manager publishes new “Hydrogen Handbook”
- AVI launches campaign to push for governance reforms at Wacom
- Aquila European Renewables agrees Sagres disposal at NAV
- NASCIT delivers solid returns and hikes dividend as it eyes selective deployment of cash
- 3i Infrastructure has another good year despite widening discount
- Greencoat Renewables sells Irish portfolio
- Baker Steel supports strategic investment in Futura Resources
- Edinburgh Investment Trust benefits from buybacks and narrowing discount
- Damaging Labour budget holds back BlackRock Smaller Companies
- CT UK High Income Trust outperforms and hikes dividends again
Corporate news
- Aberdeen’s Flavia Cheong to retire after 30 years building its Asian equity franchise
- JPMorgan Japanese appoints new co-manager
- CQS Natural Resources Growth and Income – Strategic review leads to tender offer and shareholder-friendly changes
- Caledonia to split shares and rebalance dividend to extend appeal
- Karl Sternberg is the new chair of Capital Gearing Trust
- NextEnergy Solar will maintain its dividend
- Polar Capital Global Financials launches 100% tender offer
- LondonMetric firms up £698.9m bid for Urban Logistics
- European Opportunities launches new tender offer
- Chrysalis launches shareholder consultation in face of AVI’s calls for a continuation vote
- Warehouse REIT offer thrown into doubt
- European Opportunities launches new tender offer
- Ecofin US Renewables – Moves to self-management as wind-down progresses
- EJF Investments launches RetailBook offer for 2029 ZDP shares
Property news
QuotedData views
Visit quoteddata.com for more on these and other stories plus in-depth analysis on some funds, the tools to compare similar funds and basic information, key documents and regulatory news announcements on every investment company quoted in London.

Interviews
Have you been listening to our weekly news roundup shows? Every Friday at 11 am, we run through the more interesting bits of the week’s news, and we usually have a special guest or two answering questions about a particular investment company.
| Friday | The news show | Special Guest | Topic |
|---|---|---|---|
| 29 November | HEIT, GRID, CLDN | Weekly News Show Special | Investing for income |
| 6 December | KPC, GPM, HOME | David Smith | Henderson High Income |
| 13 December | RNEW, AGT, TMI | Craig Baker | Alliance Witan |
| 3 January | Review of 2024 | James Carthew & Andrew McHattie | Review of 2024 |
| 10 January | CYN, MINI, RTW | Alexander Darwall | European Opportunities |
| 17 January | ENRG, FGEN, MTU, BOOK | Gary Robinson | Baillie Gifford US Growth |
| 24 January | SWEF, TMI, CRT, BLND | Joe Bauernfreund | AVI Global Trust |
| 31 January | LBOW, ESCT, THRG, IEM, ORIT | Douglas Brodie | Edinburgh Worldwide |
| 7 February | RNEW, RESI, PSDL, RSE, PEY, CYN | Mark Boggett | Seraphim Space |
| 14 February | BASC, JGC, Saba | Prashant Khemka | Ashoka WhiteOak Emerging Markets Trust |
| 21 February | FSFL, AIC, HRI, AGR. HOME | Samantha FitzPatrick | Murray International |
| 28 February | MHN, BRAI, TRIG | Richard Hulf | HydrogenOne Capital |
| 7 March | Saba, VEIL, WHR, SUPR, SHED | Philip Kent | GCP Infrastructure |
| 14 March | MGCI, AGR, CRT, SHED, LABS | Nicola Takada Wood | AVI Japan Opportunity Trust |
| 21 March | TMPL, HEIT, SDV | Richard Stone | The AIC |
| 28 March | MTE, INPP, FJV, OCI | In the HotSeat Special | Ideas for your ISA |
| 4 April | FJV, AJOT, ENRG, EAT | Laura Foll & Denis Jackson | Law Debenture |
| 11 April | PCFT | Stephen Rosser | NextEnergy Capital |
| 25 April | BBH, SDV | Richard Shepherd-Cross, Marcus Phayre-Mudge, Bradley Biggins | In The HotSeat Special: When will REITs rebound? |
| 2 May | BBGI, GCL, MCT | Nick Brind | Polar Capital Global Financials Trust |
| 9 May | EOT, CHRY, SDV | Mark Sheppard | Manchester & London Investment Trust |
| 16 May | NESF, SCF | Alex Wright | Fidelity Special Values |
| 23 May | ENRG, TPOU, RSE, JII | Alan Gauld | Patria Private Equity Trust |
| 30 May | CYN, RMII, CBLT | George Ensor, Haresh Vazirani and Mark Niznik | In The HotSeat Special: Nurturing growing businesses |
| 6 June | FGEN, JII, BRST, ESP | Fotis Chatzimichalakis | Impax Environmental Markets |
| Coming up | |||
| 13 June | Sandy Nairn and Alan Bartlett | Global Opportunities Trust | |
| 19 June | Charlie Wright, Seb Petit, James Cook, Minesh Shah and Craig Baker | QuotedData’s Investment Trust Forum 2025 | |
| 26 June | Paul Major from Bellevue Healthcare Trust and Marek Poszepczynski of IBT | In The HotSeat Special Pharmaceuticals and biotechnology | |
| 4 July | Hamish Maxwell | Scottish Mortgage |
Research
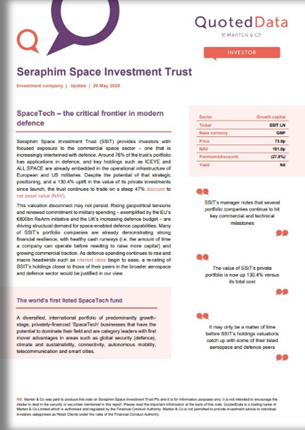
Seraphim Space Investment Trust (SSIT) provides investors with focused exposure to the commercial space sector – one that is increasingly intertwined with defence. Around 78% of the trust’s portfolio has applications in defence, and key holdings such as ICEYE and ALL.SPACE are already embedded in the operational infrastructure of European and US militaries. Despite the potential of that strategic positioning, and a 130.4% uplift in the value of its private investments since launch, the trust continues to trade on a steep 47% discount to net asset value (NAV).
This valuation disconnect may not persist. Rising geopolitical tensions and renewed commitment to military spending – exemplified by the EU’s €800bn ReArm initiative and the UK’s increasing defence budget – are driving structural demand for space(enabled defence capabilities. Many of SSIT’s portfolio companies are already demonstrating strong financial resilience, with healthy cash runways (i.e. the amount of time a company can operate before needing to raise more capital) and growing commercial traction. As defence spending continues to rise and macro headwinds such as interest rates begin to ease, a re(rating of SSIT’s holdings closer to those of their peers in the broader aerospace and defence sector would be justified in our view.
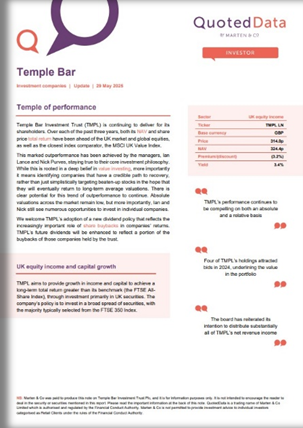
Temple Bar Investment Trust (TMPL) is continuing to deliver for its shareholders. Over each of the past three years, both its NAV and share price total return have been ahead of the UK market and global equities, as well as the closest index comparator, the MSCI UK Value Index.
This marked outperformance has been achieved by the managers, Ian Lance and Nick Purves, staying true to their core investment philosophy. While this is rooted in a deep belief in value investing, more importantly it means identifying companies that have a credible path to recovery, rather than just simplistically targeting beaten(up stocks in the hope that they will eventually return to long(term average valuations. There is clear potential for this trend of outperformance to continue. Absolute valuations across the market remain low, but more importantly, Ian and Nick still see numerous opportunities to invest in individual companies.
We welcome TMPL’s adoption of a new dividend policy that reflects the increasingly important role of share buybacks in companies’ returns. TMPL’s future dividends will be enhanced to reflect a portion of the buybacks of those companies held by the trust.
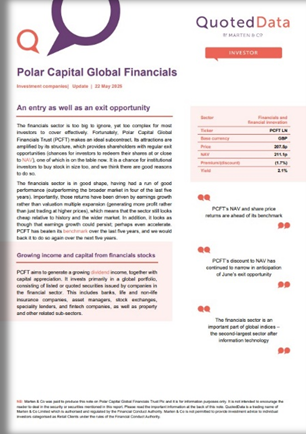
The financials sector is too big to ignore, yet too complex for most investors to cover effectively. Fortunately, Polar Capital Global Financials Trust (PCFT) makes an ideal subcontract. Its attractions are amplified by its structure, which provides shareholders with regular exit opportunities (chances for investors to redeem their shares at or close to NAV), one of which is on the table now. It is a chance for institutional investors to buy stock in size too, and we think there are good reasons to do so.
The financials sector is in good shape, having had a run of good performance (outperforming the broader market in four of the last five years). Importantly, those returns have been driven by earnings growth rather than valuation multiple expansion (generating more profit rather than just trading at higher prices), which means that the sector still looks cheap relative to history and the wider market.
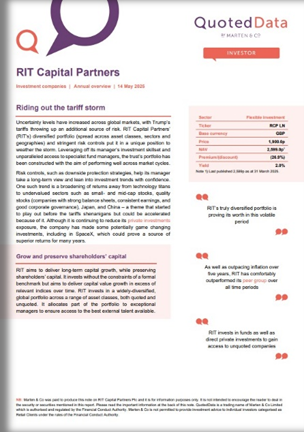
Uncertainty levels have increased across global markets, with Trump’s tariffs throwing up an additional source of risk. RIT Capital Partners’ (RIT’s) diversified portfolio (spread across asset classes, sectors and geographies) and stringent risk controls put it in a unique position to weather the storm. Leveraging off its manager’s investment skillset and unparalleled access to specialist fund managers, the trust’s portfolio has been constructed with the aim of performing well across market cycles.
Rising interest rates, a fixation on mega(cap AI stocks, and the election of a US administration that would rather “drill, baby, drill” than address the increasingly obvious and damaging effects of climate change have all combined to turn sentiment against the environmental sector.
However, as Impax Environmental Market’s (IEM’s) board and managers emphasise, the pressing need to address environmental issues – and the willingness of most countries (and even many US states) to do so – means that, from an economic perspective, IEM’s investment case still holds. The shift of investor focus away from the US technology sector and towards Europe is positive for the portfolio, and the companies that IEM is invested in continue to grow sales and profits, but are getting cheaper. At some point, that value will be recognised.
Upcoming events
Here is a selection of what is coming up. Please refer to the Events section of our website for updates between now and when they are scheduled:
- Artemis UK Future Leaders AGM 2025
- Fair Oaks Income 2021 AGM 2025
- Nippon Active Value Fund AGM 2025
- BioPharma Credit AGM 2025
- Digital 9 Infrastructure AGM 2025
- Diverse Income Trust shareholder presentation 2025
- Schroder Real Estate shareholder presentation 2025
- VPC Specialty Lending Investments AGM 2025
- Temple Bar Investment Trust shareholder presentation 2025
- Octopus Renewables Infrastructure Trust AGM 2025
- NextEnergy Solar Fund shareholder presentation 2025
- CC Japan Income & Growth Trust shareholder presentation 2025
- JPMorgan US Smaller Companies AGM 2025
- Phoenix Spree Deutschland AGM 2025
- Polar Capital Global Financials EGM 2025
- Vietnam Enterprise Investments AGM 2025
- Baillie Gifford China Growth AGM 2025
- Middlefield Canadian Income Trust AGM 2025
- Partners Group Private Equity AGM 2025
- STS Global Income & Growth Trust AGM 2025
- Caledonia Investments shareholder presentation 2025
- Foresight Environmental Infrastructure shareholder presentation 2025
- ICG Enterprise Trust AGM 2025
- STS Global Income & Growth Trust shareholder presentation 2025
- Caledonia Investments shareholder presentation 2025
- Utilico Emerging Markets Trust shareholder presentation 2025
- Renewables Infrastructure Group AGM 2025
- NB Distressed Debt Extended Life shares AGM 2025
- Downing Renewables & Infrastructure AGM 2025
- India Capital Growth Fund AGM 2025
- GCP Asset Backed Income AGM 2025
- RTW Biotech Opportunities AGM 2025
- Aurora UK Alpha AGM 2025
- Invesco Bond Income Plus AGM 2025
- TwentyFour Select Monthly Income shareholder presentation 2025
- Starwood European Real Estate Finance AGM 2025
- Bellevue Healthcare Trust EGM 2025
- Urban Logistics REIT EGM 2025
- Onward Opportunities AGM 2025
- Foresight Solar Fund AGM 2025
- Supermarket Income REIT EGM 2025
- Phoenix Spree Deutschland EGM 2025
- The Global Smaller Companies Trust shareholder presentation 2025
- Partners Group Private Equity AGM 2025
- BlackRock Smaller Companies AGM 2025
- Pantheon Infrastructure AGM 2025
- SDCL Efficiency Income AGM 2025
- European Assets Trust AGM 2025
- Gresham House Energy Storage AGM 2025
- Personal Assets Trust shareholder presentation 2025
- Shires Income shareholder presentation 2025
- Rockwood Strategic shareholder presentation 2025
- abrdn European Logistics Income AGM 2025
- HydrogenOne Capital Growth AGM 2025
- NB Distressed Debt AGM 2025
- NB Distressed Debt New Global shares AGM 2025
Guide
Our independent guide to quoted investment companies is an invaluable tool for anyone who wants to brush up on their knowledge of the investment companies’ sector. Please register on www.quoteddata.com if you would like it emailed to you directly.
Appendix 1 – median performance by sector, ranked by 2025 year to date price total return
| 1 | Property – UK Logistics | 30.0 | 0.6 | (18.4) | (15.5) | (2.9) | 743.2 |
| 2 | Latin America | 27.2 | 25.5 | (9.9) | (13.0) | 3.1 | 101.3 |
| 3 | Property – UK Healthcare | 22.2 | 2.9 | (15.6) | (15.2) | (0.4) | 616.5 |
| 4 | European Smaller Companies | 17.3 | 14.9 | (7.1) | (8.3) | 1.2 | 424.5 |
| 5 | Infrastructure Securities | 17.1 | 15.2 | (10.4) | (13.8) | 3.3 | 121.3 |
| 6 | Europe | 14.6 | 8.4 | (6.8) | (6.4) | (0.4) | 556.4 |
| 7 | UK Equity & Bond Income | 11.9 | 11.3 | (6.7) | (6.9) | 0.2 | 305.5 |
| 8 | UK Equity Income | 11.1 | 7.8 | (4.8) | (5.0) | 0.2 | 384.2 |
| 9 | China / Greater China | 10.7 | 0.2 | (10.1) | (11.0) | 0.9 | 186.5 |
| 10 | UK All Companies | 9.8 | 8.8 | (9.5) | (8.9) | (0.5) | 288.7 |
| 11 | Leasing | 7.4 | (1.5) | (22.2) | (30.2) | 7.9 | 142.6 |
| 12 | Japan | 6.6 | 3.6 | (10.0) | (10.2) | 0.2 | 295.8 |
| 13 | Japanese Smaller Companies | 6.1 | 4.8 | (4.3) | (2.9) | (1.4) | 314.9 |
| 14 | Property – UK Commercial | 5.5 | 3.2 | (17.4) | (17.4) | 0.0 | 152.6 |
| 15 | Global Emerging Markets | 5.0 | 2.2 | (10.5) | (11.3) | 0.8 | 298.1 |
| 16 | Debt – Structured Finance | 5.0 | 2.1 | (4.6) | (10.4) | 5.9 | 161.5 |
| 17 | Property – UK Residential | 5.0 | 2.2 | (37.4) | (35.4) | (2.1) | 189.0 |
| 18 | Infrastructure | 4.9 | 1.5 | (19.6) | (22.4) | 2.8 | 1,027.9 |
| 19 | Global Equity Income | 4.8 | 2.3 | (1.2) | (1.8) | 0.5 | 578.4 |
| 20 | Renewable Energy Infrastructure | 4.5 | 1.9 | (30.9) | (32.7) | 1.8 | 377.3 |
| 21 | Property – Europe | 4.1 | 2.3 | (32.1) | (31.3) | (0.8) | 199.8 |
| 22 | Debt – Loans & Bonds | 2.3 | 2.8 | 0.4 | 0.4 | 0.0 | 164.1 |
| 23 | Asia Pacific Smaller Companies | 1.6 | (5.4) | (9.1) | (11.8) | 2.7 | 348.1 |
| 24 | Property – Debt | 1.3 | 1.3 | (13.9) | (15.4) | 1.5 | 29.1 |
| 25 | Financials & Financial Innovation | 0.8 | 3.5 | (21.5) | (27.4) | 5.9 | 395.8 |
| 26 | Asia Pacific Equity Income | 0.6 | 0.8 | (9.1) | (9.0) | (0.1) | 371.6 |
| 27 | North America | 0.3 | (2.6) | (6.4) | (8.5) | 2.0 | 529.6 |
| 28 | Commodities & Natural Resources | 0.0 | 0.0 | (8.9) | (10.2) | 1.3 | 59.0 |
| 29 | UK Smaller Companies | 0.0 | 0.0 | (11.8) | (11.8) | 0.1 | 112.6 |
| 30 | Flexible Investment | (0.7) | 0.0 | (19.1) | (19.5) | 0.4 | 107.7 |
| 31 | Private Equity | (1.7) | (1.3) | (33.3) | (39.5) | 6.2 | 552.8 |
| 32 | Asia Pacific | (1.8) | (3.4) | (10.4) | (10.5) | 0.1 | 470.7 |
| 33 | Hedge Funds | (1.8) | (7.1) | (8.2) | (11.6) | 3.4 | 81.4 |
| 34 | Global | (3.3) | (2.0) | (9.9) | (9.3) | (0.6) | 1,002.0 |
| 35 | Environmental | (4.0) | (4.0) | (9.50) | (11.2) | 1.7 | 772.8 |
| 36 | Global Smaller Companies | (3.1) | (3.1) | (11.3) | (10.3) | (1.0) | 696.5 |
| 37 | Property – Rest of World | (7.1) | (7.1) | (69.3) | (65.6) | (3.6) | 14.8 |
| 38 | India/Indian Subcontinent | (8.5) | (8.5) | (7.4) | (8.5) | 1.2 | 422.1 |
| 39 | Insurance & Reinsurance Strategies | (6.3) | (6.3) | (16.6) | (26.6) | 10.0 | 61.9 |
| 40 | Technology & Technology Innovation | (5.1) | (5.1) | (10.7) | (10.6) | (0.2) | 2,632.5 |
| 41 | Growth Capital | (0.6) | (0.6) | (41.3) | (45.1) | 3.8 | 174.1 |
| 42 | Debt – Direct Lending | 0.0 | 0.0 | (16.6) | (14.6) | (2.0) | 71.6 |
| 43 | Country Specialist | (11.0) | (11.0) | (15.3) | (16.8) | 1.5 | 333.3 |
| 44 | North American Smaller Companies | (12.8) | (12.8) | (9.0) | (9.8) | 0.8 | 185.6 |
| 45 | Biotechnology & Healthcare | (12.3) | (12.3) | (8.6) | (10.6) | 2.0 | 281.7 |
| MEDIAN | 1.6 | 0.6 | (10.4) | (11.3) | 0.8 | 298.1 |
IMPORTANT INFORMATION
This note was prepared by Marten & Co (which is authorised and regulated by the Financial Conduct Authority).
This note is for information purposes only and is not intended to encourage the reader to deal in the security or securities mentioned within it. Marten & Co is not authorised to give advice to retail clients. The note does not have regard to the specific investment objectives, financial situation and needs of any specific person who may receive it.
Marten & Co may have or may be seeking a contractual relationship with any of the securities mentioned within the note for activities including the provision of sponsored research, investor access or fundraising services.
This note has been compiled from publicly available information. This note is not directed at any person in any jurisdiction where (by reason of that person’s nationality, residence or otherwise) the publication or availability of this note is prohibited.
Accuracy of Content: Whilst Marten & Co uses reasonable efforts to obtain information from sources which we believe to be reliable and to ensure that the information in this note is up to date and accurate, we make no representation or warranty that the information contained in this note is accurate, reliable or complete. The information contained in this note is provided by Marten & Co for personal use and information purposes generally. You are solely liable for any use you may make of this information. The information is inherently subject to change without notice and may become outdated. You, therefore, should verify any information obtained from this note before you use it.
No Advice: Nothing contained in this note constitutes or should be construed to constitute investment, legal, tax or other advice.
No Representation or Warranty: No representation, warranty or guarantee of any kind, express or implied is given by Marten & Co in respect of any information contained in this note.
Exclusion of Liability: To the fullest extent allowed by law, Marten & Co shall not be liable for any direct or indirect losses, damages, costs, or expenses incurred or suffered by you arising out or in connection with the access to, use of or reliance on any information contained in this note. In no circumstance shall Marten & Co and its employees have any liability for consequential or special damages.
Governing Law and Jurisdiction: These terms and conditions and all matters connected with them, are governed by the laws of England and Wales and shall be subject to the exclusive jurisdiction of the English courts. If you access this note from outside the UK, you are responsible for ensuring compliance with any local laws relating to access.
No information contained in this note shall form the basis of, or be relied upon in connection with, any offer or commitment whatsoever in any jurisdiction.
Investment Performance Information: Please remember that past performance is not necessarily a guide to the future and that the value of shares and the income from them can go down as well as up. Exchange rates may also cause the value of underlying overseas investments to go down as well as up. Marten & Co may write on companies that use gearing in a number of forms that can increase volatility and, in some cases, to a complete loss of an investment.