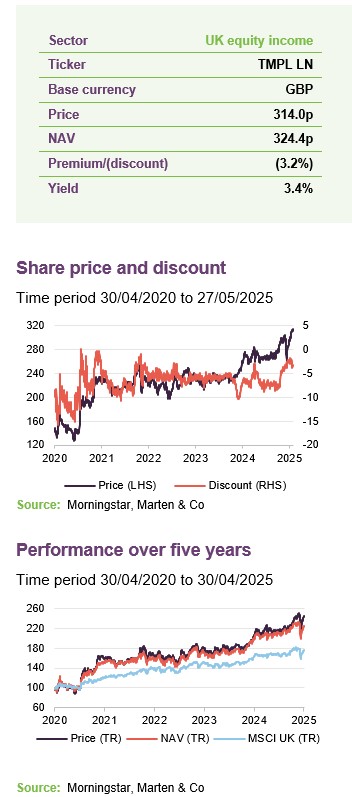
Temple of performance
Over each of the past three years, Temple Bar Investment Trust’s (TMPL’s) NAV and share price total returns have been ahead of the UK market and global equities, as well as the MSCI UK Value Index.
The managers, Ian Lance and Nick Purves, say that this relative outperformance has been achieved through the consistent application of their investment philosophy. While this is rooted in a deep belief in value investing, it also means identifying companies that they believe have a plausible path to recovery, rather than just simplistically targeting beaten-up stocks in the hope that they will eventually return to par. The current environment suggests the possibility that this pattern of performance may persist. Absolute valuations across the market remain low and Ian and Nick say that they continue to identify a range of companies they believe are suitable for investment.
We note TMPL’s adoption of a new dividend policy that it says reflects the increasingly important role of share buybacks in returns. Future dividends will be enhanced to reflect a portion of the buybacks of those companies held by the trust.
UK equity income and capital growth
TMPL aims to provide growth in income and capital to achieve a long-term total return greater than its benchmark (the FTSE All-Share Index), through investment primarily in UK securities. The company’s policy is to invest in a broad spread of securities, with the majority typically selected from the FTSE 350 Index.
| 12 months ended | Share price total return (%) | NAV total return (%) |
MSCI UK total return (%) | MSCI UK Value TR (%) |
MSCI World TR (%) |
|---|---|---|---|---|---|
| 30/04/2021 | 57.1 | 50.9 | 20.8 | 21.4 | 18.6 |
| 29/04/2022 | 4.2 | 4.6 | 15.6 | 19.5 | 8.4 |
| 28/04/2023 | 9.1 | 9.0 | 7.8 | 7.7 | 8.2 |
| 30/04/2024 | 14.5 | 14.8 | 8.2 | 9.3 | 5.2 |
| 30/04/2025 | 19.7 | 14.0 | 8.1 | 9.7 | 5.7 |
Highly volatile markets have suited value investors
Donald Trump’s tariffs have caused extreme volatility this year
Markets have been on a volatile trajectory so far in 2025. Initially, there was a continuation of the optimism seen after the decisive US presidential election result, on hopes that President Trump would prioritise the cutting of taxes and regulation to the benefit of businesses. However, this soon gave way to growing concerns about tariffs and trade. After an initial dispute with Canada and Mexico, these worries ramped up on “Liberation Day” on 2 April as Trump announced a baseline 10% tariff for all countries, and additional reciprocal levies, the levels of which were calculated based on bilateral deficits with the US.
A week later, the sharp fluctuations in equity, currency and bond markets appeared to prompt a 90-day pause from the White House on the additional tariffs above the base line 10% level (excluding China, which was hit with elevated tariff levels that were said to be in response to its retaliatory measures). Since then, the administration has said that it has been focused on securing bilateral trade agreements; the first to be announced was with the UK, while a seemingly much more significant agreement with China saw tariffs on both sides reduced from the exceptionally high levels above 100% that they had reached.
What happens from this point is uncertain. Nonetheless markets have generally returned to a calmer mood, with the S&P 500 erasing all of its losses since 2 April, albeit still being below its recent high in February.
Figure 1: Markets year-to-date to 30 April 2025, indices rebased to 100

Source: Bloomberg, Marten & Co
Although this period of higher volatility does not appear to have been helpful for most investors other than perhaps the most risk-averse managers, it seems to have been relatively advantageous for value investors. The sell-off appeared to be particularly pronounced in growth-oriented sectors, led by the “Magnificent Seven” technology behemoths in the US, with companies with relatively higher earnings in the present seemingly more attractive as a result. TMPL’s manager say that this has been helpful for the UK market, which, after some periods of underperformance, has outperformed the US and global indices (which are dominated by US equities). For example, the MSCI UK Index returned 4.1% in the first four months of the year, against a fall of 5.3% for the S&P 500.
With what appears to have been a backdrop of improving sentiment for value stocks, TMPL performed strongly. During previous periods when value was out of favour, Ian and Nick focused on their strategy of investing in companies at significantly wide discounts that they say were well positioned to recover with the right catalysts. As is covered in detail in the Performance section starting on page 7, this approach appears to have paid off recently for TMPL.
Ian and Nick generally look to take advantage of periods of market volatility, as opportunities may be presented if investors over-react to market developments. However, on this occasion, the managers sas that the recovery was so swift that few such opportunities emerged. Nonetheless, they say that they did still take advantage at the margins, for example by adding to the new holding of Johnson Matthey (see below) on what they believed would be temporary price declines.
Asset allocation
TMPL’s overall sector allocation has remained relatively stable since our last note (which used data from 30 September 2024). Financials remain the largest sector, accounting for three of the four biggest holdings, and five of the top 10. There has been notable performance from the likes of Barclays, NatWest, Standard Chartered and Aviva. The managers used this price appreciation as an opportunity to trim some of the holdings, hence the slight overall reduction in the sector’s allocation. This capital was redeployed into stocks that had been subject to significant recent declines, notably the new holdings of Macy’s and Johnson Matthey (see page 6).
Figure 2: TMPL sector distribution as at 30 September 2024
Figure 3: TMPL sector distribution as at 30 April 2025

Source: Temple Bar Investment Trust
Source: Temple Bar Investment Trust
Gearing
TMPL’s gearing was 5.7% as at 30 April, down from 6.7% at the time of our last note in October 2024.
Top 10 holdings and recent additions
Figure 4: Top 10 holdings as at 30 April 2025
| Holding | Sector | % of portfolio 30/04/25 |
% of portfolio 30/09/24 | Change (%) |
|---|---|---|---|---|
| Shell | Oil & gas | 5.0 | 5.7 | (0.7) |
| NatWest | Financials | 5.0 | 5.7 | (0.7) |
| Aviva | Financials | 4.9 | 4.4 | 0.5 |
| NN | Financials | 4.8 | 4.1 | 0.7 |
| ITV | Communications | 4.7 | 4.9 | (0.2) |
| Barclays | Financials | 4.6 | 5.3 | (0.7) |
| Marks & Spencer | Consumer Staples | 4.0 | 4.0 | – |
| BP | Oil & gas | 4.0 | 4.6 | (0.3) |
| Standard Chartered | Financials | 3.6 | – | N/A |
| Johnson Matthey | Materials | 3.5 | – | N/A |
| Total of top 10 | 49.0 | 38.7 | 10.3 |
TMPL’s top 10 positions account for very nearly half of the portfolio, which is slightly more concentrated than when we published our last note in October. Johnson Matthey is a new holding in the portfolio, while Standard Chartered has moved from just outside the top ten to just inside. The two names to drop out of the top 10 were Anglo American and TotalEnergies, in keeping with the reduction in the portfolio’s exposure to the energy sector, as per Figure 3.
We wrote about the investment case for Standard Chartered in some detail in our last note. Since then, the shares have appreciated significantly in value, and Ian and Nick have taken some profit by trimming the position.
Johnson Matthey
Figure 5: Johnson Matthey (GBp)

Source: Bloomberg
Johnson Matthey (matthey.com) is a new purchase by Ian and Nick, and their preference for the company is shown by its immediate appearance within the top 10 holdings. The chemicals company is listed in the UK, but serves markets across the globe. In recent years it has focused increasingly on sustainable technologies, and operates through four primary segments: clean air, platinum group metals services, catalyst technologies and hydrogen technologies.
TMPL managers says that some of these segments have been challenged, and they believe that the company has not been run to its full potential. For example, they comment that the clean air business currently makes a 10% margin, when the company’s competition makes double that figure. Furthermore, as a c.£2bn market cap company, they feel that Johnson Matthey is simply too small to compete effectively in hydrogen, an inherently uncertain market in their view, and they believe that a strategic exit is required, for example through a joint venture. If these two areas can be addressed, the managers believe that Johnson Matthey’s EPS could rise significantly.
The presence of a vocal activist shareholder on the register could be the catalyst for these changes in the managers’ view. US-based Standard Investments holds an 11% stake in the company and has been vocal in its criticism of Johnson Matthey’s management. This pressure may already be leading to changes such as the announcement from the chairman that he will step down later this year.
Macy’s
Figure 6: Macy’s (US$)

Source: Bloomberg
Whilst not yet a top 10 position, another new addition to TMPL’s portfolio is US department store Macy’s (www.macys.com). Bricks-and-mortar retail – particularly department stores – has faced pressure from the growth of online retail, though the shift has been less rapid in the US than in some places, according to TMPL’s managers. Macy’s has not delivered profit growth, but it remains highly cash-generative they say, adding that capital allocation decisions have been suboptimal, however. With the shares trading at just 4–5x earnings, they believe that cutting capex and buying back stock could unlock significant value.
The company was the subject of takeover interest for much of the first half of 2024, with a final bid of $24.80/share valuing it at $6.9bn. The board walked away from negotiations in July, citing undervaluation, but the shares have since halved, raising questions about management’s approach and leaving room for potential renewed acquisition interest. They think that any fresh approach might achieve greater traction.
M&A activity
Ian and Nick are clear – takeover speculation alone is not enough to justify an investment. Even so, M&A can contribute positively to returns. Four of TMPL’s holdings attracted bids in 2024, highlighting potential market interest in portfolio companies.
EP Group’s £3.6bn takeover of International Distribution Services, the parent company of Royal Mail, has now received shareholder approval, following earlier sign-off from the UK government, which retains a “golden share” with key veto rights.
After rejecting earlier bids from the Belgian insurer Ageas, Direct Line eventually reached an agreement with Aviva in December on a £3.7bn deal, which came at a 73% premium to the undisturbed share price. The deal is under review by the UK’s Competition and Markets Authority, with initial findings expected by July.
Anglo American was the subject of several bids from BHP, the world’s largest mining company. Anglo’s board rejected these as not reflective of their assessment of the company’s potential and BHP announced it had withdrawn from the process in May.
The UK’s leading electronics retailer, Currys, was the subject of takeover interest from US private equity firm Elliott Advisors and the Chinese e-commerce platform JD.com, with the former making two firm bids, the highest at 67p. Both were withdrawn after opposition from Currys’s board. The share price rising from below 50p prior to the bids to over 120p.
M&A activity has been relatively lower in recent months, possibly due to influenced by increased market volatility and policy uncertainty in the US. Closer to home, the Labour government’s autumn budget – which included higher employer NICs – may not have helped, either. TMPL’s manager thinks that this quieter period could persist for the rest of the year.
Performance
TMPL’s performance continues to be notable on both an absolute and a relative basis. The current Redwheel management has extended the NAV total return since taking over in November 2020 to 135%, with a share price return of 145%.
Figure 7: Temple Bar NAV relative to MSCI UK and MSCI UK Value (sterling TR) to 30 April 2025
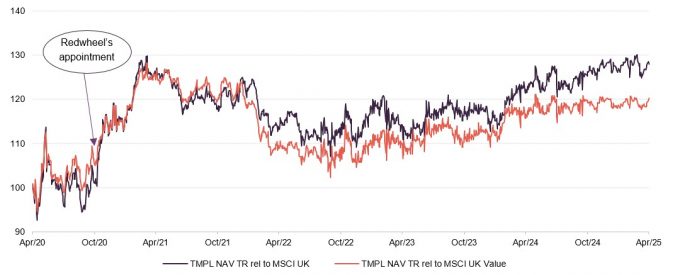
Source: Morningstar, Marten & Co
The returns of the previous manager, which targeted a deep-value strategy in a period that was dominated by growth stocks, have largely fallen out of the five-year figures. Ian and Nick have outperformed the benchmark MSCI UK Index over all of the periods that come under their tenure in Figure 8. Furthermore, they have also outperformed the narrower MSCI UK Value index that better reflects their deep-value style.
Ian and Nick report that the current portfolio remains at a discount to the UK market, at a weighted average of around 9x earnings, even with UK stocks broadly trading at modest valuation levels. As such, they say that there remains the potential for considerable upside for the portfolio from here.
The past year has been a period of relative NAV outperformance for TMPL, with a more favourable share price performance reflecting a narrowing (and close to elimination) of the discount during the year.
Figure 8: Total return performance over periods ending 30 April 2025
| 3 months (%) |
6 months (%) |
1 year (%) |
3 years (%) |
Manager tenure1 (%) | 5 years (%) |
|
|---|---|---|---|---|---|---|
| TMPL share price | 6.4 | 15.2 | 19.7 | 50.0 | 152.4 | 144.8 |
| TMPL NAV | 0.6 | 8.4 | 14.0 | 42.3 | 135.4 | 125.1 |
| MSCI UK | (0.4) | 6.9 | 8.1 | 26.6 | 85.7 | 76.0 |
| MSCI UK Value | (1.0) | 7.4 | 9.7 | 29.7 | 106.1 | 87.3 |
We look at some of the existing holdings that have contributed to performance or have had significant newsflow in recent months.
Barclays
Figure 9: Barclays (GBP)

Source: Bloomberg
TMPL’s managers cite Barclays (home.barclays) as an example of the recent positive performance the trust has had with its financials holdings. In February 2024, at a share price of 140p, the P/E ratio stood at 4x, which the managers describe as very low. They add that this made share buybacks a highly attractive way of enhancing shareholder returns, which Barclay’s board took advantage of through a £1bn programme up to the end of July and a further £750m to the end of the year. This was as part of a broader strategy to return at least £10bn to shareholders through a combination of share purchases and dividends between 2024 and 2026.
TMPL’s managers comment that these proactive measures were taken alongside reporting strong financial results to the market. They add that these trends were seen across many names in the sector and are the reason that, of the 19% overall return for TMPL over 2024, half came from the financials holdings, despite accounting for less than a third of the overall portfolio. Although Barclays did see a significant price decline in the immediate aftermath of “Liberation Day”, the shares have since recovered all those losses and are currently at their high point for the year.
Marks & Spencer
Figure 10: Marks & Spencer (GBP)

Source: Bloomberg
We have previously written about TMPL’s investment in Marks & Spencer (corporate.marksandspencer.com), and the strong share price performance achieved by the current management team at M&S. As is illustrated in Figure 10, M&S has experienced notable share price gains during the past year, although the last six months have been characterised by significant fluctuations. The company has experienced a substantial drop in share price in response to a much-publicised cyber-attack that resulted in all online orders being suspended and the theft of some customer data. At the time of writing, the website is still not accepting any customer orders.
Whilst a disruptive event for the business, TMPL’s managers think that the long-term impact on the shares should be relatively minor. Although the financial cost is likely to be substantial in the short term, the company is protected by insurance and the brand equity remains strong, according to the managers – a YouGov survey earlier this year ranked it highly among UK brands based on factors such as quality, value, reputation, and customer satisfaction. The managers believe that the buy case remains strong – they highlight that the shares still look undervalued, despite the strong performance of recent years, at a trailing P/E of 14.8x against their five-year average of 19.1x.
Peer group
You can find up-to-date information on TMPL and its peers on our website
TMPL is one of the larger trusts within the AIC’s UK equity income sector, where it compares favourably with its peers across a number of metrics. Discounts have generally narrowed across the sector in recent months, but the move has been considerably pronounced for TMPL and, as a result, its 2% discount is narrower than most of its peers (the median discount in the sector is 5.7%). The ongoing charges ratio at 0.61% is modestly below the peer group median of 0.63%.
At 3.5%, the yield continues to be towards the bottom of the peer group. However, with the dividend payout having increased, the reason for the small fall in yield since our last note in October is the substantial share price appreciation rise since then. The board says that it remains committed to steadily increasing the dividend payout each year, supported by the new dividend policy that is explained on page 11.
Figure 12: Snapshot of UK equity income sector as at 27 May 2025
| Premium/(discount) (%) |
Yield (%) |
Ongoing charges (%) |
Market cap (£m) |
|
|---|---|---|---|---|
| Temple Bar Investment Trust | (3.2) | 3.4 | 0.61 | 894 |
| abrdn Equity Income Trust | 1.1 | 6.5 | 0.86 | 168 |
| BlackRock Income and Growth | (13.4) | 2.5 | 1.15 | 39 |
| Chelverton UK Dividend Trust | (2.5) | 9.3 | 2.73 | 31 |
| CT UK Capital and Income | (4.2) | 3.9 | 0.67 | 325 |
| Diverse Income Trust | (5.7) | 4.3 | 1.14 | 236 |
| Dunedin Income Growth | (8.2) | 4.8 | 0.56 | 384 |
| Edinburgh Investment Trust | (7.8) | 3.4 | 0.51 | 1,157 |
| Finsbury Growth & Income | (7.7) | 2.1 | 0.61 | 1,324 |
| JPMorgan Claverhouse | (5.6) | 4.6 | 0.63 | 428 |
| Law Debenture Corporation | 1.6 | 3.5 | 0.51 | 1,278 |
| Lowland Investment Company | (7.8) | 4.6 | 0.66 | 326 |
| Murray Income Trust | (9.7) | 4.6 | 0.5 | 840 |
| Schroder Income Growth Fund | (9.1) | 4.6 | 0.79 | 210 |
| Shires Income | (4.1) | 5.4 | 1.1 | 107 |
| The City of London Investment | 0.4 | 4.5 | 0.37 | 2,349 |
| The Merchants Trust | (3.7) | 5.2 | 0.52 | 839 |
| Peer group median | (5.6) | 4.6 | 0.63 | 384 |
| TMPL rank | 5/17 | 15/17 | 10/17 | 5/17 |
Figure 13: Total return performance over periods ending 30 April 2025
| 3 months (%) |
6 months (%) |
1 year (%) |
3 years (%) |
Under Redwheel (%) | 5 years (%) |
|
|---|---|---|---|---|---|---|
| Temple Bar Investment Trust | 0.6 | 8.4 | 14.0 | 42.3 | 135.4 | 125.1 |
| abrdn Equity Income Trust | (1.2) | 4.5 | 10.1 | 7.6 | 57.8 | 49.3 |
| BlackRock Income and Growth | (3.7) | 2.3 | 6.1 | 19.0 | 62.0 | 57.8 |
| Chelverton UK Dividend Trust | (8.4) | (8.5) | (6.1) | (14.1) | 52.0 | 55.9 |
| CT UK Capital and Income | (1.8) | 3.6 | 3.4 | 17.9 | 66.1 | 60.3 |
| Diverse Income Trust | 0.7 | 2.8 | 11.4 | 3.1 | 36.7 | 43.4 |
| Dunedin Income Growth | (1.1) | 3.6 | 4.8 | 22.2 | 47.8 | 47.7 |
| Edinburgh Investment Trust | (1.3) | 4.1 | 9.7 | 36.7 | 102.0 | 100.0 |
| Finsbury Growth & Income | (4.9) | 7.0 | 11.2 | 15.5 | 37.2 | 38.2 |
| JPMorgan Claverhouse | 2.1 | 9.3 | 10.6 | 27.7 | 79.5 | 81.4 |
| Law Debenture Corporation | (1.3) | 2.5 | 7.5 | 26.3 | 102.2 | 107.0 |
| Lowland Investment Company | (0.7) | 2.7 | 4.1 | 18.1 | 79.8 | 74.3 |
| Murray Income Trust | (3.5) | 2.1 | 1.3 | 12.6 | 46.6 | 44.8 |
| Schroder Income Growth Fund | (1.0) | 3.7 | 6.8 | 17.8 | 71.1 | 68.4 |
| Shires Income | (1.5) | 3.8 | 5.9 | 13.0 | 52.1 | 52.6 |
| The City of London Investment | 3.2 | 10.8 | 14.5 | 30.3 | 93.0 | 81.8 |
| The Merchants Trust | (1.5) | 2.3 | 3.8 | 16.0 | 111.0 | 96.8 |
| Peer group median | (1.3) | 3.6 | 6.8 | 17.9 | 66.1 | 60.3 |
| TMPL rank | 4/17 | 3/17 | 2/17 | 1/17 | 1/17 | 1/17 |
Dividend
The dividend payout has grown again
TMPL continues to make quarterly dividend payments to shareholders. The final two payments for 2024 were each 3p, taking the full amount for the year to 11.25p, a 17.2% increase on 2023. The board has reiterated its intention to distribute, over time, substantially all of TMPL’s net revenue income, and aims to maintain consistent dividend growth in future years.
Such growth has been made easier by a material amendment in TMPL’s dividend policy that was approved at the most recent AGM. TMPL says that companies are increasingly making returns to their investors through share buybacks rather than, or in addition to, income payments. It adds that this is especially evident among many of its portfolio holdings, which currently trade at comparatively low valuations – half of those in the portfolio bought back stock in 2024.
The board wishes for TMPL shareholders to benefit from this trend and, as such, will enhance the dividends being paid to reflect a portion of these buybacks by tapping into TMPL’s distributable reserves. The recently announced 3.75p first interim dividend for 2025 included such an enhancement, of 0.75p.
Figure 14: TMPL’s recent dividend record as of 30 April 2025

Source: Temple Bar Investment Trust
Premium/(discount)
Over the last 12 months, TMPL’s shares have traded at a discount between 2% and 9%, with an average figure of 6.2%. As can be seen in Figure 15, there has been a discernible reduction so far in 2025, such that the discount is the lowest it has been in over three years.
Figure 15: TMPL discount over five years ended 30 April 2025
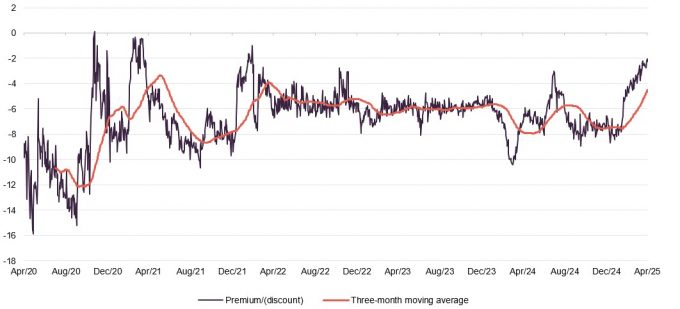
Source: Morningstar, Marten & Co
It is possible that the recent discount narrowing is in part a reflection of the strength of TMPL’s performance, particularly the improvement in its relative performance in an environment of higher interest rates witnessed during the last three years, along with the board’s active approach to repurchasing shares (it aims to address demand and supply imbalances) when the discount is at more elevated levels. Although no shares have been repurchased since February this year, 5.218m shares were repurchased in 2024 – a period that exhibited greater volatility in the discount – at a cost of £12.7m. There could be scope for further discount narrowing. If TMPL and value continue to outperform, and sentiment towards the UK improves, these effects could trigger a narrowing of its discount, with the potential to push it to a premium rating.
Fund profile
You can access the trust’s website at: templebarinvestments.co.uk
TMPL aims to provide growth in income and capital to achieve a long-term total return greater than its benchmark (the FTSE All-Share Index), through investment primarily in UK securities. The company’s policy is to invest in a broad spread of securities with typically the majority of the portfolio selected from the constituents of the FTSE 350 Index.
Co-managers Nick Purves and Ian Lance aim to rotate the portfolio into those companies that they assess are trading at a significant discount to intrinsic value. This involves buying the shares of companies with low valuations and limited current investor favour and holding them for the long term until their share prices align more closely with the managers’ assessment of fair value, or until even more perceivably attractive ideas present themselves.
Redwheel became manager of TMPL on 1 November 2020
After 18 years under its previous manager, on 23 September 2020 the board announced that it had selected RWC Asset Management (which rebranded as Redwheel in 2022) as TMPL’s new investment manager. Redwheel took on responsibility for the portfolio with effect from 1 November 2020, with Nick and Ian named as co-managers. They have over 50 years’ experience between them and have worked together for more than 15 years. The two co-manage over £3bn of assets across a number of income funds. TMPL’s AIFM is Frostrow Capital.
Previous publications
Readers interested in further information about TMPL may wish to read our previous note, Historic opportunity, published on 22 October 2024, as well as our previous notes. You can read the notes by clicking on them in Figure 17 or by visiting our website.
Figure 17: QuotedData’s previously published notes on TMPL
| Title | Note type | Date |
|---|---|---|
| Keeping faith | Initiation | 23 September 2020 |
| Just getting started | Update | 23 April 2021 |
| No compromise | Annual overview | 8 December 2021 |
| Time to Shine | Annual overview | 31 August 2022 |
| True Colours | Update | 26 June 2023 |
| Foundations for success | Update | 27 March 2024 |
| Historic opportunity | Annual overview | 22 October 2024 |
IMPORTANT INFORMATION
Marten & Co (which is authorised and regulated by the Financial Conduct Authority) was paid to produce this note on Temple Bar Investment Trust Plc.
This note is for information purposes only and is not intended to encourage the reader to deal in the security or securities mentioned within it. Marten & Co is not authorised to give advice to retail clients. The research does not have regard to the specific investment objectives financial situation and needs of any specific person who may receive it.
The analysts who prepared this note are not constrained from dealing ahead of it but, in practice, and in accordance with our internal code of good conduct, will refrain from doing so for the period from which they first obtained the information necessary to prepare the note until one month after the note’s publication. Nevertheless, they may have an interest in any of the securities mentioned within this note.
This note has been compiled from publicly available information. This note is not directed at any person in any jurisdiction where (by reason of that person’s nationality, residence or otherwise) the publication or availability of this note is prohibited.
Accuracy of Content: Whilst Marten & Co uses reasonable efforts to obtain information from sources which we believe to be reliable and to ensure that the information in this note is up to date and accurate, we make no representation or warranty that the information contained in this note is accurate, reliable or complete. The information contained in this note is provided by Marten & Co for personal use and information purposes generally. You are solely liable for any use you may make of this information. The information is inherently subject to change without notice and may become outdated. You, therefore, should verify any information obtained from this note before you use it.
No Advice: Nothing contained in this note constitutes or should be construed to constitute investment, legal, tax or other advice.
No Representation or Warranty: No representation, warranty or guarantee of any kind, express or implied is given by Marten & Co in respect of any information contained on this note.
Exclusion of Liability: To the fullest extent allowed by law, Marten & Co shall not be liable for any direct or indirect losses, damages, costs or expenses incurred or suffered by you arising out or in connection with the access to, use of or reliance on any information contained on this note. In no circumstance shall Marten & Co and its employees have any liability for consequential or special damages.
Governing Law and Jurisdiction: These terms and conditions and all matters connected with them, are governed by the laws of England and Wales and shall be subject to the exclusive jurisdiction of the English courts. If you access this note from outside the UK, you are responsible for ensuring compliance with any local laws relating to access.
No information contained in this note shall form the basis of, or be relied upon in connection with, any offer or commitment whatsoever in any jurisdiction.
Investment Performance Information: Please remember that past performance is not necessarily a guide to the future and that the value of shares and the income from them can go down as well as up. Exchange rates may also cause the value of underlying overseas investments to go down as well as up. Marten & Co may write on companies that use gearing in a number of forms that can increase volatility and, in some cases, to a complete loss of an investment.