Temple Bar
Investment Companies | Update | 27 March 2024
Foundations for success
We are now more than three years into the tenure of Ian Lance and Nick Purves as managers of the Temple Bar Investment Trust. In that time, the Redwheel team has established a well-diversified portfolio of value-orientated holdings, positioned for what they believe is a long-overdue reversion to more normal market conditions, after a decade of exceptional economic policy and quantitative easing.
Slowing growth and stubborn inflation in the UK have weighed on returns over the past 12 months. However, the trust remains well ahead of both benchmark and peer group averages since the change in management, and the current negative sentiment surrounding UK markets has allowed Ian and Nick to pick up a number of market-leading companies at historically low multiples. There remain challenges in the short term, particularly around the path of inflation; however, we believe the pragmatic value strategy implemented by the managers leaves the trust increasingly well positioned.
UK equity income and capital growth
TMPL aims to provide growth in income and capital to achieve a long-term total return greater than its benchmark (the FTSE All-Share Index), through investment primarily in UK securities. The company’s policy is to invest in a broad spread of securities, with the majority typically selected from the FTSE 350 Index.
Market background
Targeted, bottom-up approach looking for stocks that are trading at a discount to their intrinsic value
Global markets continued to rally through the start of 2024, with sentiment in the US (which now makes up almost 60% of the MSCI All Countries World Index) approaching peak euphoria. You can pick and choose your metric; however, it is hard to argue against calls that equity valuations in the world’s largest economy are becoming stretched.
The surge over the past four months is one of the largest in recent history, reminiscent of the 2021 growth bonanza that drove valuations for all manner of low-interest rate beneficiaries, including SPACs, unprofitable tech, and crypto to extremes. This time around, AI is carrying the baton, dragging the usual suspects along for the ride, as market pricing reflects an end to the Fed’s tightening cycle and a series of rate cuts throughout the year, albeit with some speed bumps along the way as persistent inflation continues to disrupt the market’s Goldilocks narrative.
So far, however, core price inflation – which remains above target and has accelerated over the past couple of months – has failed to ruin the party, with the S&P 500 and Nasdaq printing fresh highs, thanks especially to the rally in poster child NVIDIA, which is up a whopping 84% YTD, and 280% in the last 12 months.
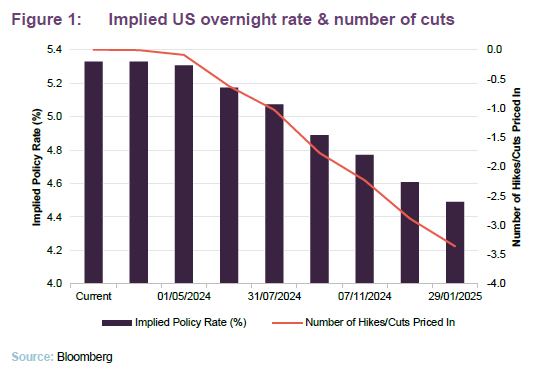
For value-focused strategies such as TMPL’s, the AI-driven rally in equity markets has been a headwind for its relative performance when compared against global benchmarks and has not been aided by TMPL’s UK focus, where inflation, albeit reduced, remains higher than expected. However, with inflation now passed it peak, bar the odd blip, TMPL’s exposure to cyclicals, could give it a significant boost once there is more certainty that the economic outlook is improving.
Value still a winner
Investments are made over at least a five-year time horizon
Despite this, the managers remain optimistic, noting that investments are made over -at least a five-year time horizon, with little focus on the month-to-month or quarter-to-quarter fluctuations that can lead many traders into the troubled waters of knee-jerk reactions and ultimately, long-term underperformance. Ian and Nick instead use sentiment driven swings – such as the current US rally – as opportunities to invest in strong and stable companies at heavy discounts, leaving the TMPL portfolio well positioned to benefit from a long overdue reversion to more normal market conditions after a decade of exceptional policy and quantitative easing.
Such a strategy is born out of long-term evidence, illustrated by Figure 2 below from US fund manager John Hussman. Portfolio manager Ian Lance describes this as one of the most important charts in finance.
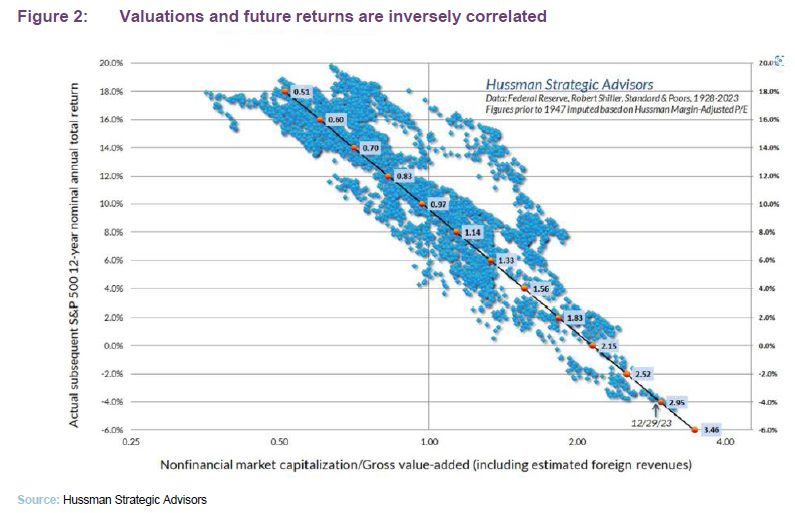
The chart shows the correlation between the valuation of the US equity market and the subsequent returns that were earned from it by investors over the next 12 years, with the steep, negative slope highlighting the fall in returns as valuation increases. In fact, with a R-squared value of -0.93, the chart points to an overwhelmingly strong relationship between the two variables (particularly if you consider that as a rule, a value of 0.5 could be considered relatively strong in many statistical analyses).
The valuation of the US stock market at the end of 2023 was one of the highest-ever observed in the period since 1928.
To highlight the relationship, Ian notes that a valuation point of 0.60 tends to produce returns of about 16% per annum. Contrast this with the data on the right-hand side of the chart, where a valuation of 2.95 has historically resulted in annualised losses of 4% per annum over the subsequent 12 years.
The notation towards the bottom right-hand side of the chart highlights the valuation of the S&P 500 at the end of 2023 (with the index up some 9% since this was calculated). Historically, paying this valuation has led to long-term losses for investors. Secondly, note the lack of dots to the right of this valuation point. This is because the valuation of the US stock market at the end of 2023 was one of the highest-ever observed in the period since 1928.
Long-term view
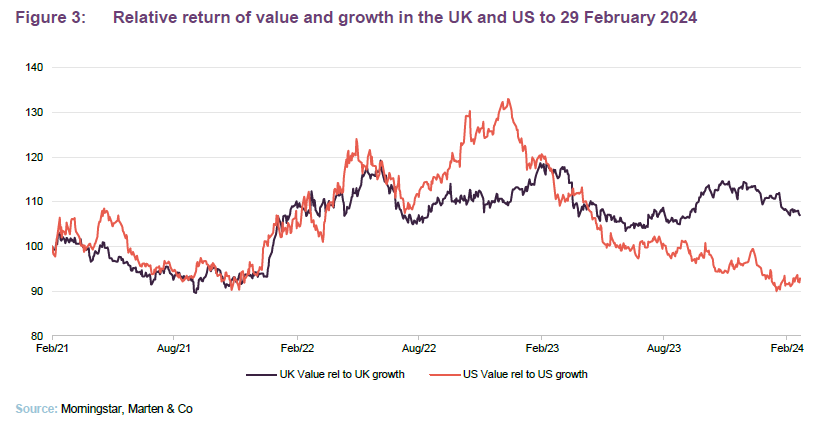
In order to justify current valuations, many proponents believe that we have entered a new paradigm thanks to AI and the productivity gains it is expected to bring. Whilst Ian and Nick hold a healthy respect for the potential of AI, they maintain their view that fundamentals will continue to drive prices over the long term. With valuations at historic lows in many sectors, they believe the opportunity to invest in established leaders in these markets is as good as it has ever been. As recently as 2022, this proved to be a winning strategy as value dramatically outperformed, and whilst it is easy to get caught up in the hype, since the end of 2021, value still comfortably outperforms its growth counterparts in the UK and has only recently been surpassed in the US, as shown in Figure 3.
While market sentiment remains heavily weighted against value, as we saw only 18 months ago, this can swing dramatically. TMPL’s managers also highlight the problem of recency bias, noting that the success of growth companies through the 2010s is far and away the exception, and not the rule over the long term. In fact, lowly-valued stocks have outperformed their growth counterparts in every decade bar two in the last 110 years, with the other previous period of outperformance occurring in the 1920s.
Portfolio management: More than just value
This distinction between value and growth is useful for illustrative purposes, however it is important to note that the TMPL portfolio exists as much more than a simple value fund. Valuations do provide the basis for portfolio selection; however, there remains an exhaustive, bottom-up approach to investment, with the managers identifying companies not only trading on attractive valuations but also generating stable earnings and capable of producing long term, structural upside. As noted, Ian and Nick look to take advantage of short-term swings in sentiment to identify stocks that they believe are trading at a discount to their intrinsic value, and this quality overlay helps weed out the potential for value traps.
Asset allocation
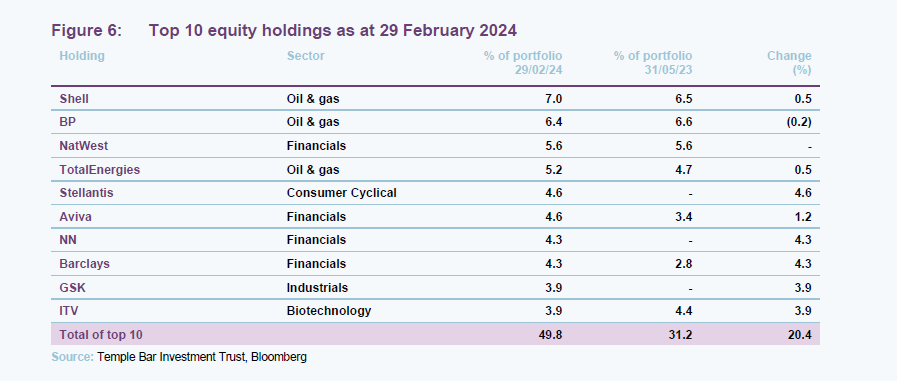
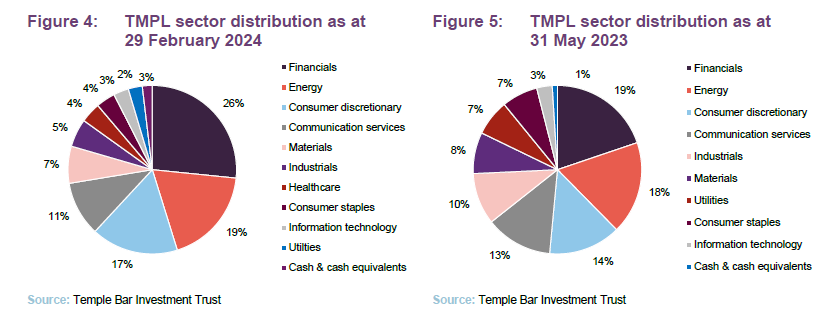
Since our last note (using data from 31 May 2023), TMPL has seen a large increase in financial exposure including a new holding in NN, and an increased weighting for Barclays. The sector now accounts for more than a quarter of the fund. Both the energy and consumer discretionary sectors also saw increases, with the weightings of many of the company’s smaller exposures falling.
Gearing
Gearing for the fund increased to 8.0%, up from 7.2% at the time of our last note in June 2023, with the managers balancing the cost of additional leverage with current depressed valuations in the market.
Top 10 holdings
The top 10 holdings make up 49.8% of the fund. Since our last note, there has been a reshuffle with five changes to this group, with Stellantis, Aviva, NN, Barclays, and GSK featuring in place of Marks and Spencer, Centrica, Standard Chartered, Pearson, and WPP, although all five remain in the portfolio.
Barclays
In our last note we provided some background on the UK financial sector and the long-term divergence in the valuations of many of its constituents compared to counterparts in US. Whilst there have been signs of this narrowing in recent years, reflecting the growing resilience of the UK banks which have diversified their deposit bases and are underpinned by stronger regulatory frameworks, the gap remains, in many cases, as large as ever.
The issue has confounded many, including Bank of England governor Andrew Bailey, who told a recent gathering that the low valuations of UK banks puzzle him. He noted that, though better capitalised than ever, shareholders refuse to pay anything close to book value for them.
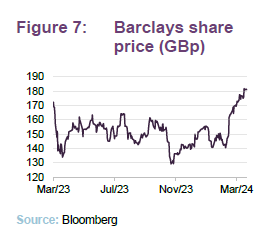
Nowhere is this truer than for British bank Barclays, which trades at just 0.5x the value of its shareholders’ equity, one of the worst valuations of any major western lender. Shares have trailed global benchmarks by more than five percentage points a year over the last five years, even with a recent rally, as the bank has failed to match its strategic objectives, underperforming financial targets while stumbling from what has seemed like one public relations disaster to another. Much of the focus over this period has been on the operations of its investment banking arm (the largest of its type outside the US) which now accounts for almost three quarters of the bank’s assets and has struggled to deliver returns consistently in line with its Wall Street counterparts.
The ongoing underperformance has led many investors to lose faith, as various strategic reviews have failed to revitalise performance. However, there are those – including the TMPL managers – who believe that its diversified asset base, improving profitability and strong capital position leave it capable of a positive inflection. This optimism was rewarded during the pandemic as the active M&A environment drove profitability in its investment banking arm, while other more retail- and commercially-focused banks suffered. More recently, Barclay’s has announced an ambitious plan to address its long-depressed valuation, boost revenues, and cut expenses while shifting the banks reliance away from investment banking. This included a pledge to return £10bn to shareholders over the next three years (in addition to $3bn delivered in 2023).
While there remains plenty of work to be done to repair the bank’s damaged reputation among investors, the initial reaction to the recent announcement has been positive and there is cause for optimism, particularly given the current valuation and the underlying quality of Barclay’s assets. For Ian and Nick, they see the new strategic direction as increasingly promising, and while there will certainly be speed bumps given the breadth of changes undertaken by the bank, over the next few years they expect the results to drive considerable upside.
Aviva
Much like Barclay’s, British multinational insurer Aviva has been a perennial underperformer, with the company struggling to balance its operations across the UK, Europe, and Asia, along with its composite model of general insurances, life businesses, and asset management. A lack of strategic direction and an unsustainable increase in costs saw shares trade sideways for almost a decade, dragging the company’s valuation well below peers such as Axa and Allianz. The performance has been increasingly frustrating for investors, given that it remains a dominant, high-quality business at its core, particularly in the UK where its composite insurance model provides a strong competitive advantage.
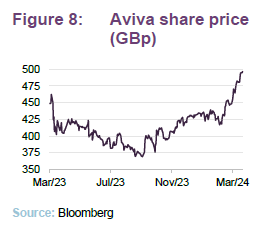
Over the years, there have been several attempts to leverage this strength, with various strategic reviews and structural overhauls; however, these have failed to have a lasting impact, at least until recently. In 2020, the company appointed Amanda Blanc as chief executive, in a move which accelerated a push to streamline operations and focus more on its core assets in the UK, Ireland, and Canada. This has led to a raft of foreign asset sales, including businesses in Singapore, Italy, and France. Additional shareholder friendly interventions from active investor Cevian Capital have helped drive cost cutting measures and shareholder returns, with the company delivering on its £750m cost reduction target a year ahead of schedule while returning over £5bn to shareholders.
Investors have remained sceptical, having seen the company over-promise and underdeliver in the past. However, the shares have tacked steadily upwards in recent months, with the company delivering on its commitment to drive sales growth, cut expenses, and increase shareholder payouts. This momentum will need to be sustained if the company is to recover the ground lost over the last few years, although as the TMPL managers have identified, the outlook for the stock looks increasingly positive, underpinned by a dividend yield which now sits at 8%.
Stellantis
A recent addition to the portfolio that now sits in the top 10 holdings is Stellantis, a company formed by the merger of Fiat Chrysler and Peugeot in 2020. The rationale for the merger was to combine the European strength of the Peugeot business with the North American strength of Fiat Chrysler. So far, this has proven to be a resounding success, with the company going from strength to strength, particularly over the past 12 months. with shares up 86%, surpassing rival Volkswagen in market cap in the process. The performance of Stellantis is particularly notable given the current challenges faced by the auto industry, which include technological uncertainty, deglobalisation, geopolitics (particularly relating to demand in China), and supply chain upheaval stemming from the pandemic.
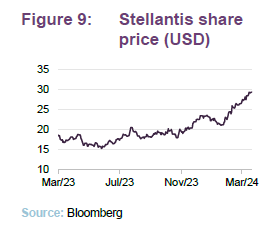
In what is clearly a recurring theme among the new positions in the TMPL portfolio, reflecting the managers’ approach to identifying opportunities to unearth long-term value, Stellantis has successfully emerged from its strategic overhaul with a focus on optimising margins and achieving operational efficiencies. Combining the entities has allowed for significant cost savings and created a larger and more diversified business. A strong balance sheet with around €30bn of net cash provides ample financial flexibility, which is boosted further by solid free cash flow growth. The company’s financial stability was reinforced during its recent annual results, with a 53% increase in shareholder returns from 2022 (including dividends and buybacks totalling €6.6bn) in addition to a proposed dividend increase of 16%.
Notably, the company has not rushed into the EV race to the same extent as some of its rivals, choosing to focus on the consolidation of its existing markets and a more diversified approach to investment across electric, hybrid and ICE vehicles. For the moment, this has proven to be a winning strategy given the slowing adoption of EVs and the intense competition and tight margins that exist in the current market.
There certainly remain challenges, both for the overall automotive industry and internally at Stellantis as the company manages the ongoing integration of its French, Italian, German and US operations. However, with the company still trading on an earnings multiple under five, despite the recent rally in shares, the risk certainly appears weighted to the upside.
NN Group
Continuing the theme of structural overhauls is NN Group, the Dutch insurer which was spun off from ING following the financial crisis. The foundations for it to become a dominant player in the European insurance market had been set back in 2016 following a spate of investment activity totalling around €3bn with the acquisition of domestic rival Delta Lloyd, and Vivat’s general insurance arm. Much like Aviva, however, the company has faced criticism for its lack of strategic direction and overall conservatism. This prompted well-known activist investor Elliott Advisors to take a 3% stake back in 2020, with a focus on cost-cutting, the disposal of non-core businesses, and an overhaul of its investment portfolio.
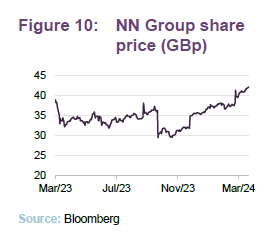
The more targeted approach driven by Elliott in combination with an increasingly stable domestic position in the Netherlands helped drive a solid period of outperformance for the company following the pandemic. Despite this, the transition remains a work in progress, with improving operational performance yet to make up for a long period of mediocrity.
Still, the outlook continues to improve as the company accelerates its shift towards more shareholder-friendly policies, including an increased focus on buybacks, and a progressive dividend policy with the latest earnings announcement highlighting a 15% increase in dividend payments and an annual share buyback allocation of at least €300m, up from €250m in 2023. The company has also remained active in its efforts to streamline operations, with the recent sale of its asset-management business to Goldman Sachs and the acquisition of MetLife’s businesses in Poland and Greece further cementing its competitive position in life insurance and pension products across Europe.
Operational performance has also continued to improve, with the company announcing that operating capital generation (a key profitability metric for insurance companies) for 2023 was up 13%, exceeding the 2025 target of EUR 1.8bn well ahead of plan. The positive results have helped build on the company’s steadily improving share price, and with its long-running structural overhaul now appearing to flow through to the bottom line, its price to book value of just 0.59 – which remains well below peer group averages – looks increasingly attractive.
GSK
Closing out the new additions to the top 10 holdings is GSK, the British multinational pharmaceutical and biotechnology company. GSK has struggled with a range of issues over the last few years, including impending patent expiries – most notably HIV medicine Dolutegravir, which contributes almost 20% of total revenue. A lack of confidence in the company’s pipeline to offset these changes has seen its shares underperform both peer group and broader market benchmarks in recent times. This has been compounded further by ongoing litigation related to the now-discontinued heartburn drug, Zantac, once the world’s bestselling medicine, which is claimed to have caused cancer.
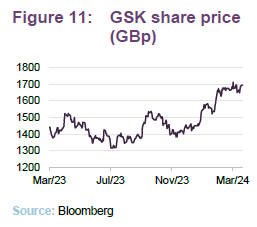
Positively, the company has already settled numerous lawsuits in the US and continues to accept no liability, which has been supported by federal level hearings, based on a lack of credible scientific evidence. Despite this, the market appears to have priced in an almost worst-case scenario relating to the lawsuits, providing significant room for a re-rating going forward.
The overhang from the Zantac case also appears to have distracted from an increasingly positive outlook for the company’s pipeline, following a significant transformation to address its growth concerns. In 2022, GSK spun off its consumer health unit to help fund an aggressive M&A strategy which saw five deals completed over 2023, with the same number planned for 2024. Recent performance has also been promising, with the company outperforming expectations for 2023, while increasing its 2024 forecasts on the back of strong momentum from its vaccine and cancer drugs.
With improving fundamentals and the overhang from the Zantac case receding, we expect there could be considerable upside at current prices, particularly given a an earnings multiple almost 50% below peer group averages.
Takeover targets
The managers also noted in February 2024 that two of the company’s holdings were approached for a possible takeover, Currys and Direct Line Group. This stands as further evidence that the largest market participants in the UK have been allocating away from UK equities, which are close to all-time low valuations, and therefore should have the potential to offer attractive returns. Ian and Nick believe that this has resulted in pockets of the UK equity market being valued significantly below the true value of the businesses, which they believe has led to a number of overseas corporate buyers stepping in to take advantage of the depressed valuations of UK equities.
Performance
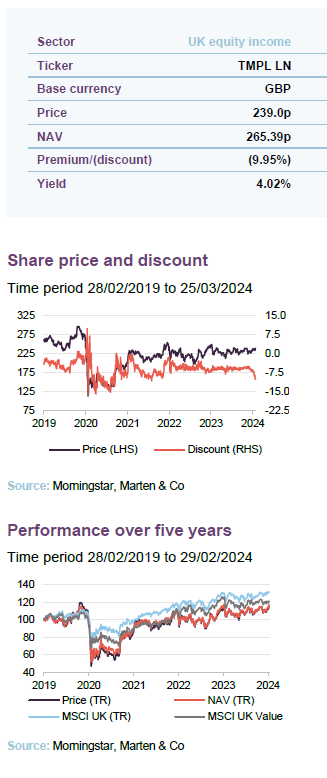
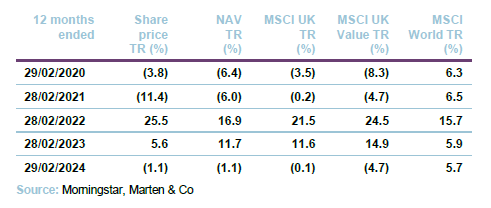
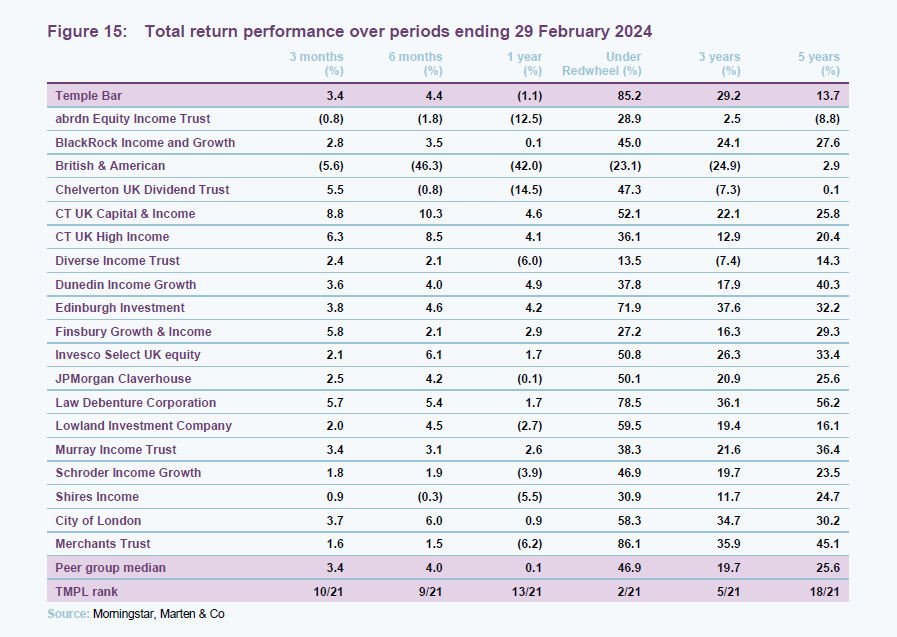
The performance of the TMPL portfolio under Redwheel remains impressive, despite some recent challenges, with the NAV total return of the trust up 85.2% since its appointment in November 2020, almost double the peer group’s median return.
Whilst the new managers benefitted initially from a degree of timing, with their appointment coinciding with a rally in value orientated sectors of the market, the strategy since the takeover has continued to add value, even over the relatively short period of time that the managers have been in charge. Most recently, substantial positions in Stellantis and Barclays have been key contributors.
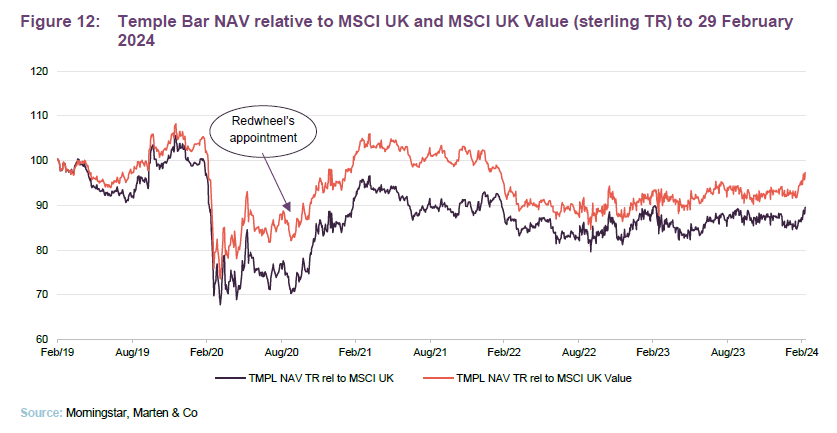
The portfolio has struggled over the last 12 months, with over 70% invested in the UK, which continues to battle with slowing growth and high inflation. However, we have seen a solid inflection over the last few weeks, highlighted in Figure 14, and as we have discussed over the course of this note, the outlook for the trust is looking increasingly positive.
With the previous manager’s deep value proposition, TMPL’s long term NAV performance has struggled versus its peers (see Figure 15 on page 14). With just over three years at the helm, it still remains early in the innings for the new managers, but given their long-term strategy, investors may be encouraged by the initial performance of the portfolio and the clear strategy that Ian and Nick have implemented.

Peer group
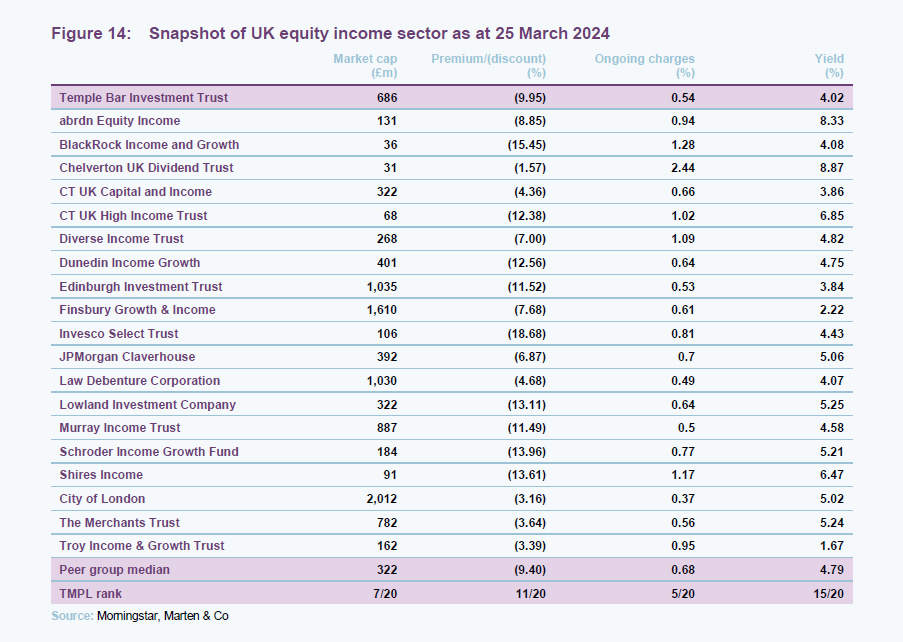
TMPL is one of 20 funds in the AIC’s UK equity income sector. With a market cap of £686m, it is one of the larger funds within the peer group and this is a factor in its competitive ongoing charges ratio. At 0.54%, it is the fifth-lowest in the sector and is below the sector median of 0.66%.
Discounts have continued to widen since our last note, reflecting the broader challenges faced by the UK market with TMPL’s discount in line with the median. A dividend yield of 4% puts the company toward the bottom of the peer group and the managers have noted the strong earnings yield of the portfolio and the potential for this to flow through to improved shareholder returns going forward. Notably, the dividend yield has grown considerably over the last couple of years, and we expect this momentum will continue.
Dividend
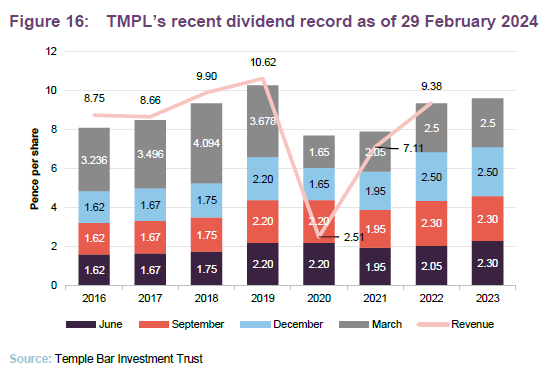
TMPL pays dividends quarterly. As touched on in our last note, the company’s income account has been more robust than expected. As a result, the company paid out a total dividend of 9.6p per share for the year ended 31 December 2023. The board has also noted that it is confident the dividend will increase from this level over time. As publishing TMPL had a TTM yield of 4.02%.
Premium/(discount)
Over the last 12 months TMPL’s shares moved to trade between a discount of 8.1% and 4.7%, averaging 5.9%. As of publishing, the company was trading on a discount of 9.95%.
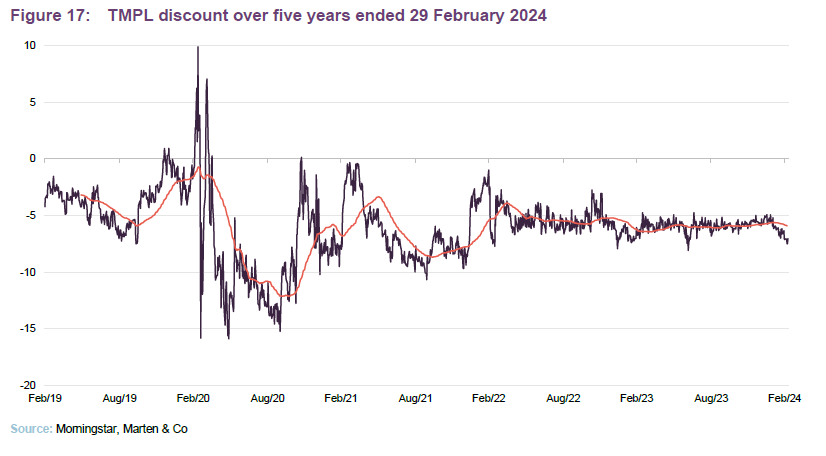
The discount has been relatively stable over the past year, although a recent positive inflection in NAV has not resulted in a corresponding move in the share price, which has led to it widening. The board continue to proactively use buybacks to defend a sensible level of discount on the trust. As of 26 March 2024, the issued share capital of the company was 334,363,825 ordinary shares, of which 47,244,258 shares are held in treasury.
Fund profile
You can access the trust’s website at: templebarinvestments.co.uk
TMPL aims to provide growth in income and capital to achieve a long-term total return greater than its benchmark (the FTSE All-Share Index), through investment primarily in UK securities. The company’s policy is to invest in a broad spread of securities with typically the majority of the portfolio selected from the constituents of the FTSE 350 Index.
Co-managers Nick Purves and Ian Lance aim to rotate the portfolio into those companies which they believe are available at a significant discount to intrinsic value. This involves buying the shares of attractively valued, out-of-favour companies and holding them for the long term until their share prices more appropriately reflect their true value, or until even more attractive ideas present themselves.
Redwheel became manager of TMPL on 1 November 2020
After 18 years under its previous manager, on 23 September 2020 the board announced that it had selected RWC Asset Management (which rebranded as Redwheel in 2022) as TMPL’s new investment manager. Redwheel took on responsibility for the portfolio with effect from 1 November 2020, with Nick and Ian named as co-managers. They have over 50 years’ experience between them and have worked together for more than 13 years. The two co-manage over £3bn of assets across a number of income funds. As of 1 July 2023, TMPL’s AIFM transferred from Link Fund Solutions to Frostrow Capital.
Previous publications
Readers interested in further information about TMPL may wish to read our previous note, True Colours, published on 26 June 2023, as well as our previous notes (details are provided in Figure 18 below). You can read the notes by clicking on them in Figure 18 or by visiting our website.
Figure 18: QuotedData’s previously published notes on TMPL
| Title | Note type | Date |
| Keeping faith | Initiation | 23 September 2020 |
| Just getting started | Update | 23 April 2021 |
| No compromise | Annual overview | 8 December 2021 |
| Time to Shine | Annual overview | 31 August 2022 |
| True Colours | Update | 26 June 2023 |
Source: Marten & Co
IMPORTANT INFORMATION
This marketing communication has been prepared for Temple Bar Investment Trust Plc by Marten & Co (which is authorised and regulated by the Financial Conduct Authority) and is non-independent research as defined under Article 36 of the Commission Delegated Regulation (EU) 2017/565 of 25 April 2016 supplementing the Markets in Financial Instruments Directive (MIFID). It is intended for use by investment professionals as defined in article 19 (5) of the Financial Services Act 2000 (Financial Promotion) Order 2005. Marten & Co is not authorised to give advice to retail clients and, if you are not a professional investor, or in any other way are prohibited or restricted from receiving this information, you should disregard it. The note does not have regard to the specific investment objectives, financial situation and needs of any specific person who may receive it.
The note has not been prepared in accordance with legal requirements designed to promote the independence of investment research and as such is considered to be a marketing communication. The analysts who prepared this note are not constrained from dealing ahead of it, but in practice, and in accordance with our internal code of good conduct, will refrain from doing so for the period from which they first obtained the information necessary to prepare the note until one month after the note’s publication. Nevertheless, they may have an interest in any of the securities mentioned within this note.
This note has been compiled from publicly available information. This note is not directed at any person in any jurisdiction where (by reason of that person’s nationality, residence or otherwise) the publication or availability of this note is prohibited.
Accuracy of Content: Whilst Marten & Co uses reasonable efforts to obtain information from sources which we believe to be reliable and to ensure that the information in this note is up to date and accurate, we make no representation or warranty that the information contained in this note is accurate, reliable or complete. The information contained in this note is provided by Marten & Co for personal use and information purposes generally. You are solely liable for any use you may make of this information. The information is inherently subject to change without notice and may become outdated. You, therefore, should verify any information obtained from this note before you use it.
No Advice: Nothing contained in this note constitutes or should be construed to constitute investment, legal, tax or other advice.
No Representation or Warranty: No representation, warranty or guarantee of any kind, express or implied is given by Marten & Co in respect of any information contained on this note.
Exclusion of Liability: To the fullest extent allowed by law, Marten & Co shall not be liable for any direct or indirect losses, damages, costs or expenses incurred or suffered by you arising out or in connection with the access to, use of or reliance on any information contained on this note. In no circumstance shall Marten & Co and its employees have any liability for consequential or special damages.
Governing Law and Jurisdiction: These terms and conditions and all matters connected with them, are governed by the laws of England and Wales and shall be subject to the exclusive jurisdiction of the English courts. If you access this note from outside the UK, you are responsible for ensuring compliance with any local laws relating to access.
No information contained in this note shall form the basis of, or be relied upon in connection with, any offer or commitment whatsoever in any jurisdiction.
Investment Performance Information: Please remember that past performance is not necessarily a guide to the future and that the value of shares and the income from them can go down as well as up. Exchange rates may also cause the value of underlying overseas investments to go down as well as up. Marten & Co may write on companies that use gearing in a number of forms that can increase volatility and, in some cases, to a complete loss of an investment.

