Difficult conditions make for better vintages
Patria Private Equity (PPET) has been able to build up an enviable long-term track record, with returns towards the top end of peer group tables and well-ahead of equivalent listed equities.
It is clear that PPET’s bias to European mid-market deals has served it well despite lacklustre economic growth in the region. It is also providing investors with an attractive and growing dividend.
However, more recently, PPET and the wider private equity sector have lagged listed equities. We feel that reflects a more difficult period in private markets for exits (selling portfolio companies and returning capital to their investors) rather than anything untoward within the portfolio. As evidence of this, the underlying companies appear to be trading fairly well, with EBITDA earnings growth of 21% over the 12 months ended 31 March 2025.
History suggests that years in which there are adverse conditions within the private equity sector tend to coincide with the most lucrative vintages (the year in which an investment fund, such as a private equity or venture capital fund, makes its first investment or is launched), as the competition for new deals is less intense; 2023–25 may be one of those periods.
Private equity fund of funds with a European bias
PPET aims to achieve long-term total returns through a diversified portfolio of leading private equity funds and direct investments, the majority of which will have a mid-market European focus.
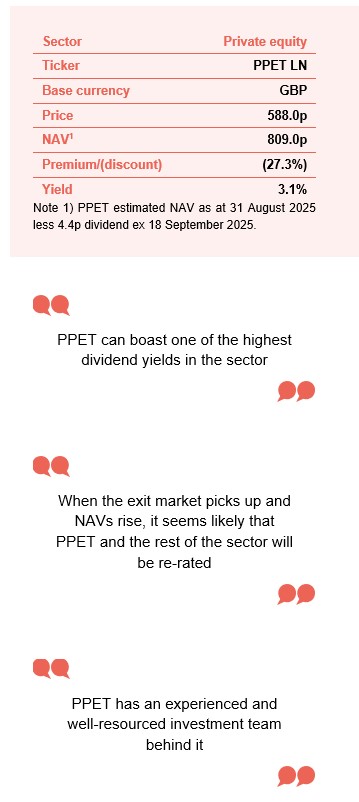
At a glance
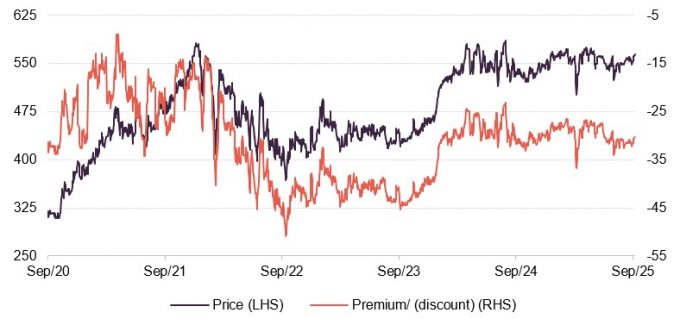
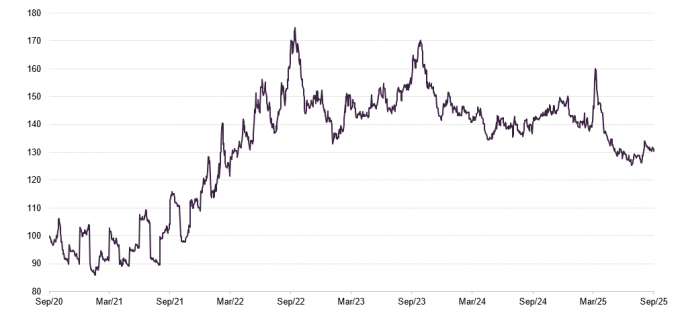
Share price and discount
Over the 12 months ended 30 September 2025, PPET’s discount moved within a range of 26.5% to 36.7% and averaged 29.9%. As at 22 October 2025, the discount was 27.6%.
PPET’s discount does appear to have stabilised since the first quarter of 2024. In part, this reflects the trust’s share buyback activity, which is shown in Figure 19 on page 19.
Time period 30 September 2020 to 22 October 2025
Source: Bloomberg, Marten & Co
Performance over five years
As per PPET’s most recent announcement, it reported an estimated NAV per share of 813.4p and total NAV of £1,210.1m, as of 31 August 2025. The month on month rise in PPET’s NAV of 2.9% in constant currency terms over August reflects the shift from a NAV based mostly (95.1%) on 31 March valuations as at the end of July to one based mostly (98.8%) on 30 June valuations.
Time period 30 September 2020 to 30 September 2025
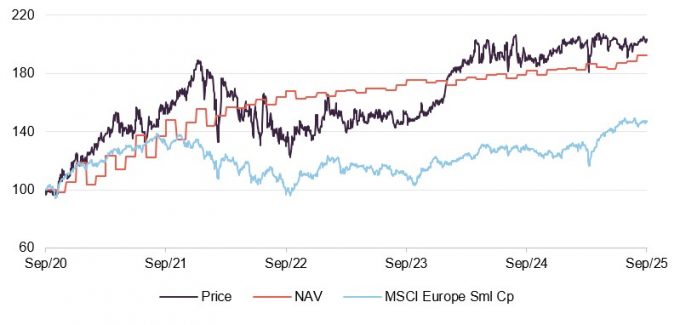
Source: Bloomberg, Marten & Co
| Year ended | Share price total return (%) | NAV total return (%) | MSCI Europe Small Cap TR (%) | LPX Europe total return (%) |
|---|---|---|---|---|
| 30/09/2021 | 60.6 | 48.0 | 31.4 | 49.2 |
| 30/09/2022 | (15.1) | 13.4 | (24.9) | (34.6) |
| 30/09/2023 | 11.7 | 2.5 | 12.9 | 8.2 |
| 30/09/2024 | 24.9 | 5.6 | 16.1 | 23.9 |
| 30/09/2025 | 7.0 | 5.9 | 14.2 | 0.1 |
Fund profile
Read more about the trust onits website: www.patriaprivateequitytrust.com
The private equity sector has an enviable long-term track record and PPET is no exception to this. However, most investors cannot access the asset class directly. Listed private equity vehicles such as PPET allow anyone to gain exposure to private equity through a liquid listed vehicle that can be bought and sold on a daily basis.
PPET’s particular focus is on leading private equity funds and private companies in Europe. It makes primary commitments to and secondary purchases of private equity funds (mostly limited partnership vehicles, “LPs”), and it also makes “direct” investments into private companies via co-investments and single-asset secondaries.
Mid-market deals consistently outperform large and mega-cap LBOs
The underlying companies that PPET backs tend to be growing, cash generative businesses in the mid-market range (companies with an enterprise value (EV) of €100m–€1bn). Patria says that the returns on these deals tend to beat market averages. It quotes an InvestEurope report that said mid-market deals consistently outperform large and mega-cap LBOs, delivering a 16.9% IRR (internal rate of return) versus 14.8%, and a 1.8x TVPI (total value to paid-in) versus 1.7x. Patria also observes that there is a deeper pool of potential investments than in the large cap segment, entry prices tend to be lower, there are more opportunities to create value, and there is greater optionality around exits for firms of this size.
Investing alongside 15 core managers
Readers interested in PPET’s investment process should see our February 2025 annual overview note, which describes this in more detail. However, to summarise, the manager tends to build a portfolio of core underlying managers (there are currently 15 of these) whom it knows and trusts and has established relationships with over many years. This is complimented by exposure to direct investments and secondaries.
The trust was launched in 2001 as Standard Life Private Equity and has also been known as abrdn Private Equity Opportunities. In April 2024, Aberdeen Group Plc sold its European private equity business to Patria Investments and the company changed its name once more. The senior team managing the portfolio, led by Alan Gauld, was unchanged, but it now benefits from the greater resources that Patria can offer. Patria Investments has assets under management (AUM) of about $50bn.
Market update
It had been hoped that the slowdown in M&A activity that followed the advent of higher interest rates in 2022 was beginning to reverse. However, the uncertainty created by US trade policy in the first half of 2025 effectively caused M&A processes to stall or be postponed.
Exits are being achieved but volumes are down on prior years
Over 2024, the value of deals transacted by European private equity rose, but the number of deals remained below long-term averages. With IPO markets weak, most exits have been via trade sales and secondary buyouts, albeit these are the two main exit routes from mid-market companies.
Patria notes that the secondary market has been particularly strong. As part of this, we have seen an increasing role for continuation funds (acquires one or more portfolio companies from an existing fund nearing the end of its life, allowing current investors to either cash out or roll their investment into the new fund for continued exposure). This has sparked some debate in the media about the quality of these transactions. The managers have pushed back on this. They say that continuation vehicles are an ideal way to retain exposure to a company that has great potential but has outgrown a manager’s limited partnership (LP) vehicles.
Fundraising by European buyout firms has hit a six-year low
According to InvestEurope, fundraising by European buyout firms hit a six-year low of €75bn in 2024. However, in less-crowded markets, the deals that do get done often turn out to be more lucrative, so this may not be a bad thing. The chair observed in his statement in June 2025 that there was $1.2trn of dry powder (readily available capital that investors, such as private equity, have on hand to deploy into new investment opportunities) in the buyout market, some of which will need to be deployed soon. This could help fuel a market recovery when sentiment improves.
Figure 1: MSCI Europe and MSCI Europe Small Cap total return
Figure 2: EU interest rates
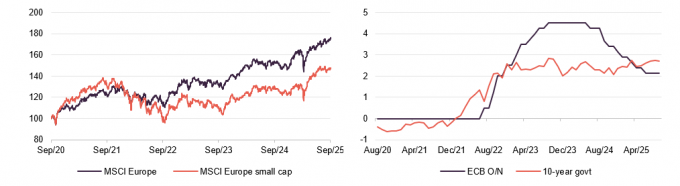
Source: Bloomberg, Marten & Co
Source: Bloomberg, Marten & Co
US tariff policy has probably been the dominant influence on markets so far this year. In its half-year results, PPET disclosed that an analysis of its 100 largest portfolio companies suggested that just 9% of these were potentially impacted by tariffs and just 1.6% of this part of the portfolio was potentially impacted significantly.
European listed markets have been making progress since Liberation Day
“Liberation Day” in April triggered a sharp setback but EU equity markets have been making progress since then. In July, the EU agreed to 15% tariffs on goods entering the US. Talk has been growing that investors are looking to diversify away from US investments, and Europe has been a beneficiary of this. It helps that EU inflation appears to be under control and this has allowed the ECB to cut rates. 10-year bond yields have edged up, but are a lot lower in the EU than in the US and UK.
One significant boost to sentiment was the announcement of a German plan to significantly expand defence and infrastructure spending, including the creation of a new €500bn infrastructure investment fund and a relaxation of borrowing rules. More recently, the collapse of the French government and a downgrade of France’s credit rating have dampened enthusiasm.
Asset allocation
As of 31 March 2025, 65% of the fund’s NAV was invested in LPs managed by 15 core European private equity managers, which comprise the “primaries” component of the portfolio. This number and allocation weight have increased since our last note, at the expense of PPET’s exposure to secondaries.
Figure 3: PPET’s evolving portfolio
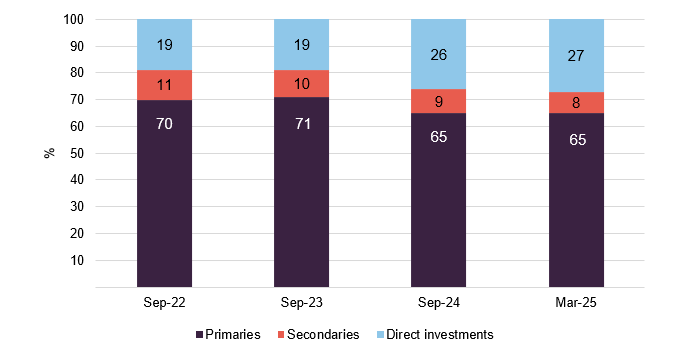
Source: PPET
Broad private equity exposure
As at 31 March 2025, PPET’s portfolio was valued at £1,214m. It provided exposure to around 630 underlying companies, with a continued focus on mid-market investments. Large-cap exposures tend to represent companies that have grown into this bracket.
Figure 4: NAV split by size at 31 March 2025
Figure 5: NAV split by investment type at 31 March 2025
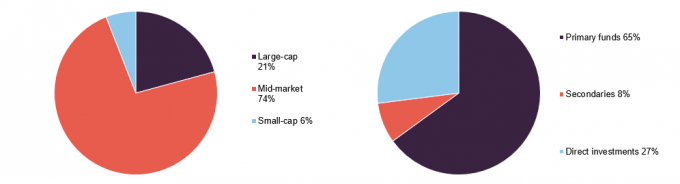
Source: PPET
Source: PPET
At the end of March 2025, in the primary funds portion of the portfolio PPET had exposure to funds managed by 15 leading private equity managers: Advent International, Altor, Archimed, Bowmark Capital, Capiton, Hg, IK Partners, Investindustrial, Latour Capital, Montefiore Investment, Nordic Capital, One Peak, PAI Partners, and Triton Partners. Patria observes that over 70% of the funds managed by these managers fell into the first or second quartile of funds when ranked by performance.
Figure 6: Sectoral exposure (%), 31 March 2025
Figure 7: Geographic exposure (%), 31 March 2025
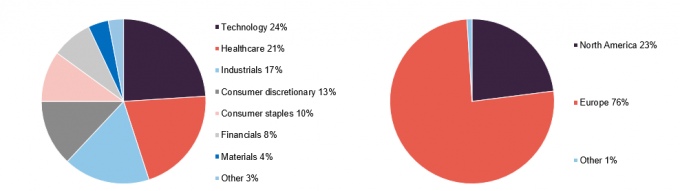
Source: PPET
Source: PPET
Top 10 fund exposures
Short-term changes to fund allocations tend to be driven by realisations, the pace of reinvestment, and the frequency of revaluation by the underlying managers. Reflecting the managers’ long-term fund-of-funds approach, the names of most of the underlying managers and their funds will be familiar to followers of the trust and regular readers of our notes on PPET.
There are four new names in the top 10 since our last note: IK Partnership II, IK Fund IX, American Industrial Partners VII, and Vitruvian IV. They replace CVC Capital Partners VII, Exponent III, Capiton VI, and HgCapital 8.
American Industrial Partners (AIP) is a New York based firm that primarily invests in mid-market (EV up to $2bn and EBITDA up to $350m at the time of investment) industrial businesses in North America, with current assets of more than $16bn. AIP’s edge comes from its ability to leverage its in-house operational and engineering knowledge to improve its investee companies. Rather than take a day-to-day role in their management, it instead offers financial support and industrial knowledge to its investee companies to help their management teams create value.
American Industrial Partners Fund VII launched in 2019, and was oversubscribed, hitting its $3bn launch target. At the end of March 2025, the fund held 17 companies. PPET still had an outstanding commitment of £2.56m to the fund at this point.
Vitruvian Investment Partners is a global private equity firm, with a focus on growth buyouts and providing growth capital investments which typically target mid-market companies. The most common value-add achieved by the firm is expanding the global presence of European companies. The Vitruvian IV fund focused on high-growth opportunities within Europe and was oversubscribed at launch, hitting its hard cap of €4bn in less than three months, and becoming 40% larger than its predecessor. As a testament to the demand for Vitruvian’s funds, the successor fund, Vitruvian V (which PPET also invested in), closed at €7.3bn.
Figure 8: 10-largest private equity funds, as at 31 March 2025
| Fund name and vintage | Strategy | Geography | Value 31/03/25£m* | Value 30/09/24£m* | % of NAV 31/03/25 | % of NAV 30/09/24 | NAV change (%) | Net mult.131/03/25 | Net mult.130/09/24 |
|---|---|---|---|---|---|---|---|---|---|
| Nordic Capital Fund IX (2018) | Complex buyouts global healthcare | Northern Europe | 36.2 | 35.3 | 3.0 | 3.0 | – | 1.7x | 1.7x |
| Structured Solutions IV Primary Holdings (2021) | Various | Europe & North America | 34.0 | 32.8 | 2.8 | 2.8 | – | 1.3x | 1.3x |
| Altor Fund IV (2014) | Nordic Middle Market | Northern Europe | 31.2 | 34.4 | 2.6 | 2.9 | (0.3) | 1.7x | 1.7x |
| Altor Fund V (2019) | Nordic Middle Market | Northern Europe | 30.7 | 28.2 | 2.6 | 2.4 | 0.2 | 1.4x | 1.3x |
| PAI Europe VII (2098) | Upper mid-market buyouts | Western Europe | 29.8 | 29.5 | 2.5 | 2.5 | – | 1.5x | 1.5x |
| Triton Fund V (2019) | Mid-market buyouts | Northern & Western Europe | 29.0 | 26.2 | 2.4 | 2.4 | – | 1.5x | 1.5x |
| American Industrial Partners VII (2019) | Industrials buyout | North America | 25.8 | 23.0 | 2.2 | 1.9 | 0.3 | 1.7x | 1.6x |
| IK Partnership II (2021) | Mid-market buyouts | Northern Europe | 25.3 | – | 2.1 | – | 2.1 | 1.2x | n/a |
| IK Fund IX (2020) | Mid-market buyouts | Northern Europe | 25.2 | 24.3 | 2.1 | 2.0 | 0.1 | 1.2x | 1.2x |
| Vitruvian IV (2020) | Mid-market buyouts | Northern Europe | 24.8 | 22.7 | 2.1 | 1.9 | 0.2 | 1.3x | 1.2x |
| Total of top 10 | 24.4 |
New fund commitments
Over the six months to end March, PPET made four new fund commitments, Impilo Fund II, Nordic Capital Evolution Fund II, IK Small Cap Fund IV, and IK Partnership Fund III, for a total commitment of £80.9m.
- Impilo is a Stockholm-headquartered firm, established in 2017 by Fredrick Strömholm – a co-founder of Altor, one of PPET’s core fund managers. Impilo invests exclusively in the Nordic healthcare sector, investing in lower-mid-market companies (its target companies have enterprise values of €50m–€200m) across pharmaceuticals, medtech, specialist pharma services, and other healthcare and related services industries. One key objective is that investee companies should be capable of doubling their operating profit over five years, and outgrow their respective markets. The Impilo Fund II was the first investment PPET made with Impilo.
- Nordic Capital is a Stockholm-headquartered firm that mainly invests in mid-market opportunities across Northwest Europe and North America. Nordic Capital invests in five sectors/sub-sectors in which its management believes it has an edge: healthcare, technology and payments, financial services, and services and industrial technology. Since its inception, Nordic Capital’s portfolio companies have averaged 17% annual EBITDA growth and 10% annual sales growth.
- IK Partners is another leading mid-market firm, based in the UK but targeting European companies, with a preference for companies based in Northwest and Central Europe. Its portfolio companies typically operate in four sectors: business services, healthcare, consumer, and industrial.
Since the end of March 2025, PPET has made:
- A commitment of €30.0m to Latour Small Cap I, a lower-mid-market buyout fund (acquires controlling stakes in established companies, with the aim of improving performance and later selling the business at a profit) which focuses principally on French headquartered companies in business services and industrial sectors;
- A primary commitment of $25.0m to Hg Saturn 4, a buyout fund focused on software and tech-enabled services;
- A €30m primary commitment to GEM Benelux VI, a buyout fund with a focus on lower-mid-market companies operating in the Benelux region; and
- A €30.0m primary commitment to PAI Mid-Market II, a buyout fund with a focus on lower mid-market companies across Europe in the food and consumer, healthcare, and business services sectors.
Other commitments
PPET committed £38.8m towards a new secondary investment, the Patria SOF V SCSp fund – which targets secondary transactions in the private equity lower-mid and upper mid‑markets across Europe and North America. To avoid the double counting of fees, PPET will exclude the investment in Patria’s SOF V fund when calculating PPET’s management fee.
PPET also made a €14.0m secondary investment alongside AgilaCapital into two technology businesses, which cannot be disclosed at present for confidentiality reasons.
Then, in July, PPET made a €10.0m commitment to Iron Institutionals AgilaCapital, a continuation fund investing in an undisclosed e-procurement software business, alongside AgilaCapital.
Underlying holdings
Figure 9: 10 largest underlying holdings, as at 31 March 2025
| Company | Business | Fund | % of NAV 31 Mar 25 | % of NAV30 Sep 24 | % change |
|---|---|---|---|---|---|
| Action | Consumer staples – non-food discount retailer | Co-investment | 2.5 | 2.4 | 0.1 |
| Visma | Technology – enterprise resource planning | Direct | 2.1 | 1.9 | 0.2 |
| European Camping Group | Consumer discretionary – campsite manager | Co-investment | 2.0 | 2.0 | – |
| Wundex | Healthcare – home-based treatments | Direct | 1.9 | 2.1 | (0.2) |
| NAMSA | Healthcare – medical device provider | Direct | 1.6 | 1.5 | 0.1 |
| Uvesco | Consumer staples – Spanish food retailer | Direct | 1.6 | 1.5 | 0.1 |
| Froneri | Consumer staples – ice cream maker | PAI Strategic Partnerships | 1.5 | 1.5 | – |
| CDL Nuclear Technologies | Healthcare | Direct | 1.5 | 0.8 | 0.7 |
| CFC Underwriting | Industrials/B2B Services – Insurance software and underwriting | Direct | 1.4 | 1.4 | – |
| access | Technology – enterprise resource planning | Hg Genesis 8 | 1.4 | 1.7 | (0.3) |
| Total of top 10 | 13.9 |
At the end of March 2025, the 100 largest underlying companies accounted for 62.6% of PPET’s portfolio. The median valuation multiple (EV/EBITDA) of these companies was 13.8x. The median leverage multiple (debt/EBITDA) was 3.8x (indicating the extent to which a company is financed by debt relative to earnings). The average revenue growth over the last 12 months was 15.0% and the average EBITDA growth over the same period was 21.0%.
Since we last published, using data as at the end of September 2024, there has been one new entrant into the top 10; CDL Nuclear Technologies, which replaced Gritec.
CDL Nuclear Technologies is a US-based provider of advanced cardiac imaging and scanning devices. PPET initiated its position in 2021 alongside the US-based Excellere Partners, which counts the healthcare sector as one of its three areas of expertise. CDL says that its solutions allow healthcare professionals access to molecular imaging technology that facilitates greater diagnostic precision, higher-quality care, and mitigates utilisation of higher-risk, and otherwise unnecessary, invasive procedures.
Gritec is a manufacturer of turnkey substations used in Germany, which was held in Capiton VI. It was acquired by Viessmann Generations Group in October 2024.
New direct investments
Over the six months ended 31 March 2025, PPET made two new direct investments, and one follow-on direct investment.
Figure 10: PPET co-investments over the six months to 31 March 2025
| Co-investment name | Investment £m | Company description |
|---|---|---|
| Agora Makers | 7.7 | A leading specialist in the design and manufacture of public street lighting and street furniture based in France. Investment alongside Hivest Capital Partners. |
| Soleo Health | 5.3 | US headquartered business that provides comprehensive infusion and specialty pharmacy services covering a broad range of disease states, with a focus on chronic and complex conditions. Investment alongside Windrose Health Investors. |
| Boost.ai (follow-on-investment) | 4.0 | A global leader in conversational AI for Fortune 1000 companies. Investment alongside Nordic Capital. |
Agora Makers is a designer and manufacturer of public street lighting and street furniture, based in France. It offers a diverse range of products, from recreating traditional designs to producing smart lighting and public-use gym equipment. Agora’s products can be found in over 4,000 cities worldwide. The PPET team notes that Agora is well positioned to capitalise on the need for more public spaces, and the proliferation of smart cities.
PPET initiated its position in Agora in December 2024, investing in a continuation fund as part of a transaction co-led by Patria. Patria made its investment alongside Hivest Capital Partners, Agora’s previous majority shareholder, which sold part of its stake while establishing the single-asset continuation fund. Since Hivest made its initial investment in 2022, Agora’s EBITDA has increased by 150%, thanks to both strong organic growth and successful acquisitions.
Since the end of March 2025, PPET has also made a €6.0m direct investment alongside Latour Capital into Rollakin, a leading French company specialising in the online distribution of mechanical transmission parts, a €10m direct investment along-side PAI MMF I into Vamed Care, a provider of essential rehabilitation services to over 100,000 patients in Germany, Austria, Switzerland, and the Czech Republic, and a $7m commitment (made alongside Seidler Equity Partners) to fund a youth development business.
Drawdowns and distributions
Figure 11: Drawdowns by source, six months to 31 March 2025
Figure 12: Distributions and secondary sales, six months to 31 March 2025
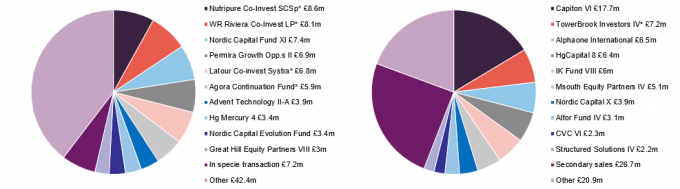
Source: PPET, Note * indicates direct investments
Source: PPET, Note * indicates direct investments
Drawdowns post end March 2025
Figures 11 and 12 show the drawdowns and distributions for PPET over the six months to end March 2025, as detailed in its interim report. Since then:
Over April 2025, PPET received £8.0m of distributions and paid £4.7m of drawdowns to existing investments and £2.0m to new investments.
Notable drawdowns in the portfolio during the month included:
- Hg Mercury 4 (£1.8m): to fund a new investment into Cube Global (regulatory intelligence software provider, primarily servicing large financial institutions);
- IK X (£1.4m): primarily to fund a repayment to its loan facility and further investment into Eurofeu (produces, markets, installs, and maintains fire safety equipment and systems).
Notable realisations in the portfolio during the month included the exits of:
- Summit Spine & Joint Centers (provider of interventional pain management services in Georgia and North Carolina) by MSouth Equity Partners;
- RENK Group AG (supplier of mechanical drive technology for vehicle transmissions) by Triton Fund V; and
- Marshall Group AB (audio tech brand headquartered in Stockholm, Sweden) by Altor Fund VI.
In May: PPET paid £10.8m of drawdowns to existing investments and £5.1m to new investments, whilst receiving £6.5m of distributions.
Notable drawdowns in the portfolio during the month included:
- Arbor VI (£3.5m): to fund a new investment into Rubix (a food ingredient and innovation company that specialises in flavour and functional solutions for restaurants and food manufacturers); and
- Bowmark VII (£2.6m): to fund a follow-on investment into Eque2 (providing fully integrated cloud solutions to manage end to end lifecycle of construction projects).
Notable realisations in the portfolio during the month included the partial or full exits of:
- Max Matthiessen (leading financial advisors within pensions, insurance, and investments in the Nordic Region) by Nordic Capital Fund IX; and
- CDL Holdings Company LLC (provider of cardiac and high energy PET radioisotope delivery solutions to independent practices and hospitals) by Excellere Partners Fund IV and from PPET’s direct investment position.
In June: PPET paid £25.8m of drawdowns to existing investments and £8.6m towards new investments, whilst receiving £25.8m of distributions.
Notable drawdowns in the portfolio during the month included:
- PAI Mid-Market Fund: investment in Beautynova (provider of haircare products) and Nutripure (provider of health and wellness products);
- Latour Capital IV: investment in Lynxeo (designer, producer and supplier of cable solutions for critical infrastructure projects); and
- Investindustrial Growth III: to fund new investment into Delta Tecnic (formulates and produces tailor-made colour and additives masterbatches for a variety of industries).
Notable realisations included:
- a partial exit of PPET’s direct investment in European Camping Group (leader in outdoor accommodation operating in over 10 European countries), as well as the position held through the PAI Europe VII fund; and
- full exit of Kereis (provider of insurance brokerage services for insurers and banking partners) by Bridgepoint Europe VI.
In July: PPET had £21m of drawdowns and £11.1m of distributions.
Notable drawdowns included:
- FPCI Iron Institutionals AgilaCapital: to fund a new continuation fund investment in an undisclosed e-procurement software business;
- GEM Benelux VI: to fund a new investment into Merba (European market leader in private label chocolate chip cookies); and
- Hg Mercury 4: to fund a new investment into Ctaima (a provider of software and specialised services for contractor management, health & safety, ESG and compliance).
Notable realisations in the portfolio during the month included:
- partial realisation of PPET’s direct investment in CFC (technology-led insurance platform which is a global leader and category innovator in high growth and attractive emerging risks), as well as the position held through Vitruvian IV; and
- full realisation of KM Packaging (global operating manufacturer of caps and closure solutions) from Capiton VI.
In August: PPET had £16.7m of drawdowns and £10.0m of distributions.
Notable drawdowns included:
- Investindustrial Growth III: to fund an investment in Ourvita, an Italian-headquartered company focusing on the development and manufacturing of vitamins and food supplements; and
- GEM Benelux VI: to fund a new investment into Tricorp, a Dutch business making modern workwear.
Notable realisations from the portfolio during the month included:
- an exit from Amplitude Surgical (global surgical technology for lower-limb orthopaedics) from PAI Mid-Market Fund; and
- proceeds from Hanab (a multi-utility service provider for infrastructure and telecommunications based in Germany) from Triton Fund 6.
Commitment levels
As is illustrated in Figure 13, as of 31 August 2025, PPET had total outstanding commitments of £760.9m. Patria estimates that £93.0m of this will never be drawn down.
Balanced against that, PPET had short-term resources (cash balances, deferred consideration, and undrawn credit facilities) of £312.6m at the end of August 2025.
PPET was using £193.9m of its £400m RCF at the end of August 2025. It also had cash of £9.0m and was expecting to receive £97.5m from its sale of a portfolio of secondary investments.
Figure 13: PPET outstanding commitments
| Date | Outstanding commitments (£m) | Outstanding commitments in excess of undrawn loan facility and resources available for investment as a % of NAV |
|---|---|---|
| September 2023 | 650.0 | 35.3 |
| September 2024 | 665.0 | 37.7 |
| August 2025 | 760.9 | 37.0 |
Performance
As per PPET’s most recent announcement, it reported an estimated NAV per share of 813.4p and total NAV of £1,210.1m, as of 31 August 2025. The month on month rise in PPET’s NAV of 2.9% in constant currency terms over August reflects the shift from a NAV based mostly (95.1%) on 31 March valuations as at the end of July to one based mostly (98.8%) on 30 June valuations. Listed equity markets have made further gains since then, which bodes well for end September valuations.
The managers observe that the earnings growth of the underlying companies in the portfolio is the primary driver of PPET’s long-term NAV returns. Those earnings uplifts are driven by a mixture of organic and inorganic growth (organic meaning internal business expansion; inorganic referring to acquisitions), and over the past few years (since interest rates began to rise) PPET’s NAV growth can be explained by its organic earnings growth.
Figure 14: Cumulative total return performance over periods ending 30 September 20251
| 3 months (%) | 6 months (%) | 1 year (%) | 3 years (%) | 5 years (%) | |
|---|---|---|---|---|---|
| PPET NAV | 2.9 | 3.3 | 5.9 | 14.6 | 92.4 |
| MSCI Europe Small Cap | 2.9 | 16.2 | 14.2 | 49.6 | 47.6 |
| PPET price | 0.3 | 1.0 | 7.0 | 49.3 | 103.5 |
| LPX Europe | 2.6 | 5.2 | 0.1 | 34.3 | 31.0 |
Average EBITDA earnings growth of 21.0%
Over the 12 months ended 31 March 2025, the 100 largest underlying companies (in aggregate, about 62.6% of the portfolio by value) delivered average revenue growth of 15.0% and average EBITDA earnings growth of 21.0%. We believe that the reason that this did not show up in NAV growth is mainly down to a shift in valuation multiples (a ratio that compares a company’s value to a key financial metric, such as earnings or revenue) and the conservative nature of the NAV calculation.
Figure 15: PPET NAV relative to the MSCI Europe Small Cap over five years to 30 September 2025
Source: Bloomberg, Marten & Co
Peer group
PPET is a member of the AIC’s private equity sector, which comprises some 18 members. Members will typically have over 80% of their assets invested in private equity/unquoted shares; and an investment objective/policy to invest in private equity or unquoted shares. For the purpose of this analysis, we have narrowed down the wider peer group to the 10 companies illustrated in Figure 16.
3i Group is among those excluded, as it considers itself to be an asset manager and has investment interests extending beyond private equity. We have also excluded EPE Special Opportunities, JPEL Private Equity, LMS Capital, and Seed Innovations Limited on size grounds, as all have market caps below £100m, making them less-relevant comparators. In addition, JPEL Private Equity and Symphony International Holdings are in wind-down mode, and Apax Global Alpha has been bid for.
PPET can boast one of the highest dividend yields in the sector, the lowest ongoing charges ratio, and robust long-term returns. In our opinion, all of these trusts are trading on discounts that are too wide.
Figure 16: AIC private equity sector comparison table, as at 22 October 2025
| Market cap (£m) | Premium/ (discount) (%) | Dividend yield (%) | Ongoing charge (%) | NAV TR1-year (%) | NAV TR 3-years (%) | NAV TR5-years (%) | NAV TR 10-years(%) | |
|---|---|---|---|---|---|---|---|---|
| PPET | 874 | (27.3) | 3.1 | 1.06 | 6.8 | 4.9 | 12.7 | 14.1 |
| CT Private Equity | 342 | (28.4) | 5.9 | 1.20 | 3.3 | 2.2 | 16.0 | 12.8 |
| HarbourVest Global PE | 2,149 | (30.9) | 0.0 | 2.02 | 9.2 | 1.4 | 14.2 | 14.7 |
| HgCapital | 2,252 | (8.8) | 1.1 | 1.40 | 5.0 | 7.7 | 14.0 | 17.8 |
| ICG Enterprise | 984 | (23.2) | 2.4 | 1.38 | 6.7 | 5.1 | 14.6 | 13.4 |
| Literacy Capital | 225 | (27.8) | 0.0 | 2.03 | 2.9 | 10.5 | – | – |
| NB Private Equity | 677 | (26.8) | 4.8 | 1.86 | 4.6 | (2.2) | 11.2 | 11.7 |
| Oakley Capital | 958 | (24.4) | 0.8 | 2.87 | 7.8 | 4.8 | 16.7 | 16.4 |
| Pantheon International | 1,551 | (30.5) | 0.0 | 1.35 | 7.3 | 2.2 | 11.2 | 12.1 |
| Partners Group Private Equity | 640 | (22.8) | 6.7 | – | 6.5 | 3.2 | 5.0 | 10.9 |
| Sector median | 958 | (27.3) | 1.1 | 1.40 | 6.7 | 4.8 | 14.1 | 13.8 |
| PPET rank | 6/10 | 6/10 | 4/10 | 1/9 | 4/10 | 4/10 | 6/9 | 4/9 |
Dividend
Dividend of 4.4p per quarter represents a 4.7% increase in the quarterly dividend rate year-on-year
Having introduced an enhanced dividend policy (supplementing revenue with distributions from capital reserves) in FY17, the PPET board aims to at least maintain the value of its dividend in real (inflation-adjusted) terms. During its 2024 financial year, PPET’s revenue covered approximately 13% of its dividend pay-out with the rest being funded from PPET’s capital reserves.
PPET paid a total dividend of 16.8p per share for the year to 30 September 2024, which represented a 5.0% increase on the previous financial year. The trust has said that the expected dividend for FY26 is 17.6p, which is being paid in quarterly amounts of 4.4p. The shaded bar in Figure 17 represents the likely Q4 payment which would be made in January 2026.
PPET now has a track record of growing its dividend every year for the past 10 consecutive years, earning at place in the AIC’s list of next generation dividend heroes.
Figure 17: PPET’s dividend history over financial years ending 30 September
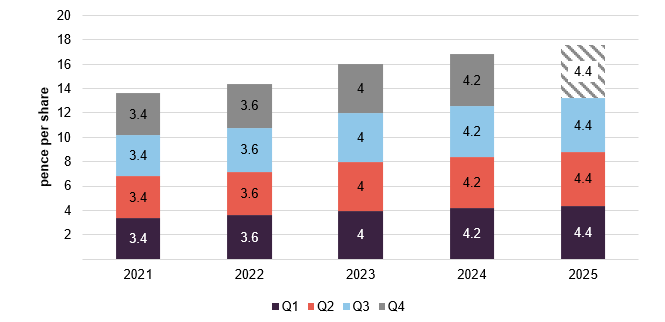
Source: PPET
For a given financial year, the first interim dividend is paid in April, with the second and third payments made in July and October. The fourth payment remains a final dividend and is paid in January following shareholder approval at the AGM. Ex-dividend dates and record dates occur the month prior to payment.
Premium/(discount)
Over the 12 months ended 30 September 2025, PPET’s discount moved within a range of 26.5% to 36.7% and averaged 29.9%. As at 22 October 2025, the discount was 27.6%.
PPET’s discount does appear to have stabilised since the first quarter of 2024. In part, this reflects the trust’s share buyback activity, which is shown in Figure 19.
Despite its good long-term track record and clear evidence – in the form of the average uplifts achieved on exit (a long-term average of 20%) – of the conservative nature of its valuation, the discount remains stubbornly wide.
Part of the problem relates to cost disclosures (which has failed to provide investors with clear information about all fees and charges associated with an investment), which is an issue that we have discussed at length in the past. In addition, unfortunately, the government has not included listed private equity as an appropriate asset class for pension fund investors to use as a way of increasing their exposure to the asset class in the latest Pensions Bill. The AIC is lobbying to have this rectified on the listed private equity sector’s behalf.
However, it feels to us as though the ramping-up of M&A activity within the UK closed-end fund market, which has included a bid for Apax Global Alpha, will eventually ram home the absurdity of these discounts. When the exit market picks up and NAVs rise, it seems likely that PPET and the rest of the sector will be re-rated.
Figure 18: PPET premium/(discount) over five years ended 30 September 2025
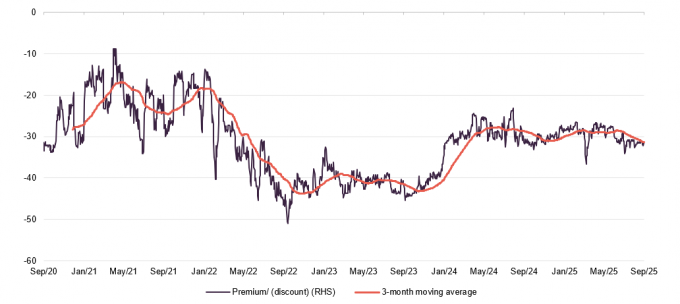
Source: Bloomberg, Marten & Co
Figure 19: PPET share buybacks by month
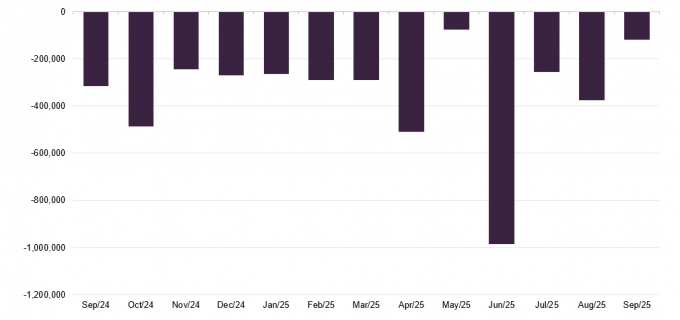
Source: PPET
SWOT and bull vs. bear analysis
Figure 20: SWOT analysis
| Strengths | Weaknesses |
|---|---|
| PPET has a good long-term track record | Relatively lower shorter-term returns could undermine the buy case for PPET and the asset class |
| PPET has an experienced and well-resourced investment team behind it | There is a perception that European companies do not have the dynamism or growth prospects of US peers |
| PPET has assembled a portfolio of interesting direct investments which can be used to help illustrate the attractions of the trust and this style of investing | GPs seem shy about highlighting the attractions of the underlying companies and are not themselves well-known, which hampers efforts to market the investment style |
| PPET’s progressive dividend policy should be attractive to income-seeking investors | |
| Opportunities | Threats |
| If investors could be educated about the long-term attractions of private equity (as the UK government seems to desire), relatively modest inflows into the asset class could shift ratings | A sharp pull back in listed equity valuations would not leave PPET unscathed |
| The EU political environment is febrile and there are other macroeconomic threats on the horizon |
Figure 21: Bull versus bear case
| Bull | Bear | |
|---|---|---|
| Performance | Listed European mid and small cap stocks trade on meaningful valuation discounts to US peers and this will be reflected in PPET’s valuations – suggesting that there is upside to the NAV. | An unpredictable government in the US could stall global growth. Rising government debt burdens could keep borrowing costs high and choke off a recovery in valuations. |
| Outlook | Investment flows out of the US could find a home in Europe. Any progress in the macro environment – an end to the war in Ukraine, for example – could be the trigger for a switch to more positive sentiment. PPET could experience a ‘double whammy’ of rising NAV and a narrowing discount. | A tentative recovery was choked off by the antics of the US government; we could be in for more of the same. A more prolonged difficult exit environment could undermine confidence in private equity. In particular, any sign that rates were rising again would be seen as a negative. |
| Discount | Discounts on almost all London-listed investment companies focused on private equity are too wide and PPET is no exception to this. This is an opportunity to be highlighted. | These discounts have been stubborn and prone to periods of widening during ‘risk-off’ environments. |
Previous publications
QuotedData has published a number of notes on PPET. You can read these by clicking the links in the table below or by visiting our website.
Figure 22: QuotedData’s previously published notes on PPET
| Title | Note type | Date |
|---|---|---|
| Sitting in a sweet spot | Initiation | 10 May 2016 |
| Reinvestment phase underway | Update | 14 September 2016 |
| Dividend doubled to 4.0% | Update | 22 February 2017 |
| Loading the portfolio | Update | 3 July 2017 |
| A good year; more to come? | Update | 8 December 2017 |
| Putting capital to work | Annual overview | 17 July 2018 |
| Now with direct investments | Update | 29 May 2019 |
| Share price out of sync? | Update | 15 July 2020 |
| Proving its mettle | Annual overview | 16 September 2021 |
| Laying the foundations for future returnsv | Update | 8 September 2022 |
| Unrecognised success | Annual overview | 8 September 2023 |
| On the way to greener pastures | Update | 10 April 2024 |
| Long-term success – near-term opportunity | Annual overview | 24 February 2025 |
IMPORTANT INFORMATION
Marten & Co (which is authorised and regulated by the Financial Conduct Authority) was paid to produce this note on Patria Private Equity Trust Plc.
This note is for information purposes only and is not intended to encourage the reader to deal in the security or securities mentioned within it. Marten & Co is not authorised to give advice to retail clients. The research does not have regard to the specific investment objectives financial situation and needs of any specific person who may receive it.
The analysts who prepared this note are not constrained from dealing ahead of it but, in practice, and in accordance with our internal code of good conduct, will refrain from doing so for the period from which they first obtained the information necessary to prepare the note until one month after the note’s publication. Nevertheless, they may have an interest in any of the securities mentioned within this note.
This note has been compiled from publicly available information. This note is not directed at any person in any jurisdiction where (by reason of that person’s nationality, residence or otherwise) the publication or availability of this note is prohibited.
Accuracy of Content: Whilst Marten & Co uses reasonable efforts to obtain information from sources which we believe to be reliable and to ensure that the information in this note is up to date and accurate, we make no representation or warranty that the information contained in this note is accurate, reliable or complete. The information contained in this note is provided by Marten & Co for personal use and information purposes generally. You are solely liable for any use you may make of this information. The information is inherently subject to change without notice and may become outdated. You, therefore, should verify any information obtained from this note before you use it.
No Advice: Nothing contained in this note constitutes or should be construed to constitute investment, legal, tax or other advice.
No Representation or Warranty: No representation, warranty or guarantee of any kind, express or implied is given by Marten & Co in respect of any information contained on this note.
Exclusion of Liability: To the fullest extent allowed by law, Marten & Co shall not be liable for any direct or indirect losses, damages, costs or expenses incurred or suffered by you arising out or in connection with the access to, use of or reliance on any information contained on this note. In no circumstance shall Marten & Co and its employees have any liability for consequential or special damages.
Governing Law and Jurisdiction: These terms and conditions and all matters connected with them, are governed by the laws of England and Wales and shall be subject to the exclusive jurisdiction of the English courts. If you access this note from outside the UK, you are responsible for ensuring compliance with any local laws relating to access.
No information contained in this note shall form the basis of, or be relied upon in connection with, any offer or commitment whatsoever in any jurisdiction.
Investment Performance Information: Please remember that past performance is not necessarily a guide to the future and that the value of shares and the income from them can go down as well as up. Exchange rates may also cause the value of underlying overseas investments to go down as well as up. Marten & Co may write on companies that use gearing in a number of forms that can increase volatility and, in some cases, to a complete loss of an investment.