
Premium investing
Temple Bar Investment Trust (TMPL), run by Ian Lance and Nick Purves, has once again outperformed; over 2025, it returned 33.9% in NAV terms and 45.3% in share price terms, well in excess of the UK – and indeed world – markets. It was accompanied by the shares moving to a premium to asset value at the end of the year – a very rare achievement in the investment company sector of late. This has allowed the fund to begin selling back to the market some of its own shares that it had previously repurchased.
Ian and Nick continue to believe in only deploying capital into companies where there is a clear and viable route to value enhancement for shareholders. The macro backdrop for TMPL was positive in 2025, with improving sentiment towards the UK market, where the fund maintains 70% of its exposure. However, the managers are confident that the UK remains undervalued and that they are continuing to identify companies trading well below their true worth. The prospects therefore look encouraging for the fund’s strong performance to continue into 2026 and beyond.
UK equity income and capital growth
TMPL aims to provide growth in income and capital to achieve a long-term total return greater than its benchmark (the FTSE All-Share Index), through investment primarily in UK securities. The company’s policy is to invest in a broad spread of securities, with the majority typically selected from the FTSE 350 Index.
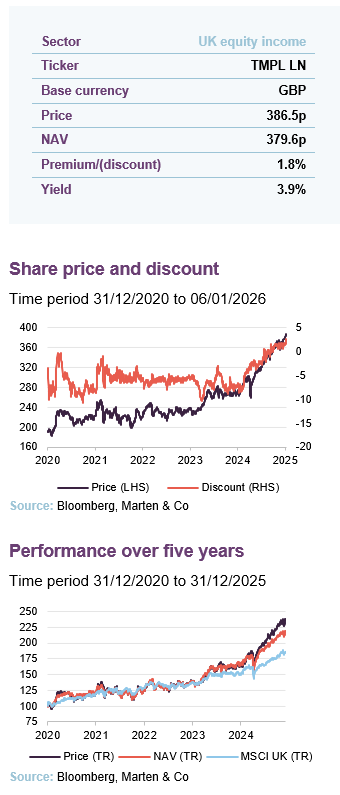
| 12 months ended | Share price total return (%) | NAV total return (%) | MSCI UK total return (%) | MSCI UK Value TR(%) | MSCI World TR (%) |
|---|---|---|---|---|---|
| 31/12/2021 | 20.0 | 23.5 | 19.6 | 17.7 | 22.9 |
| 31/12/2022 | 3.6 | 0.4 | 7.1 | 14.7 | (8.4) |
| 31/12/2023 | 12.5 | 12.3 | 7.7 | 6.4 | 17.3 |
| 31/12/2024 | 19.1 | 19.9 | 9.5 | 12.5 | 21.0 |
| 31/12/2025 | 45.3 | 33.9 | 25.8 | 32.6 | 12.7 |
Source: Bloomberg, Marten & Co
Market overview
2025 was positive for markets, and performance was more broad-based than in previous years.
Investor sentiment during 2025 was generally positive, with global equities rallying strongly over the year. Markets were less “unipolar” than in much of the recent past. Although the technology-heavy US market continued to perform strongly, it dominated investor attention to a lesser extent than in other recent years. This was particularly noticeable in the UK, which saw an improvement in both sentiment and performance from depressed levels.
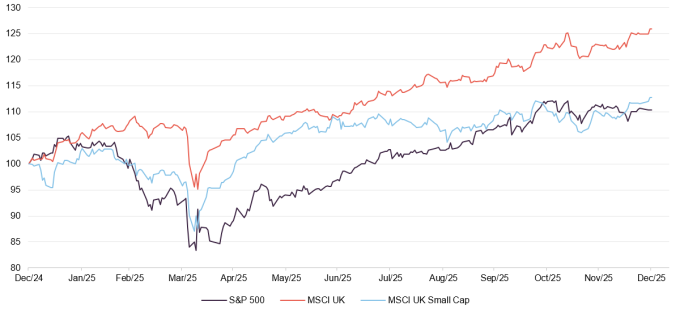
These trends are illustrated in Figure 1, which shows the performance of various market indices over the year. The S&P 500 rallied, but the UK market – as measured by the MSCI UK Index – did markedly better. This was not confined to large-cap companies, with smaller UK stocks – illustrated here by the MSCI UK Small Cap Index – also outperforming the US market, albeit narrowly. This overall picture clearly provided a strong backdrop for TMPL, where Ian and Nick invest in a broad spectrum of UK companies.
Figure 1: Market performance over 2025, indices rebased to 100
Source: Bloomberg, Marten & Co
The chart clearly shows the year’s main period of market weakness in April, when equities fell rapidly in the aftermath of President Trump’s “Liberation Day” tariff announcements. However, the downturn proved short-lived, with an initial 90-day tariff pause followed by a series of negotiations and back-and-forth between the Trump administration and different countries. For the remainder of the year, investors generally chose to look through this noise on trade and focus elsewhere. This meant attention on a corporate sector in good health, partly driven by a generally benign global inflation and interest rate environment.
Developed market interest rates have continued to fall.
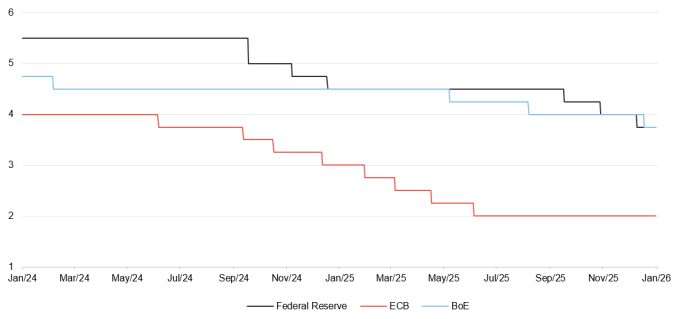
Figure 2 shows the steady fall in interest rates across developed markets in the past two years. Although periods of falling rates can be associated with strong performance for more “growth”-focused investors, in the current relatively benign macro environment both growth and value investors are generally seeing positive returns. It would be encouraging if we have moved away from the recent period of wild swings between the two styles moving into and out of favour, although the risk of this dynamic reasserting itself clearly remains.
Figure 2: US (Federal Reserve), eurozone (ECB) and UK (BoE) benchmark interest rates since January 2024
Source: Bloomberg, Marten & Co
Current prospects for TMPL
Value stocks perform strongly when corporate profitability is strong.
In conditions such as the current period, where corporate profitability is generally strong, value stocks in particular tend to perform well. Much of their value comes from current earnings rather than distant future profits, and strong profitability boosts cash flows and margins. Therefore, the current environment continues to look favourable for TMPL’s style of investing.
Despite the strong run in UK markets, Ian and Nick believe that there remains significant value in their universe of stocks and say that current purchases are not being made at the top of the market. The UK market is still materially cheaper than other developed country markets; for example, the S&P 500 started 2026 on a forward price to earnings multiple of 22x versus 13x for the FTSE 100.
With large-cap stocks in the UK outperforming their small-cap peers in 2025, as shown in Figure 1, it might seem logical for Ian and Nick to move down the market-cap spectrum somewhat in the coming months. However, they have made clear that all investment decisions are made on a stock-specific, bottom-up basis, with a focus on risk and reward, rather than being specifically driven by market-cap considerations.
Portfolio – asset allocation
Financials remain the largest sector weight in TMPL’s portfolio.
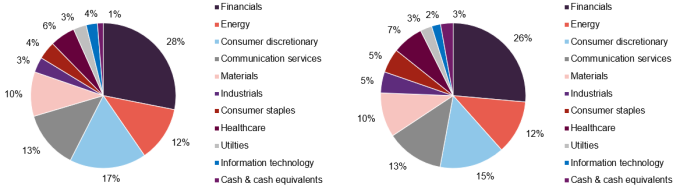
Financials remain comfortably TMPL’s largest sector weighting, albeit the allocation has reduced slightly since our last note (which used data as at 30 April 2025). Four of the portfolio’s top 10 positions are financials companies (see page 6), and the sector has been driven higher by strong corporate profitability, low loan losses and good interest margins. Many companies in the sector have been retiring equity cheaply through buybacks. The managers say that there is still value in the sector, even in an environment of falling interest rates, which could put pressure on net interest margins.
Elsewhere, TMPL’s allocation to the consumer discretionary sector also decreased somewhat, while industrials, consumer staples and technology saw modest increases.
Figure 3: TMPL sector distribution as at 30 April 2025
Figure 4: TMPL sector distribution as at 30 November 2025
Source: Temple Bar Investment Trust
Source: Temple Bar Investment Trust
In terms of geography, typically the trust’s policy is to invest the majority of the portfolio in companies in the UK’s FTSE 350 index, with a limit on non-UK assets of 30%. The current UK allocation is 70.3% (as at 30 November 2025). Nonetheless, there are some important overseas holdings in the portfolio, notably the US retailer Macy’s (covered in some detail in our last note in June 2025) and the Korean banks Hana Financial and Woori.
Early in 2025, Ian and Nick sold the Dutch bank ABN AMRO (another non-UK holding), TMPL having roughly doubled its money from the original investment. The proceeds were kept within the financial sector through buying Hana Financial and Woori. Sentiment towards the Korean banking sector has been very depressed and both banks traded on very low valuations. However, the managers identified that both are enjoying steady loan growth in a growing economy, while being efficiently run and with strong capital ratios. The Korean market rallied hard from the middle of May onwards on the back of efforts to improve Korean corporate governance, to the benefit of TMPL’s Korean exposure.
Gearing
TMPL’s gearing was 3.0% as at 30 November 2025, down from 5.7% at the time of our last note in May 2025.
Top 10 holdings and recent additions
Figure 5: Top 10 holdings as at 30 November 2025
| Holding | Sector | % of portfolio 30/11/25 | % of portfolio 30/04/25 | Change(%) |
|---|---|---|---|---|
| Johnson Matthey | Materials | 5.1 | 3.5 | 1.6 |
| Shell | Energy | 4.7 | 5.0 | (0.3) |
| NatWest | Financials | 4.3 | 5.0 | (0.7) |
| BP | Energy | 4.2 | 4.0 | 0.2 |
| BT Group | Communications | 4.0 | 3.4 | 0.6 |
| ITV | Communications | 4.0 | 4.7 | (0.7) |
| NN | Financials | 3.9 | 4.8 | (0.9) |
| Aviva | Financials | 3.8 | 4.9 | (1.1) |
| Barclays | Financials | 3.5 | 4.6 | (1.1) |
| Smith & Nephew | Healthcare | 3.5 | 2.1 | 1.4 |
| Total of top 10 | 41.0 | 42.0 | (1.0) |
Source: Temple Bar Investment Trust, Bloomberg
Johnson Matthey has risen from 10th-largest holding to first, due to very strong share price performance in recent months. There are two new names in the top 10, with BT Group and Smith & Nephew replacing Marks & Spencer and Standard Chartered.
BT Group and Smith & Nephew are covered below. We also asked the managers about progress at ITV.
Smith & Nephew
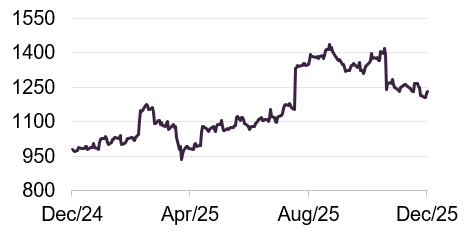
Figure 6: Smith & Nephew (GBp)
Source: Bloomberg
Smith & Nephew (www.smith-nephew.com) is a UK-based global medical technology company specialising in orthopaedics, sports medicine, ear, nose and throat (ENT) devices and advanced wound management. Ian and Nick initiated a position in Q2 of 2025.
The company has underperformed in recent years, and the TMPL managers were able to purchase the shares at about half their earlier high of around £20. The company is implementing a 12-point plan, aimed at improving operational performance, simplifying the business, and driving sustainable growth. This has led to a return to consistent underlying revenue growth across divisions, and as margins improve, the shares should perform well.
The company reported steady progress through 2025, with organic revenue growth of around 5% driven by strong demand in sports medicine and advanced wound management products, while cash generation has strengthened. The company also completed a US$500m share buyback programme to return capital to shareholders.
BT Group
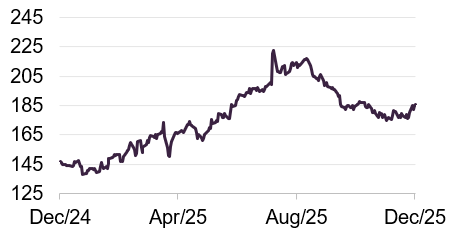
Figure 7: BT Group (GBp)
Source: Bloomberg
BT Group (www.bt.com) is the UK’s largest telecoms provider. TMPL’s investment is largely a bet on Openreach, the division that builds and maintains the physical broadband and telephone network across the UK. The managers say that when homes are connected to this infrastructure, BT requires roughly three out of 10 to sign up as customers to ensure profitability, and at present they are achieving this. In contrast, the “altnets” – the alternative networks like CityFibre, Toob and Zzoomm – are not achieving this, and risk running out of money.
BT’s shares have re-rated from a very low level (just over 100p in May 2024) as the market has got more comfortable with the Openreach story, but Ian and Nick believe the price is still too low. Away from Openreach, the company is undergoing a strategic transformation under chief executive Allison Kirkby, centred on modernisation, simplification, and improved customer service. The business is being streamlined – for example, exiting sports broadcasting, which proved to be very disappointing – and is strengthening its position in both consumer and enterprise markets. The company has been reporting modest growth in core earnings despite a slight fall in revenue.
ITV
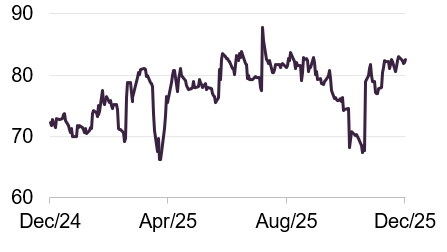
Figure 8: ITV (GBp)
Source: Bloomberg
ITV (www.itvplc.com) is the UK’s largest commercial broadcaster and a vertically integrated media group. Its two principal operating segments are ITV Studios, a global production and distribution business, and Media & Entertainment (M&E), which encompasses broadcasting and the streaming service ITVX.
ITV Studios – the second-largest independent production company in the world – has performed strongly for some time and Ian and Nick estimate it would be worth more than £3bn if auctioned separately. With the ITV share price being fairly static over last year, this £3bn figure roughly equals the company’s overall market cap, meaning investors essentially receive M&E as a free option. Clearly broadcasting is currently challenging, with less people watching linear television and high fixed costs. Nonetheless, there is still substantial value to be had, not least in ITVX which is growing both subscriber numbers and digital advertising.
Recently there have been press reports of preliminary talks between Comcast – the owner of Sky – and ITV for the former to purchase the M&E division. There is no guarantee these talks will lead to a deal, but they boosted the shares at the end of the year, and indicate that some event to unlock value for shareholders from M&E is likely.
Performance
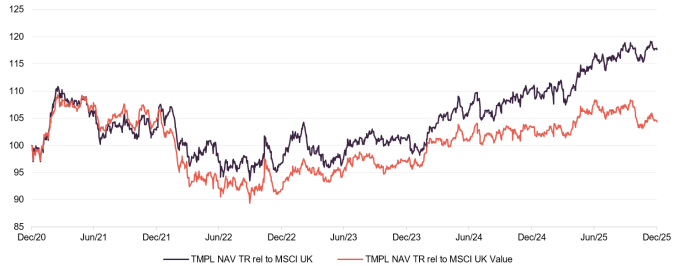
The current Redwheel management team has been running TMPL since the end of October 2020, so the five-year period in Figure 9 is entirely covered by their tenure. Over this period, the NAV return of 124% has been comfortably ahead of both the benchmark MSCI UK index, and the narrower MSCI UK Value sector.
Figure 9: Temple Bar NAV relative to MSCI UK and MSCI UK Value (sterling TR) to 31 December 2025
Source: Bloomberg, Marten & Co
Figure 10 illustrates that TMPL’s share price return over five years has been even further ahead of the two MSCI indices, at 142%. Most of this outperformance has been generated in more recent years, when the macroeconomic backdrop of falling inflation and interest rates has been favourable for both UK and value investors.
TMPL’s short-term performance looks equally impressive, with the one-year share price return in particular standing out, given the continued discount narrowing (see page 12). However, this is not just a discount story, with the NAV return of 33.9% also ahead of both the relevant indices driven by strong stock selection.
Figure 10: Total return performance over periods ending 31 December 2025
| 3 months(%) | 6 months(%) | 1 year(%) | 3 years(%) | 5 years(%) | |
|---|---|---|---|---|---|
| TMPL share price | 7.1 | 21.2 | 45.3 | 94.7 | 142.1 |
| TMPL NAV | 6.6 | 17.2 | 33.9 | 80.3 | 123.5 |
| MSCI UK | 7.1 | 15.4 | 25.8 | 48.3 | 90.0 |
| MSCI UK Value | 9.5 | 20.8 | 32.6 | 58.7 | 114.2 |
Source: Bloomberg, Marten & Co.
Contributor
Johnson Matthey
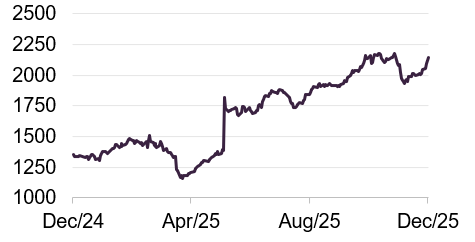
Figure 11: Johnson Matthey (GBp)
Source: Bloomberg
Johnson Matthey (www.matthey.com) is a speciality chemicals and sustainable technologies company that operates globally across clean air, platinum group metals and catalyst and hydrogen technologies.
On a five-year view the shares had performed poorly. This enabled Ian and Nick to purchase stock at a significant discount to any reasonable assessment of the worth of the whole company. They hoped that value could be released in short order as there has been agitation from an activist shareholder, the US hedge fund firm Standard Investments, which holds 11% of the company. This has led to proactive measures from the Johnson Matthey board, which partly explains the strong share price performance in 2025.
In May, Johnson Matthey agreed to sell its Catalyst Technologies business to Honeywell International; the deal is expected to complete in the first half of 2026. This is an all-cash deal valued at around £1.8bn, versus a market cap value of Johnson Matthey at the time of the announcement of around £2.3bn. Although the shares rallied somewhat on the news of the deal, given that Catalyst Technologies only generates around 25% of the profits of the group, the managers believe that the remainder of the company still looks very undervalued.
Detractor
WPP
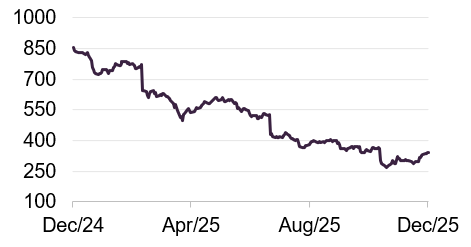
Figure 12: WPP (GBp)
Source: Bloomberg
WPP (www.wpp.com) is one of the world’s leading communications and advertising groups, operating through a global network of agency brands across media, creative, public relations, and technology services. Its scale and breadth give it a diversified client base and exposure to various advertising formats, from traditional channels to digital and data-driven segments.
The shares were the main disappointment in TMPL’s portfolio in 2025, declining by around two-thirds. WPP has issued two profit warnings in recent months, and guided 2025 revenue down by 5-6% and earnings down 25%. There are a number of factors making things difficult for the industry, most notably a poor advertising cycle. But the business has also been somewhat poorly managed, with other companies in the sector not performing as badly. A new CEO, Cindy Rose, recently joined from Microsoft, and reports that she has identified a number of areas where improvements will be made.
The result is that the shares are very lowly rated and, in Ian and Nick’s view, all the new management has to do is steady the ship and begin making basic improvements for them to begin to recover. The managers are confident that this can happen in the coming months.
Peer group
You can find up-to-date information on TMPL and its peers on our website
TMPL continues to compare favourably with its peers across a number of metrics. Discounts have carried on narrowing across the sector in recent months, to the extent that three trusts in the sector stand on premiums at the time of writing (see Figure 13). TMPL’s premium is the widest in the sector. The ongoing charges ratio of 0.61% is below the peer group median of 0.82%.
Figure 13: Snapshot of UK equity income sector as at 6 January 2026
| Premium/(discount) (%) | Yield (%) | Ongoing charges (%) | Market cap (£m) | |
|---|---|---|---|---|
| Temple Bar Investment Trust | 1.81 | 3.9 | 0.61 | 1,124 |
| Aberdeen Equity Income Trust | 0.76 | 5.6 | 0.84 | 200 |
| BlackRock Income and Growth | (13.67) | 3.5 | 1.15 | 42 |
| Chelverton UK Dividend Trust | (2.77) | 7.1 | 2.79 | 31 |
| CT UK Capital and Income | (3.54) | 3.8 | 0.66 | 329 |
| Diverse Income Trust | (7.56) | 4.2 | 1.13 | 256 |
| Dunedin Income Growth | (7.13) | 6.2 | 0.56 | 372 |
| Edinburgh Investment Trust | (6.48) | 3.5 | 0.51 | 1,126 |
| Finsbury Growth & Income | (5.46) | 2.4 | 0.62 | 977 |
| JPMorgan Claverhouse | (4.36) | 4.1 | 0.63 | 483 |
| Law Debenture Corporation | (1.56) | 3.1 | 0.51 | 1,457 |
| Lowland Investment Company | (8.37) | 4.0 | 0.71 | 362 |
| Murray Income Trust | (8.51) | 4.3 | 0.50 | 885 |
| Schroder Income Growth Fund | (5.38) | 4.2 | 0.78 | 240 |
| Shires Income | (0.29) | 5.0 | 1.00 | 123 |
| The City of London Investment | 1.38 | 4.0 | 0.36 | 2,713 |
| The Merchants Trust | (5.79) | 4.8 | 0.52 | 895 |
| Peer group median | (4.5) | 4.3 | 0.82 | 683 |
| TMPL rank | 1/17 | 12/17 | 7/17 | 4/17 |
Source: Marten & Co.
The yield continues to be towards the bottom of the peer group. However, this has increased from 3.5% at the time of our last note to a very healthy 3.9% now. This has been boosted by the new dividend policy that is explained on page 13. TMPL is the fourth-largest fund in the sector.
Figure 14 illustrates TMPL’s extremely strong performance record against its peers, being the sector leader over 6 months, 1 year, 3 years and 5 years.
Figure 14: Total return NAV performance over periods ending 31 December 2025
| 3 months (%) | 6 months (%) | 1 year (%) | 3 years (%) | 5 years (%) | |
|---|---|---|---|---|---|
| Temple Bar Investment Trust | 6.6 | 17.2 | 33.9 | 80.3 | 123.5 |
| Aberdeen Equity Income Trust | 7.5 | 16.8 | 30.8 | 39.7 | 62.5 |
| BlackRock Income and Growth | 6.0 | 10.1 | 16.2 | 36.7 | 56.7 |
| Chelverton UK Dividend Trust | (1.4) | (1.2) | 1.1 | 6.9 | 21.1 |
| CT UK Capital and Income | 2.3 | 5.2 | 13.2 | 33.5 | 45.1 |
| Diverse Income Trust | 1.8 | 8.4 | 23.5 | 38.4 | 38.8 |
| Dunedin Income Growth | 5.6 | 3.1 | 14.8 | 27.8 | 33.3 |
| Edinburgh Investment Trust | 2.3 | 3.9 | 10.0 | 42.9 | 78.8 |
| Finsbury Growth & Income | (4.6) | (10.2) | (7.6) | 5.3 | 11.2 |
| JPMorgan Claverhouse | 6.5 | 12.4 | 27.6 | 49.3 | 74.9 |
| Law Debenture Corporation | 4.8 | 12.1 | 27.8 | 61.3 | 96.0 |
| Lowland Investment Company | 6.2 | 13.1 | 31.5 | 54.7 | 80.7 |
| Murray Income Trust | 6.7 | 7.8 | 14.7 | 26.9 | 42.5 |
| Schroder Income Growth Fund | 7.2 | 11.6 | 25.1 | 41.3 | 63.8 |
| Shires Income | 8.2 | 11.0 | 26.0 | 42.4 | 59.2 |
| The City of London Investment | 6.7 | 11.9 | 27.2 | 51.0 | 90.5 |
| The Merchants Trust | 6.5 | 9.7 | 18.2 | 33.6 | 85.9 |
| Peer group median | (3.7) | (1.2) | 2.4 | 13.0 | 31.8 |
| TMPL rank | 6/17 | 1/17 | 1/17 | 1/17 | 1/17 |
Source: Bloomberg, Marten & Co.
Dividend
Shareholders receive a dividend payment each quarter.
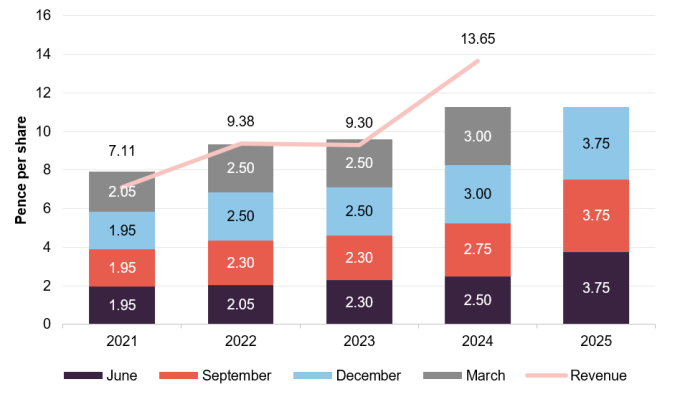
The board has reiterated its intention to distribute, over time, substantially all of TMPL’s net revenue income, and accordingly makes a dividend payment to shareholders each quarter. The first three payments for the financial year 2025 were each for 3.75p. This is a substantial increase over the previous year, with these three payments equalling the total of the four payments in 2024, with a final dividend still to be declared.
This increase in pay-out is a direct result of the recent change to TMPL’s dividend policy, as we detailed in our last note. As a reminder, companies are increasingly making returns to their investors through share buybacks rather than, or in addition to, income payments; this is particularly the case with many of the companies held by TMPL given their low valuations. The board wishes for TMPL shareholders to benefit from this trend and, as such, is enhancing the dividends being paid to reflect a portion of these buybacks by tapping into TMPL’s distributable reserves. The dividends for 2025 each reflected this enhancement, of 0.75p each time. The board hopes to increase this amount further over the next year.
Figure 15: TMPL’s recent dividend record as of 31 December 2025
Source: Temple Bar Investment Trust
Premium/(discount)
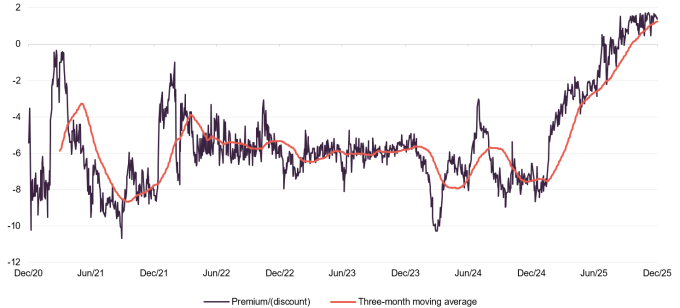
Figure 16: TMPL discount over five years ended 31 December 2025
Source: Bloomberg, Marten & Co.
In our last note we commented on the clear narrowing trend of the discount at the beginning of 2025. As shown in Figure 16, this trend has continued to such an extent that the shares have traded on a consistent premium since the end of September. This is very encouraging, given the prevalence of discounts seen across the wider investment companies sector.
TMPL’s shares moved to a premium at the end of 2025.
This very welcome development of TMPL’s shares moving to a premium is a reflection both of the trust’s ongoing strong performance and the favourable wider environment, with the UK market enjoying a very positive year. If both these factors continue, the trust could continue to trade at or above par through 2026.
When the shares traded on a discount, the board was proactive in repurchasing shares. A total of 5.218m shares were repurchased in 2024 at a cost of £12.7m. The final such purchase was made in February 2025. With the recent move to a premium, the board has been able to sell some of the shares held in treasury. 1.775m shares were sold in October, 1.15m in November, and 2.12m in December; enhancing the trust’s liquidity in a NAV-accretive way for existing shareholders. We would expect such sales to continue if the premium is maintained.
As this extra capital comes into the fund, Ian and Nick quickly deploy it; they report no shortage of new and interesting ideas to invest in.
Fund profile
You can access the trust’s website at: templebarinvestments.co.uk
TMPL aims to provide growth in income and capital to achieve a long-term total return greater than its benchmark (the FTSE All-Share Index), through investment primarily in UK securities. The company’s policy is to invest in a broad spread of securities with typically the majority of the portfolio selected from the constituents of the FTSE 350 Index.
Co-managers Nick Purves and Ian Lance aim to rotate the portfolio into those companies that they believe are available at a significant discount to intrinsic value. This involves buying the shares of attractively valued, out-of-favour companies and holding them for the long term until their share prices more appropriately reflect their true value, or until even more attractive ideas present themselves.
Redwheel became manager of TMPL on 1 November 2020
Redwheel took on responsibility for the portfolio with effect from 1 November 2020, with Nick and Ian named as co-managers. They have over 50 years’ experience between them and have worked together for more than 15 years. The two co-manage over £3bn of assets across a number of income funds. TMPL’s AIFM is Frostrow Capital.
SWOT analysis
Figure 17: SWOT analysis for TMPL

| Extremely strong performance in both NAV and share price terms, over both the short and long term. |
| A track record of consistently raising the dividend. This has been helped by a change in policy of enhancing the payout through its distributable reserves, reflecting the importance of share buybacks by its portfolio companies. |

| As a fund with a clear focus on value investing in the UK market, TMPL is exposed to a shift in investor sentiment to either, which could depress returns even with good stock-picking. |

| Despite a strong 2025, the UK market remains undervalued when compared to the likes of the US. Therefore, there remains significant upside potential for the stocks in TMPL’s portfolio. |
| The current macroeconomic environment looks favourable for TMPL, with value stocks typically doing well when corporate profitability is strong. |

| Although the recent move to a premium is testament to the strong performance and outlook for the fund, any investor buying at a premium risks a move back to par over time. |
Source: Marten & Co
Bull vs bear case
Figure 18: Bull vs bear case for TMPL


| Performance | Particularly strong performance over the past year, in both NAV and share price terms, adds to a very good long-term picture. | Such strong performance may not be maintained, particularly if the market environment turns against TMPL. |
| Dividends | Payouts to shareholders have consistently increased, supported by the new policy of enhancing these through distributable reserves. | There is no guarantee of these increases being maintained, if payouts and buybacks from the underlying companies come under pressure. |
| Outlook | The macroeconomic environment looks good for value investing, particularly in the UK where the market remains undervalued. | Both value investing and the UK market could move out of favour with investors, potentially quickly. |
| Discount/ premium | TMPL moved to a premium during 2025, a rare occurrence in recent investment company history. It is reflective of the strong performance and outlook, and could be extended further. | The premium may not last, and investment trust theory is that the fund should return to trading at NAV over the long term. |
Source: Marten & Co
Previous publications
Readers interested in further information about TMPL may wish to read our previous note, Temple of performance, published on 29 May 2025, as well as our previous notes. You can read the notes by clicking on them in Figure 19 or by visiting our website.
Figure 19: QuotedData’s previously published notes on TMPL
| Title | Note type | Date |
|---|---|---|
| Keeping faith | Initiation | 23 September 2020 |
| Just getting started | Update | 23 April 2021 |
| No compromise | Annual overview | 8 December 2021 |
| Time to Shine | Annual overview | 31 August 2022 |
| True Colours | Update | 26 June 2023 |
| Foundations for success | Update | 27 March 2024 |
| Historic opportunity | Annual overview | 22 October 2024 |
| Temple of performance | Update | 29 May 2025 |
Source: Marten & Co
IMPORTANT INFORMATION
This marketing communication has been prepared for Temple Bar Investment Trust Plc by Marten & Co (which is authorised and regulated by the Financial Conduct Authority) and is non-independent research as defined under Article 36 of the Commission Delegated Regulation (EU) 2017/565 of 25 April 2016 supplementing the Markets in Financial Instruments Directive (MIFID). It is intended for use by investment professionals as defined in article 19 (5) of the Financial Services Act 2000 (Financial Promotion) Order 2005. Marten & Co is not authorised to give advice to retail clients and, if you are not a professional investor, or in any other way are prohibited or restricted from receiving this information, you should disregard it. The note does not have regard to the specific investment objectives, financial situation and needs of any specific person who may receive it.
The note has not been prepared in accordance with legal requirements designed to promote the independence of investment research and as such is considered to be a marketing communication. The analysts who prepared this note are not constrained from dealing ahead of it, but in practice, and in accordance with our internal code of good conduct, will refrain from doing so for the period from which they first obtained the information necessary to prepare the note until one month after the note’s publication. Nevertheless, they may have an interest in any of the securities mentioned within this note.
This note has been compiled from publicly available information. This note is not directed at any person in any jurisdiction where (by reason of that person’s nationality, residence or otherwise) the publication or availability of this note is prohibited.
Accuracy of Content: Whilst Marten & Co uses reasonable efforts to obtain information from sources which we believe to be reliable and to ensure that the information in this note is up to date and accurate, we make no representation or warranty that the information contained in this note is accurate, reliable or complete. The information contained in this note is provided by Marten & Co for personal use and information purposes generally. You are solely liable for any use you may make of this information. The information is inherently subject to change without notice and may become outdated. You, therefore, should verify any information obtained from this note before you use it.
No Advice: Nothing contained in this note constitutes or should be construed to constitute investment, legal, tax or other advice.
No Representation or Warranty: No representation, warranty or guarantee of any kind, express or implied is given by Marten & Co in respect of any information contained on this note.
Exclusion of Liability: To the fullest extent allowed by law, Marten & Co shall not be liable for any direct or indirect losses, damages, costs or expenses incurred or suffered by you arising out or in connection with the access to, use of or reliance on any information contained on this note. In no circumstance shall Marten & Co and its employees have any liability for consequential or special damages.
Governing Law and Jurisdiction: These terms and conditions and all matters connected with them, are governed by the laws of England and Wales and shall be subject to the exclusive jurisdiction of the English courts. If you access this note from outside the UK, you are responsible for ensuring compliance with any local laws relating to access.
No information contained in this note shall form the basis of, or be relied upon in connection with, any offer or commitment whatsoever in any jurisdiction.
Investment Performance Information: Please remember that past performance is not necessarily a guide to the future and that the value of shares and the income from them can go down as well as up. Exchange rates may also cause the value of underlying overseas investments to go down as well as up. Marten & Co may write on companies that use gearing in a number of forms that can increase volatility and, in some cases, to a complete loss of an investment.