
Ageing well
Temple Bar (TMPL) turned 100 earlier this year and continues to perform strongly. Its one-, three-, and five-year returns are at or near the top of its peer group, and its dividend keeps rising. The managers also continue to take a contrarian approach, finding attractively valued stocks in a UK market that is cheap compared with peers.
TMPL’s portfolio is always changing. The managers are taking profits in financials, buying previously expensive consumer staples stocks, and looking at opportunities in IT services. This ongoing refresh supports the potential for future outperformance.
UK equity income and capital growth
TMPL aims to provide growth in income and capital to achieve a long-term total return greater than its benchmark (the FTSE All-Share Index), through investment primarily in UK securities. The company’s policy is to invest in a broad spread of securities, with the majority typically selected from the FTSE 350 Index.
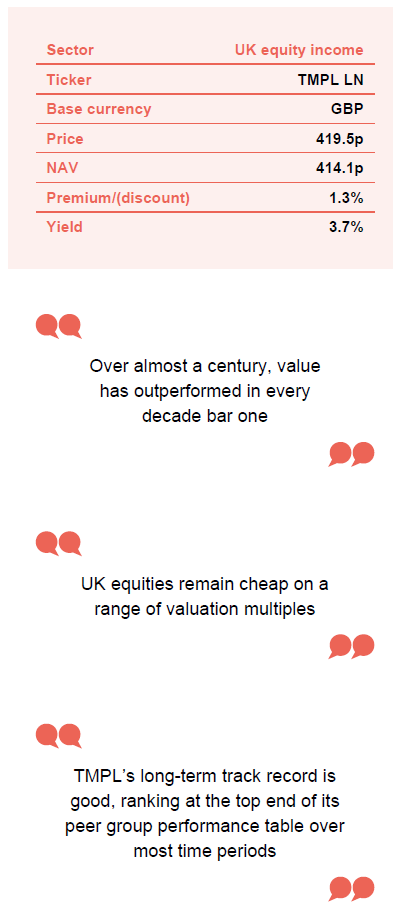
At a glance
Share price and premium/(discount)
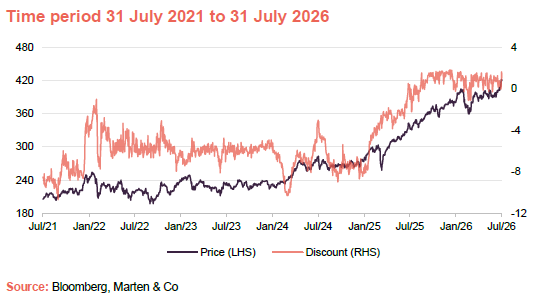
As investors became more convinced of TMPL’s ability to outperform over the long term, the shares re-rated over the course of 2025. Over the 12-month period that ended on 31 July 2026, TMPL’s shares have traded between a discount to net asset value (NAV) of 10.7% and a premium of 1.8%. For around a year now TMPL’s shares have been trading close to NAV and it has been able to issue shares at a premium.
Performance over five years
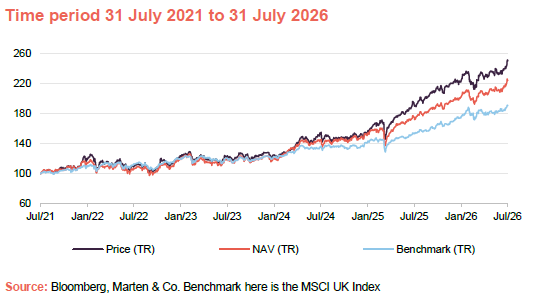
TMPL’s three-year and five-year returns remain comfortably ahead of its benchmark and peer group averages.
TMPL’s impressive recent track record owes much to its financials exposure. Its manager says that notable contributions to TMPL’s returns have come from stocks such as Standard Chartered, Barclays, NatWest, and Aberdeen Group
| 12 months ended | Share price total return (%) | NAV total return (%) | MSCI UK total return (%) | MSCI UK Valuetotal return (%) | MSCI World total return (%) |
|---|---|---|---|---|---|
| 31/07/2022 | 9.8 | 6.6 | 12.7 | 17.7 | 3.7 |
| 31/07/2023 | 12.7 | 12.2 | 6.8 | 6.7 | 7.4 |
| 31/07/2024 | 25.4 | 21.6 | 13.5 | 16.7 | 18.5 |
| 31/07/2025 | 22.9 | 19.9 | 12.7 | 15.4 | 12.3 |
| 31/07/2026 | 31.0 | 28.4 | 23.6 | 36.9 | 18.2 |
Fund profile – classic value investing
You can access the trust’s website at: templebarinvestments.co.uk
TMPL aims to grow income and capital over the long term and beat its benchmark, the FTSE All-Share Index, by investing mainly in UK shares. It invests across a broad range of holdings, typically drawn from the FTSE 350. In this note, we have substituted the MSCI UK Index for the FTSE All-Share.
TMPL’s AIFM is Frostrow Capital LLP, which has delegated portfolio management to RWC Asset Management LLC, trading as Redwheel. Redwheel has managed the trust since 1 November 2020. The lead managers are Nick Purves and Ian Lance (see page 16).
Looking for a disconnect between share prices and underling intrinsic value
The managers believe investors often overreact to news, becoming too optimistic or too pessimistic. This can leave a gap between a company’s underlying value and its share price, which long-term value investors can benefit from when sentiment normalises.
They seek undervalued but high-quality companies with strong cash flows and robust balance sheets, aiming to avoid “value traps”, where a stock looks cheap but the business is in structural decline. They believe these companies are more resilient in downturns and can recover from short-term issues. The approach also recognises that ESG factors can materially affect long-term success.
TMPL can invest up to 30% of the portfolio overseas. The chair has said the board and manager are monitoring the shrinking UK market due to takeovers and limited new issuance, and may ask shareholders to increase the 30% limit if needed. Peel Hunt and E&Y data showed 28 proposed takeovers worth £59.7bn in H1 2026, versus seven listings raising £577m. For now, the managers believe the UK still offers enough opportunities to meet the trust’s objective.
Value works – just look at the past 100 years
100 years old on 24 June 2026
On 24 June 2026, TMPL turned 100. It has lived through the Wall Street Crash, the Second World War, 1970s inflation, the 1980s recession, the tech boom and bust, the 2008 financial crisis, and COVID and its aftermath. The trust has not always had a value focus. It launched as “The Cable, Telephone and General Trust” and only adopted its current name in 1977, but by then it already focused on UK equity income. TMPL’s focus on dividend yield makes it a value investor.
At this year’s AGM, and in a separate video, Redwheel discussed the long-term case for value investing.
Over almost a century, value outperformed in every decade bar one
Figure 1 is taken from the video and shows annual US equity returns from a value strategy over the 92 years to the end of 2022. It buys shares that are cheaper than the market average on a book-to-price basis and shorts the more expensive ones. This approach does not outperform every year, but it has worked in every decade except the 2010s, when governments and central banks pushed interest rates to unsustainably low levels.
Figure 1: Out/underperformance of US value by year
| 30s (%) | 40s (%) | 50s (%) | 60s (%) | 70s (%) | 80s (%) | 90s (%) | 00s (%) | 10s (%) | 20s (%) | |
|---|---|---|---|---|---|---|---|---|---|---|
| Year 0 | (21) | (3) | 29 | (12) | 1 | (4) | (22) | 18 | 10 | 16 |
| Year 1 | 13 | 18 | (9) | 4 | 3 | 20 | 14 | 52 | (11) | 34 |
| Year 2 | 94 | 38 | (1) | 4 | (6) | 18 | 40 | 29 | 10 | |
| Year 3 | 135 | 85 | (10) | 8 | (12) | 29 | 25 | 56 | 9 | |
| Year 4 | 9 | 41 | 12 | 9 | 14 | 1 | 6 | 17 | (8) | |
| Year 5 | 16 | 29 | (2) | 31 | 32 | (7) | 0 | 3 | (10) | |
| Year 6 | 38 | (-4) | (5) | 5 | 32 | (3) | 5 | 8 | 19 | |
| Year 7 | (23) | 4 | (9) | 40 | 35 | 1 | 3 | (20) | (7) | |
| Year 8 | 0 | 1 | 25 | 42 | 24 | 8 | (22) | (17) | (15) | |
| Year 9 | 15 | 1 | 3 | (18) | 14 | (14) | 2 | 37 | (13) | |
| Decade (annualised) | 20 | 18 | 3 | 10 | 13 | 4 | 4 | 16 | (2) | 25 |
Figure 2: Long-run cumulative performance from low- and high-yielding stocks in the UK, 1900-2025
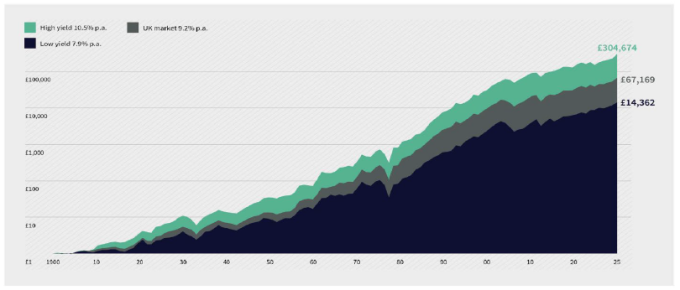
Figure 2, based on UK value stocks selected by dividend yield, reinforces this point. The y-axis uses a logarithmic scale. Over 125 years, consistently investing in high-yielding stocks and reinvesting dividends would have delivered 21x the return of a portfolio focused on low-yielding stocks.
Compelling UK valuation opportunity
As Figure 3 shows, UK equities performed well over 2025, but gains have stalled since war broke out between the US, Israel and Iran. Concerns that higher energy costs could push up inflation have added to worries about Labour’s looser fiscal stance, putting upward pressure on UK borrowing costs, as shown by UK 10-year gilt yields in Figure 4.
Figure 3: MSCI UK

Figure 4: UK 10-year gilt yields

The revolving door at 10 Downing Street may have hurt sentiment towards the UK market. However, the economy has held up better than some expected. UK GDP grew by 0.6% in Q1 2026 and was broadly flat in April and May. UK base rates are unchanged this year. UK inflation, measured by CPI, was 2.6% in the 12 months to the end of June 2026, lower than some forecasts.
Oil prices surged in March but eased over the next few months as both sides took a more conciliatory tone. This weighed on TMPL’s energy stocks, although the managers had taken some profits when share prices spiked after the outbreak of the Iran war. More recently, renewed hostilities have pushed oil and gas prices higher again as stockpiles fall, suggesting the situation may be more serious. EU gas prices, for example, are at new three-year highs.
UK equities remain cheap on a range of valuation multiples
Nevertheless, as Figure 5 shows, UK equities remain cheap compared with peers on a range of valuation measures – price/earnings (P/E) for the current year, the 2026 financial year and the 2027 financial year, plus price/book, EV/EBITDA, and dividend yield – which are all for the 2026 financial year.
Figure 5: Valuation multiples across various markets
| P/E (current)(x) | P/E (FY26)(x) | P/E (FY 27)(x) | Price/book (FY26) (x) | EV/EBITDA (FY26) (%) | Dividend yield (FY26) (%) | |
|---|---|---|---|---|---|---|
| MSCI UK | 15.11 | 13.45 | 12.84 | 2.30 | 8.41 | 3.93 |
| MSCI Europe ex UK | 18.37 | 16.96 | 15.42 | 2.41 | 11.59 | 2.94 |
| MSCI AC Asia ex Japan | 19.04 | 12.13 | 9.62 | 2.17 | 9.30 | 2.16 |
| MSCI Japan | 19.79 | 17.56 | 15.60 | 1.87 | 9.10 | 2.12 |
| MSCI USA | 25.87 | 21.59 | 18.87 | 5.13 | 15.37 | 1.14 |
It is often claimed that UK equities look cheap because the market has relatively few stocks in highly-rated sectors such as information technology. However, Figure 6 shows that UK stocks are cheaper than global averages in almost every sector.
Figure 6: P/E (FY 26) ratios for UK versus global stocks

A wave of takeover bids for UK companies adds to the view that UK equities are undervalued. In 2026, takeover offers have been made for Schroders, easyJet, Rotork, Tate & Lyle, UK Power Networks, Beazley, Intertek, Senior, Mitie, and SEGRO.
Portfolio
At the end of June 2026, TMPL’s portfolio had 40 holdings. The average yield was 4.1%, compared with 3.1% for its benchmark. The average current-year P/E ratio was 9.7x versus 12.7x for the index, while price/book was 1.2x versus 2.0x, respectively.
TMPL’s geographic and sector exposures reflect the managers’ stock selection and market movements.
Figure 7: TMPL geographic distribution as at 30 June 2026

Figure 8: TMPL change in geographic distribution since 30 November 2025

Since we last published, using data as at 30 November 2025, the portfolio has had more exposure to the US and consumer staples, and less exposure to cash and materials.
Figure 9: TMPL sector distribution as at 30 June 2026

Figure 10: TMPL change in sector distribution since 30 November 2025

Top 10 holdings
Since we last published using data as at 30 November 2025, Barclays and Smith & Nephew have both dropped out of the list of the 10 largest holdings, to be replaced by Marks & Spencer and GSK.
Figure 11: Top 10 equity holdings as at 30 June 2026
| Holding | Sector | % of portfolio 30/06/26 | % of portfolio 30/11/25 | Change (%) | P/E current year (x) | Dividend yield (%) |
|---|---|---|---|---|---|---|
| BT | Communications | 4.6 | 4.0 | 0.6 | 10.8 | 4.3 |
| NatWest | Financials | 4.4 | 4.3 | 0.1 | 9.1 | 4.9 |
| Marks & Spencer | Consumer staples | 4.4 | 3.4 | 1.0 | 11.3 | 1.1 |
| Shell | Oil & gas | 4.3 | 4.7 | (0.4) | 7.7 | 3.8 |
| BP | Oil & gas | 4.2 | 4.2 | – | 7.2 | 5.3 |
| NN | Financials | 3.9 | 3.9 | – | 9.7 | 5.1 |
| ITV | Communications | 3.8 | 4.0 | (0.2) | 9.4 | 6.2 |
| GSK | Healthcare | 3.7 | 3.5 | 0.2 | 11.2 | 3.4 |
| Johnson Matthey | Materials | 3.7 | 5.1 | (1.4) | 12.3 | 4.1 |
| Aviva | Financials | 3.6 | 3.8 | (0.2) | 10.9 | 6.0 |
| Total of top 10 | 40.6 |
Looking at these and some other stocks in the portfolio:
Marks & Spencer
Figure 12: Marks & Spencer (GBp)

We have discussed Marks & Spencer in previous notes (see page 19). Its share price has been volatile, but recent gains have moved it back into the 10 largest holdings.
The damaging cyber-attack last year is now behind it. The store refresh programme is delivering results and the food division is gaining share from rivals. TMPL’s managers highlight food margins of 4.6% for the financial year to the end of March 2026 as particularly pleasing.
TMPL’s managers still see further upside, as they believe the share price does not yet fully reflect the turnaround.
GSK
GSK has moved into the top 10 after its share price recovered. It is not a fast-growing business, but it is delivering revenue growth of about 3% a year, feeding through into double-digit organic earnings growth. TMPL’s managers felt this positive story was not reflected in its rating.
Figure 13: Barclays price/book (x)

TMPL’s exposure to financials has been a major driver of recent returns and the managers have been taking profits in this area. They note that almost everything has gone right for its bank holdings. A couple of years ago these stocks were rated very cheaply, but higher interest rates have lifted net interest margins, costs have fallen including with help from AI with more still to come, and loan losses have stayed under control.
Another key driver of the re-rating has been large share buybacks, which are supporting EPS growth.
Diageo and other consumer staples
Figure 14: Diageo (GBp)

One sector Redwheel has been adding to is consumer staples. The managers note this area was once highly rated by growth investors, but a sharp re-rating has brought many companies into TMPL’s range. Portfolio holdings include Kraft Heinz, Carrefour, J.M. Smucker, and Diageo.
Diageo has seen a severe re-rating, with shares more than 60% below their peak. The new CEO, Sir Dave Lewis, who previously worked at Tesco, joined at the start of 2026. His turnaround plan includes halving the dividend to save cash for investment in leading brands. He is also aiming to cut costs, decentralise the business, refresh the leadership team, and sell non-core assets.
Guinness and Guinness Zero are driving sales growth, as is the emerging markets business. However, TMPL’s managers are unsure whether weaker spirits sales in North America are a longer-term industry issue rather than something temporary or company-specific. This uncertainty is reflected in the smaller position size.
BP
Figure 15: BP (GBp)

BP is another self-help story in the portfolio. Alongside support from recent oil price rises, the main catalyst has been the shake-up led by its new CEO, Meg O’Neill, who took over on 1 April 2026. Meg was previously CEO of Woodside Petroleum and spent over 20 years at ExxonMobil. The TMPL managers have met her and were impressed.
TMPL’s managers think a key priority will be to unwind the low-return energy transition investments made under Bernard Looney, CEO from 2020 to 2023. This is already underway, with disposals expected to reduce debt. They also see a need to steady the business after frequent leadership changes, including the recent dismissal of the chair.
ITV
In September 2020, in our first note on TMPL, we said TMPL’s managers believed ITV’s market value was fully covered by its studios business, meaning the broadcast business was effectively “in for free”. On 6 July 2026, Sky announced it would pay up to £1.6bn for ITV’s media and entertainment business. Despite this, ITV’s share price fell on the day and is now below its September 2020 level. TMPL’s managers say investors may be reluctant to price in a deal that is unlikely to complete before H2 2027. In the meantime, a soon-to-be standalone studios business could attract another bidder, such as Netflix.
Software and IT services
TMPL currently has very little exposure to the IT sector, but recent falls in software and IT share prices have led the managers to review some companies more closely.
For now, software-as-a-service stocks that have dropped sharply still look too expensive for TMPL. However, many IT services companies now trade on low double-digit or even single-digit earnings multiples, and the analyst team is analysing several of these in more detail.
Performance
Figure 16: Total return performance over periods ending 31 July 2026
| 3 months (%) | 6 months (%) | 1 year (%) | 3 years (%) | 5 years (%) | |
|---|---|---|---|---|---|
| TMPL share price | 8.8 | 11.6 | 31.0 | 101.9 | 149.8 |
| TMPL NAV | 8.5 | 10.8 | 28.4 | 87.2 | 124.0 |
| MSCI UK | 5.2 | 8.5 | 23.6 | 58.1 | 90.3 |
| MSCI UK Value | 8.8 | 13.1 | 36.9 | 84.4 | 131.6 |
| MSCI World | 5.2 | 9.8 | 18.2 | 57.4 | 75.4 |
| Peer group1 NAV median | 7.5 | 8.6 | 19.6 | 49.7 | 61.4 |
| Peer group1 share price median | 8.4 | 8.3 | 21.2 | 44.9 | 64.1 |
TMPL’s three-year and five-year returns remain comfortably ahead of its benchmark and, as we discuss below, peer group averages.
TMPL’s performance versus the MSCI UK Value Index is affected by how concentrated that index is, which limits its usefulness as a comparator. At 30 June 2026, HSBC was 19.1% of the index, Shell 12.8%, Unilever 7.7%, and BAT 7.3%. HSBC’s share price is up about 70% over the past 12 months.
TMPL’s strong recent track record has been driven largely by its exposure to financials, discussed on page 9. Redwheel says key contributors include Standard Chartered, Barclays, NatWest, and Aberdeen Group.
Figure 17: Temple Bar NAV relative to MSCI UK (sterling total return) to 31 July 2026

WPP
Figure 18: WPP (GBp)

The only meaningful detractor from returns has been WPP, though the managers still see significant potential. Under Martin Sorrell, WPP was built through acquisitions into one of the world’s largest advertising agencies and the leading media buyer. Its market cap has fallen from a peak of around $30bn to about $4bn. While other global advertising groups have delivered modest revenue growth, WPP has seen like-for-like revenue declines over the past couple of years, leading to falling EPS. TMPL’s managers see this as a company-specific issue rather than an industry problem.
A new CEO, Cindy Rose, formerly of Microsoft, started in September 2025. TMPL’s managers have met her and believe she can turn WPP around, helped by her technology background. A key issue is that WPP’s businesses have not been well integrated and have sometimes competed for the same clients. The managers see scope to simplify the group and reduce costs, which should improve cost control.
The managers say it may be enough to stabilise the business. WPP trades on about 5x earnings, while a stable business might be valued at 10x. If the new CEO can also grow earnings, TMPL’s managers think organic revenue growth of 3% per year over the medium term, with an operating margin of 16–17%, is achievable, which could support a meaningful rerating.
Redwheel is a significant shareholder, holding about 10% of WPP across its funds and mandates, and is willing to give the new CEO time to deliver her transformation plan.
Peer group
You can find up-to-date information on TMPL and its peers on our website
TMPL is one of the larger of the 16 funds in the AIC’s UK equity income sector, and its running costs are below the sector median. Moving to an enhanced dividend has brought TMPL’s yield closer to the sector median. TMPL’s strong long-term track record, shown in Figure 19, is reflected in its rating and regular share issuance.
Figure 19: Snapshot of UK equity income sector as at 31 July 2026
| Premium/ (discount) (%) | Yield (%) | Ongoing charges (%) | Market cap (£m) | |
|---|---|---|---|---|
| Temple Bar Investment Trust | 1.3 | 3.7 | 0.59 | 1,283 |
| Aberdeen Equity Income Trust | 1.5 | 5.0 | 0.84 | 367 |
| BlackRock Income and Growth | (13.0) | 3.4 | 1.15 | 42 |
| Chelverton UK Dividend Trust | (6.6) | 7.0 | 2.25 | 32 |
| CT UK Capital and Income | (4.2) | 3.6 | 0.66 | 334 |
| CT UK High Income | (3.2) | 5.1 | 1.03 | 105 |
| Dunedin Income Growth | (7.8) | 6.1 | 0.57 | 368 |
| Edinburgh Investment Trust | (7.6) | 3.8 | 0.52 | 1,057 |
| Finsbury Growth & Income | (6.5) | 2.5 | 0.62 | 805 |
| JPMorgan Claverhouse | (1.4) | 3.7 | 0.62 | 530 |
| Law Debenture Corporation | 1.9 | 2.9 | 0.56 | 1,668 |
| Lowland Investment Company | (9.0) | 3.6 | 0.71 | 400 |
| Murray Income Trust | (6.2) | 4.0 | 0.48 | 952 |
| Schroder Income Growth Fund | (5.7) | 4.0 | 0.78 | 242 |
| The City of London Investment Trust | 2.0 | 3.7 | 0.36 | 3,057 |
| The Merchants Trust | (5.1) | 4.5 | 0.54 | 983 |
| Peer group median | (5.4) | 3.8 | 0.62 | 465 |
| TMPL rank | 4/16 | 10/16 | 7/16 | 3/16 |
TMPL has a strong long-term track record, ranking near the top of the table over most time periods. This reflects the success of its value-driven approach. Many trusts moved away from value when the style was underperforming. Those that focused on “quality” were often exposed to software stocks caught in the agentic AI sell-off earlier this year, most notably Finsbury Growth & Income.
Trusts with a bias to small-cap stocks have also lagged in recent years.
Figure 20: Total return NAV performance over periods ending 31 July 2026
| 3 months (%) | 6 months (%) | 1 year (%) | 3 years (%) | 5 years (%) | |
|---|---|---|---|---|---|
| Temple Bar Investment Trust | 8.5 | 10.8 | 28.4 | 87.2 | 124.0 |
| Aberdeen Equity Income Trust | 8.9 | 12.4 | 32.9 | 74.2 | 63.9 |
| BlackRock Income and Growth | 5.6 | 4.0 | 15.3 | 38.6 | 55.0 |
| Chelverton UK Dividend Trust | 7.9 | 7.8 | 10.5 | 25.4 | (7.5) |
| CT UK Capital and Income | 6.2 | 4.9 | 10.2 | 39.1 | 36.8 |
| CT UK High Income | 7.1 | 7.2 | 20.6 | 61.1 | 54.5 |
| Dunedin Income Growth | 7.5 | 7.8 | 12.3 | 27.5 | 33.3 |
| Edinburgh Investment Trust | 7.6 | 7.8 | 10.4 | 41.6 | 68.1 |
| Finsbury Growth & Income | 6.2 | 7.1 | (9.9) | (1.0) | 2.4 |
| JPMorgan Claverhouse | 8.1 | 9.4 | 22.2 | 61.6 | 68.6 |
| Law Debenture Corporation | 6.5 | 10.2 | 24.6 | 70.9 | 93.6 |
| Lowland Investment Company | 9.4 | 10.7 | 29.4 | 73.7 | 77.5 |
| Murray Income Trust | 10.3 | 11.4 | 18.5 | 33.4 | 38.6 |
| Schroder Income Growth Fund | 6.8 | 7.0 | 18.7 | 50.3 | 58.9 |
| The City of London Investment Trust | 7.5 | 10.3 | 24.9 | 70.0 | 92.6 |
| The Merchants Trust | 11.6 | 10.2 | 24.9 | 49.0 | 79.3 |
| Peer group median | 7.5 | 8.6 | 19.6 | 49.7 | 61.4 |
| TMPL rank | 5/16 | 3/16 | 3/16 | 1/16 | 1/16 |
Enhanced dividend
TMPL pays dividends quarterly. Since the 2025 AGM, it has used reserves to top up what it would have paid from net revenue earnings by an extra 3p per year, or 0.75p per quarter. This helps support payouts at a time when more companies have been using share buybacks rather than paying higher dividends. In the last annual report, the chair noted that Computershare’s UK Dividend Monitor showed buybacks were 42.1% of total distributions by UK listed companies in 2025.
This policy change drove the step-up in the 2025 dividend compared with 2024. However, the chair warned that future dividend growth is unlikely to match the strong increases of recent years.
For the current financial year, the dividend target is 15.6p, paid in four instalments of 3.9p. This is a 4% increase on the 2025 dividend.
Figure 21: TMPL’s recent dividend record

Premium/(discount)
Figure 22: TMPL discount over five years ended 31 July 2026

As investors became more confident in TMPL’s long-term ability to outperform, and the earlier period of value-strategy underperformance faded from memory, the shares re-rated during 2025. Over the 12-month period ended 31 July 2026, TMPL’s shares traded between a 10.7% discount and a 1.8% premium to NAV, with an average discount of 4.6%. At the time of publication, the shares were at a 1.3% premium.
The board aims to actively manage the share price versus NAV by issuing shares when they trade at a premium and buying back shares when they trade at a discount. Both actions can increase NAV for existing shareholders. At the AGM on 5 May 2026, shareholders approved authority for directors to issue up to 20% and buy back up to 14.99% of the shares then in issue.
Over the last 12 months, no shares were bought back due to strong demand, particularly from retail investors, and 21.13m shares were reissued from treasury.
Figure 23: Shares issued and repurchased

Structure
Fees and costs
As AIFM, Frostrow Capital LLP is paid 0.125% of TMPL’s market capitalisation up to £250m and 0.1% above £250m. As portfolio manager, Redwheel is paid 0.325% per year of the company’s total assets. There is no performance fee.
At 31 December 2025, TMPL’s ongoing charges were 0.59%, down from 0.61% a year earlier.
Capital structure
At 30 July 2026, TMPL had 334,363,285 shares in issue of which 28,629,447 were held in treasury. The number of shares with voting rights was 305,734,378.
Based on data published by the company as at 31 December 2025, retail investors owned 50.7% of TMPL’s shares, wealth managers and private banks 34.9%, and institutional investors 13.9%.
Gearing and hedging
TMPL has a £50m 4.05% private placement loan which is repayable on 3 September 2028, and a £25m 2.99% private placement loan which is repayable on 24 October 2047. The two loans are secured by a floating charge over the assets of the company. TMPL’s net gearing was 3.7% as of 31 May 2026.
TMPL does not currently hedge its currency exposure.
Financial calendar
The trust’s year-end is 31 December. The annual results are usually released in March (interims in September), and its AGMs are usually held in May of each year. TMPL pays quarterly dividends in April, June, September, December each year.
Management team
Nick Purves joined Redwheel in August 2010 from Schroders, where he was a senior portfolio manager with responsibility for both Institutional Specialist Value Funds and the Schroder Income Fund and Income Maximiser Fund, together with Ian Lance. He worked at Schroders for 16 years, having moved from KMPG, where he qualified as a chartered accountant.
Ian has over 30 years of experience in fund management and started working with Nick at Schroders in 2007 before joining Redwheel in August 2010. While at Schroders, he was a senior portfolio manager, managing the Institutional Specialist Value Funds, the Schroder Income Fund and Income Maximiser Fund, together with Nick. Previously, Ian was the head of European equities and director of research at Citigroup Asset Management and head of global research at Gartmore.
Board
TMPL’s board comprises five non-executive directors, all of whom are independent of the manager, and who do not sit together on other boards.
Charles Cade was appointed chairman of the board on 2 December 2025, succeeding Richard Wyatt, who stepped down from the board on that date after eight years as a director, including two as chair. The most recent recruits to the board were Nick Bannerman and Wendy Colquhoun, who were appointed in the summer of 2025.
Figure 24: Directors
| Role | Appointed | Length of service (years) | Fee | Shareholding | |
|---|---|---|---|---|---|
| Charles Cade | Chairman | 24 March 2022 | 4.3 | 49,000 | 50,000 |
| Shefaly Yogendra | Senior independent director, chair of the nomination committee | 1 October 2019 | 6.8 | 32,000 | 4,500 |
| Carolyn Sims | Chair of the audit and risk committee | 1 January 2023 | 3.5 | 37,000 | – |
| Nick Bannerman | Director | 1 July 2025 | 1.0 | 32,000 | 10,049 |
| Wendy Colquhoun | Chair of the management engagement committee | 1 July 2025 | 1.0 | 32,000 | 5,535 |
Charles Cade
Charles has more than 30 years’ experience in the investment companies sector, and was ranked among the leading analysts throughout his career at Numis Securities, Winterflood Securities, HSBC and Merrill Lynch. He joined the City following an MBA, having previously worked for a consultancy firm and as an economist in the UK government. Charles is currently a non-executive director of Vietnam Enterprise Investments Ltd, a member of the Investment Committee of the Rank Foundation charity, and an independent consultant to interactive investor, the retail platform.
Shefaly Yogendra, PhD
Shefaly was recently the COO of Ditto AI, a symbolic AI startup. She built her career in the technology industry, followed by strategic advisory work on emerging technologies, and specialises in governance, growth, risk, and decision-making. Shefaly is a non-executive director of JPMorgan US Smaller Companies Investment Trust Plc. She was listed among the “100 Women To Watch” in the Female FTSE Board Report 2016.
Carolyn Sims
Carolyn is the CFO and COO of British International Investment plc (BII), the UK’s Development Finance Institution. Before joining BII in 2020, she was CFO of the Wealth Management Division of Schroders Plc and a member of its Group Management Committee. Prior to that, Carolyn was the CFO of Cazenove Capital Management Limited until its sale to Schroders in 2013. She started her career with Touche Ross & Co. where she qualified as a Chartered Accountant. Carolyn then joined Lazard, where her roles included COO for Global Capital Markets and UK finance director.
Nick Bannerman
Nick is a Chartered Accountant and was managing director of a number of Scottish luxury cashmere businesses. He is a non-executive director of JPMorgan China Growth and Income Trust Plc and also of The Global Smaller Companies Trust Plc, where he also acts as chair of its audit committee. Nick was formerly chair of the audit committee and chair of Baillie Gifford Japan Trust Plc.
Wendy Colquhoun
Wendy is a former senior corporate partner at international law firm CMS Cameron McKenna Nabarro Olswang LLP where she specialised in advising financial services companies including investment trusts. Wendy is a non-executive director and the senior independent director of Capital Gearing Trust Plc, Schroder UK Mid-Cap Fund Plc, and Murray International Trust Plc. She was formerly a non-executive director and chair of Henderson Opportunities Trust Plc and a non-executive director of Scottish Financial Enterprise.
SWOT and Bull versus bear analysis
Figure 25: SWOT analysis for TMPL
| Strengths | Weakness |
| Good performance track record in both NAV and share price terms, over the medium-to-long term. | As a fund with a clear focus on value investing in the UK market, TMPL is exposed to a shift in investor sentiment, which could depress returns even with good stock picking. |
| Rebuilding its track record of progressive dividend payments, helped by a change in policy of enhancing the payout through its distributable reserves, reflecting the importance of share buybacks by its portfolio companies. | |
| Opportunities | Threats |
| Despite a strong 2025, the UK market remains undervalued when compared to peers. TMPL’s stocks are even cheaper than the UK market average. | A more pronounced deterioration in the UK economy or renewed concerns about UK government finances could unnerve investors. |
| The current environment of higher for longer inflation and interest rates is better suited to value rather than growth stocks. | |
| The market is becoming less convinced of the AI capex trade. |
Figure 26: Bull versus bear analysis for TMPL
| Bull | Bear | |
| Performance | TMPL can boast strong performance – at or close to the top of peer group tables over one, three and five years. | The period since the outbreak of war in the Gulf has been less favourable to TMPL. |
| Dividends | Payouts to shareholders have risen every year for five years and we see no reason why this trend should not continue. This is supported by TMPL’s policy of enhancing these through distributable reserves. | There is no guarantee of these increases being maintained, if payouts and buybacks from the underlying companies come under pressure. |
| Outlook | UK stocks remain undervalued relative to peers and the economic environment ought to be favourable, provided that the new UK government does not jeopardise this. | Both value investing and the UK market could move out of favour with investors, potentially quickly. |
| Discount | TMPL moved to a premium during 2025 and has been reissuing stock at a small premium (which is beneficial for existing investors). | Sentiment might turn against value investing once again (although we see nothing on the horizon currently to trigger that). |
Previous publications
Readers interested in further information about TMPL may wish to read our previous notes. You can read the notes by clicking on them in Figure 27 or by visiting our website.
Figure 27: QuotedData’s previously published notes on TMPL
IMPORTANT INFORMATION
Marten & Co (which is authorised and regulated by the Financial Conduct Authority) was paid to produce this note on Temple Bar Investment Trust Plc.
This note is for information purposes only and is not intended to encourage the reader to deal in the security or securities mentioned within it.
Marten & Co is not authorised to give advice to retail clients. The research does not have regard to the specific investment objectives financial situation and needs of any specific person who may receive it.
The analysts who prepared this note are not constrained from dealing ahead of it but, in practice, and in accordance with our internal code of good conduct, will refrain from doing so for the period from which they first obtained the information necessary to prepare the note until one month after the note’s publication. Nevertheless, they may have an interest in any of the securities mentioned within this note.
This note has been compiled from publicly available information. This note is not directed at any person in any jurisdiction where (by reason of that person’s nationality, residence or otherwise) the publication or availability of this note is prohibited.
Accuracy of Content: Whilst Marten & Co uses reasonable efforts to obtain information from sources which we believe to be reliable and to ensure that the information in this note is up to date and accurate, we make no representation or warranty that the information contained in this note is accurate, reliable or complete. The information contained in this note is provided by Marten & Co for personal use and information purposes generally. You are solely liable for any use you may make of this information. The information is inherently subject to change without notice and may become outdated. You, therefore, should verify any information obtained from this note before you use it.
No Advice: Nothing contained in this note constitutes or should be construed to constitute investment, legal, tax or other advice.
No Representation or Warranty: No representation, warranty or guarantee of any kind, express or implied is given by Marten & Co in respect of any information contained on this note.
Exclusion of Liability: To the fullest extent allowed by law, Marten & Co shall not be liable for any direct or indirect losses, damages, costs or expenses incurred or suffered by you arising out or in connection with the access to, use of or reliance on any information contained on this note. In no circumstance shall Marten & Co and its employees have any liability for consequential or special damages.
Governing Law and Jurisdiction: These terms and conditions and all matters connected with them, are governed by the laws of England and Wales and shall be subject to the exclusive jurisdiction of the English courts. If you access this note from outside the UK, you are responsible for ensuring compliance with any local laws relating to access.
No information contained in this note shall form the basis of, or be relied upon in connection with, any offer or commitment whatsoever in any jurisdiction.
Investment Performance Information: Please remember that past performance is not necessarily a guide to the future and that the value of shares and the income from them can go down as well as up. Exchange rates may also cause the value of underlying overseas investments to go down as well as up. Marten & Co may write on companies that use gearing in a number of forms that can increase volatility and, in some cases, to a complete loss of an investment.