
Is there an irrational bias against financials?
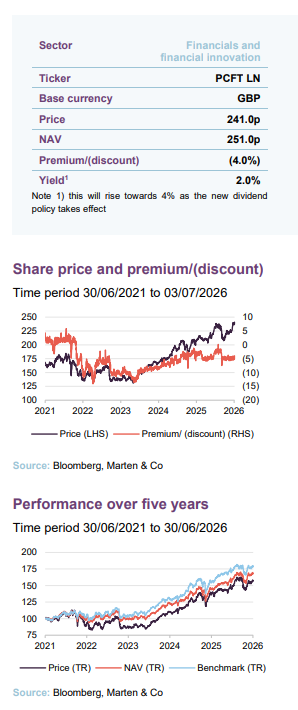
Financials stocks remain undervalued relative to other sectors and to history. The relative advances that the sector had made earlier in 2026 have been given up, but Polar Capital Global Financials Trust (PCFT) has outperformed in 2026 in NAV terms YTD, helped by some good stock selection decisions by the management team.
Some of PCFT’s holdings are already demonstrating enormous potential to cut costs and drive up profitability through the use of AI. That adds to the appeal of a sector where trading conditions are returning to normal and regulations are being relaxed. However, investors still appear to view the sector through the lens of the GFC, even though this was almost 20 years ago. At some point, there could be a significant re-rating, and PCFT offers a good way to play this.
Growing income and capital from financials stocks
PCFT seeks to deliver income and capital growth by finding the best investment opportunities across the world of financials (which includes banks, life and non-life insurance companies, asset managers, stock exchanges, speciality lenders, and fintech companies, as well as property and other related sub-sectors). A new enhanced dividend policy aims to pay out a quarterly dividend equivalent to approximately 4% of NAV each year.
| Year ended | Share price total return (%) | NAV total return (%) | MSCI ACWI Financials TR (%) | MSCI ACWI total return(%) |
|---|---|---|---|---|
| 30/06/2022 | (17.2) | (3.5) | (0.2) | (4.5) |
| 30/06/2023 | 4.3 | 5.1 | 6.8 | 11.6 |
| 30/06/2024 | 25.3 | 21.0 | 22.7 | 20.1 |
| 30/06/2025 | 26.8 | 20.9 | 22.6 | 7.1 |
| 30/06/2026 | 19.3 | 19.8 | 18.0 | 28.0 |
Fund profile
PCFT looks to grow investors’ income and their capital
More information on the trust is available on its website www.pcgft.com
Polar Capital Global Financials Trust (PCFT) has twin objectives of growing both investors’ income and their capital. Its global mandate makes it a useful alternative for UK-based investors looking to increase and diversify their financials exposure.
PCFT launched on 1 July 2013 with a fixed life. In April 2020, in conjunction with a vote on prolonging the life of the trust, shareholders were offered a cash exit. Shareholders overwhelmingly approved an extension of the trust’s life beyond May 2020. Then in June 2025, PCFT offered a 100% tender offer (holders of 56.17% of the shares stuck with the trust). These tender offers are held five-yearly, with the next planned for 2030.
Predominantly, the portfolio is invested in listed/quoted securities. The trust’s performance benchmark is the MSCI All-Countries World Financials Net Total Return Index in sterling (MSCI ACWI Financials).
PCFT’s AIFM is Polar Capital LLP, which had AUM of £30.6bn at 31 March 2026 and employs 13 investment teams, spread across offices in Europe, the US and Asia. PCFT’s lead managers are Nick Brind, George Barrow, and Tom Dorner.
Managers’ view
An important sector and a diverse one
PCFT’s managers reiterate that this is an important sector, the second-largest after IT in the global index, and a diversified one – banks account for less than half of the sector’s market cap. Investors are fixating on US technology but nevertheless, until the end of 2025, financials were outperforming, as Figure 1 shows. With little fundamental reason for the recent sell-off, there are good reasons to hope for a rebound.
Figure 1: MSCI ACWI Financials versus global equities
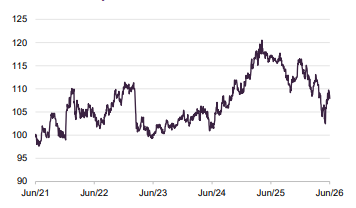
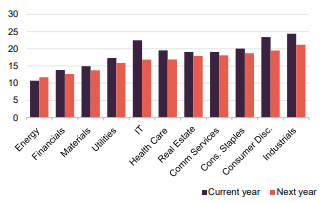
Figure 2:P/E ratios for major global sectors
Financials are cheap relative to other sectors and to history
Financials are also cheap relative to other sectors, as Figure 2 shows, and whilst they are more expensive than over recent history, the post-GFC period was largely one of artificially low interest rates, a much tougher regulatory environment, and constrained lending in the face of the need to rebuild balance sheets. Although that period is behind us and consequently the prospects for the sector are much brighter, financials remain rated well below where they were pre-GFC.
Figure 3: MSCI ACWI Financials price/earnings ratio over past 20 years
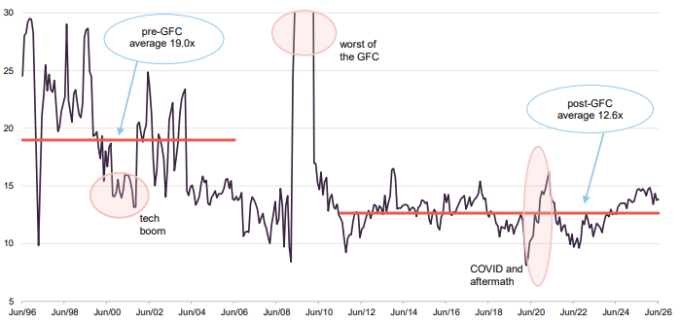
Figure 3 shows a 20-year chart of the P/E ratio on the MSCI ACWI Financials Index. The first signs of the GFC emerged in 2006 with problems in subprime home loans. Ahead of this, financials tended to trade on mid-teens to early 20s ratios – the average over the 10-year period from June 1996 to June 2006 was 19.0x. By contrast, the average for the 15-year period from June 2011 to June 2026 is 12.6x. In a long-term context, financials are cheap relative to history.
Even without the distortion of the Iran war, inflation and interest rates were elevated in many economies, which suggests that there will be little pressure on banks’ net interest margins. As we observed in our last note, default rates are still manageable. There is an outside possibility of global recession and rising bad debts, but this is far from PCFT’s managers’ central case.
Financials & AI – low disruption/big beneficiary?
The other big influence on markets is AI – in particular, the ongoing data centre capex boom and the sudden selloff in stocks perceived as threatened by agentic AI earlier this year.
Financials left behind by surging tech stocks…
It could be argued that one reason for the financial sector’s lowly rating is that it has been left on the sidelines by the surge in the valuations of IT hardware stocks and the excitement around the hyperscalers and creators of LLMs. Something similar happened during the tech boom, as Figure 3 shows.
…but financial stocks may be the biggest benefactors of AI
In our last note, we included a chart (Figure 5 on page 5 of that note) which showed that Accenture Research felt that the banking and insurance sectors could be amongst the biggest beneficiaries of AI. There is great potential to cut costs and improve service offerings with the help of AI. Figure 4 is taken from PCFT’s most recent presentation. It looks at the issue from the angle of which businesses the team believes are most at risk from AI disruption.
Figure 4: Change in P/E versus AI disruption score for stocks in PCFT’s portfolio
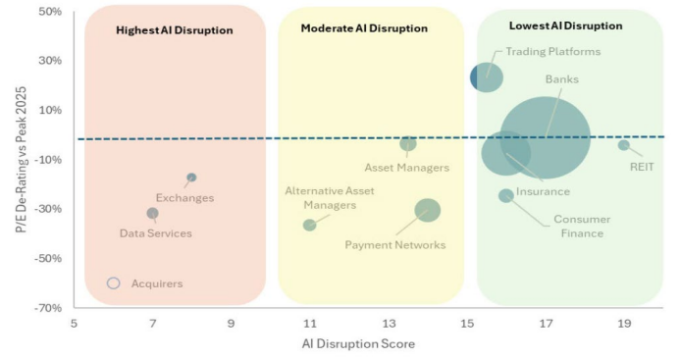
Figure 5: PwC estimate of cost impact on banks that embrace AI transformation
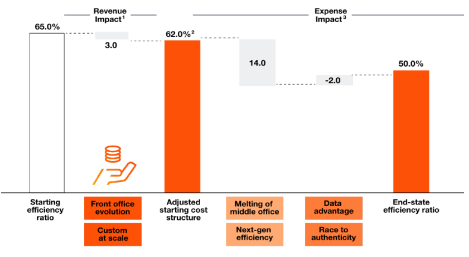
To put some colour on the potential efficiency gains, PwC reckons that banks can take 15 percentage points off their efficiency ratio (operating costs/revenue) as Figure 5 shows. See Bank of New York Mellon on page 9 for supporting evidence for this story.
Some of PCFT’s holdings were affected by the agentic-AI related sell off
Notwithstanding this positive aspect of the AI story, PCFT was impacted by the sharp sell-off in stocks perceived as threatened by agentic AI. Within the portfolio these included trading platform FlatexDEGIRO, credit ratings agency Moodys, investment bank Morgan Stanley, and London Stock Exchange Group. The managers sold PCFT’s holding in the latter before it bounced on news that the activist Elliott announced that it had taken a stake in the company and was agitating for change.
In the area of payments, the Mastercard and VISA share prices were also affected. Insurance brokers were hit hard when Spanish business Tuio launched an AI-enabled product, but this was not an area that PCFT had exposure to. The managers took advantage of a fall in credit ratings agency Moodys’s share price to build a position in that stock.
The jury is out on the real-world effect of agentic AI on these businesses, and this is a debate that may rumble on for a while yet.
Key themes
The managers have identified a number of themes that are expressed within the portfolio. Percentages represent the weight in the theme as at the end of April 2026.
Trading platforms (7%)
Trading platforms are seen as beneficiaries of the heightened market volatility that we have been experiencing in 2026, which has been amplified by retail investor flows as well as macroeconomic events. Stock positions include Plus500, FlatexDEGIRO, and IBKR – Interactive Brokers.
To illustrate the story, the managers put together some performance data of various platforms during periods of market weakness, which is reproduced in Figure 6.
Figure 6: Relative performance during market drawdowns
| Period | S&P 500(%) | MSCI ACWI Finls (%) | IG Group(%) | Plus500(%) | IBKR(%) | Stonex(%) |
|---|---|---|---|---|---|---|
| Sep 18 – Dec 18 | (8.0) | (5.3) | (7.0) | 2.4 | 5.3 | (15.6) |
| Feb 20 – Mar 20 | (33.8) | (41.3) | 23.1 | 50.4 | 4.6 | 1.7 |
| Jan 22 – Oct 22 | (24.3) | (20.8) | 19.2 | 57.3 | 10.5 | 37.0 |
| Jul 23 – Oct 23 | (9.9) | (10.3) | 2.7 | 9.1 | 1.1 | 10.4 |
| Feb 25 – Apr 25 | (18.9) | (12.2) | 10.1 | 20.7 | (24.5) | (2.2) |
European banks (18%)
The portfolio has a bias to European banks on valuation grounds. Stock positions include Santander, BPER Banca, Alpha Bank, and UniCredit. The managers highlight the discount that European banks trade at relative to the wider market (about 34% on average during the negative interest rate period and into the present day versus about a 15% discount before the GFC).
The managers also observe that European banks, insurance companies, and diversified financials are amongst a narrow group of sectors that have seen positive EPS revisions.
Insurance (18%)
Within insurance, the portfolio has a bias to life assurers with stock positions such as AIA, Prudential and Globe Life. Part of the attraction is the growth opportunity in Asia. PCFT’s managers have trimmed positions in AIA and Prudential recently.
Hiscox was acquired as a replacement for Beazley, which was bid for. In May, Hiscox shares jumped on rumours of a bid from Intact Financial Corp.
US banks (19%)
The easing of regulation is seen as a boon for US banks. The portfolio has exposure to companies such as JPMorgan, Bank of America and BNY Mellon. The managers are also expecting an acceleration of M&A activity amongst US banks, observing that recent deals seem to be waved through on shorter timescales than in previous years. FirstBank’s March 2025 acquisition of Southern States Bancshares took just three months to close, for example. The US banking market is still fairly fragmented; the Federal Reserve lists 3,849 domestically chartered commercial banks as at the end of December 2025.
Emerging markets (14%)
The main argument for EM exposure is the growth opportunity that arises as local populations become wealthier and use more financial products. PCFT holds stocks such as Korea’s Shinhan Bank, Brazil’s Nubank, and Mexico’s Banorte.
Figure 7: Mortgage penetration versus GDP per capita
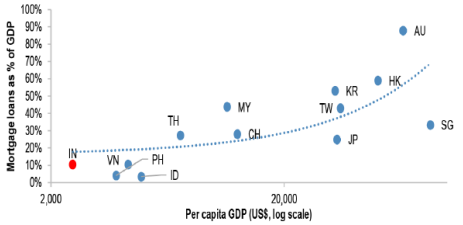
To illustrate the potential, the managers point to the relatively low penetration of mortgage products in Asia and India in particular, see Figure 7 (India highlighted in red, Australia included for comparison).
Alternative asset managers (now underweight)
Another story that has been hitting headlines has been about problems in private credit. The portfolio has an underweight exposure to alternative asset managers now, but PCFT did hold Blackstone when that story started gaining traction. There may be an element of catastrophising by the media here. For example, the managers observe that Partners Group’s gated funds are a relatively small proportion of its AUM, and it was still seeing net inflows in Q1.
Portfolio – asset allocation
At the end of May 2026, there were 69 positions in PCFT’s portfolio, just one more than at the end of November 2025 (when we last published). Relative to the benchmark MSCI ACWI Financials Index, PCFT’s active share at 31 May 2026 was 68.5%, marginally down from the figure at end November.
The managers highlight the diversification within the portfolio, which is evident in Figures 8 and 9.
Figure 8: PCFT geographic exposure as at 31 May 2026
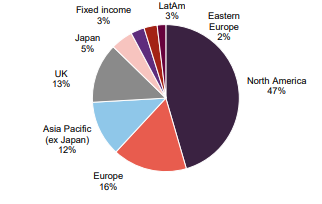
Figure 9: PCFT sector exposure as at 31 May 2026
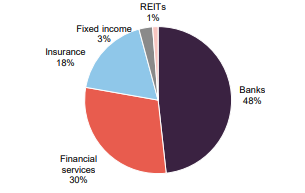
PCFT’s geographic asset allocation is little changed since we last published (using data as at the end of November 2025). Exposure to Europe has fallen from 19.4% to 16.4%. That money has been redeployed mostly to the UK – where the allocation has risen from 10.8% to 13.2%.
On a sector basis, exposure to banks and insurance has risen at the expense of financial services.
Top 10 holdings
Since we last published (using data as at end November 2025), BPER Banca, AIA Group, Erste Group Bank, and Globe Life have dropped out of the top 10. The replacements were Bank of New York Mellon, Morgan Stanley, IG Group Holdings, and Mizuho Financial.
Figure 10: Top 10 holdings as at 31 May 2026
| Country/region | Subsector | 31/05/2026(%) | 30/11/2025(%) | Change(%) | |
|---|---|---|---|---|---|
| JPMorgan | United States | Banks | 6.4 | 6.9 | (0.5) |
| Bank of America | United States | Banks | 3.8 | 3.9 | (0.1) |
| Royal Bank of Canada | Canada | Banks | 3.1 | 2.8 | 0.3 |
| Bank of New York Mellon | United States | Banks | 3.0 | n/a | n/a |
| Visa | United States | Financial services (payments) | 2.9 | 2.9 | – |
| Citigroup | United States | Banks | 2.8 | 2.3 | 0.5 |
| IG Group Holdings | United Kingdom | Financial services | 2.6 | n/a | n/a |
| Mastercard | United States | Financial services (payments) | 2.4 | 4.1 | (1.7) |
| Morgan Stanley | United States | Banks | 2.3 | n/a | n/a |
| Mizuho Financial | Japan | Banks | 2.3 | n/a | n/a |
| Total | 31.6 |
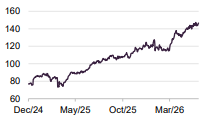
Figure 11: Bank of New York Mellon (USD)
Bank of New York Mellon
Bank of New York Mellon (bny.com) was the 10th-largest US bank by assets at the end of 2025. It is the world’s largest custodian, with over $59trn of assets under custody and/or administration, and is also one of the largest asset managers in the US.
Q1 2026 figures show a 13% YoY increase in revenue but a much smaller (5%) increase in costs allowed for widening margins, a 3.5 percentage point improvement in ROE (to 16.1%), and EPS up 42%.
Figure 12: Examples of where BNY is using AI
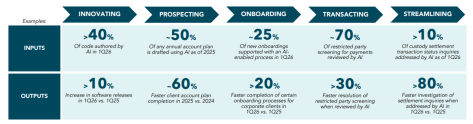
Figure 12, which is an extract from the bank’s Q1 results presentation gives some examples of where AI is making a difference.
The business is embracing the use of AI, with AI training and development programmes available to every employee, an upgrade to its own in-house AI platform Eliza (which was launched in 2024), and a multi-year collaboration with OpenAI.
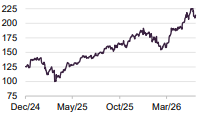
Figure 13: Morgan Stanley (USD)
Morgan Stanley
Morgan Stanley (morganstanley.com) is an investment bank, investment manager (with AUM of $1.9trn) and wealth manager (bringing the total AUM closer to $9.3trn).
Q1 2026 numbers were strong (ahead of analysts’ expectations) with revenue up 16%, ROE rising from 17.4% to 21.0%, and EPS up 32% helped by improved cost control. The wealth management business saw net inflows of $118bn.
Volatile equity markets on the back of the outbreak of the Iran war helped drive higher trading revenues. It also had a potentially lucrative role in the SpaceX IPO.
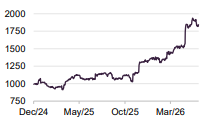
Figure 14: IG Group Holdings (GBp)
IG Group Holdings
IG Group (iggroup.com) provides trading services to almost 1.4m customers, dealing in OTC leveraged derivatives (it is the leading global provider of CfDs) and spread-betting (in the UK and Ireland only), exchange-traded derivatives (offered in the US through “tastytrade”), stocks, ETFs, and other instruments including forex, crypto, and commodities.
In its AGM statement published in May (which covered Q1 2026) it said that it had generated organic revenue growth of 19% YoY, helped by a growing number of first-time customers. Assets under administration passed £20bn.
IG Group is guiding towards 10%-15% revenue growth for 2026 as a whole and expects to sustain 40%+ EBITDA margins.
Performance
Figures 15 and 16 show the trust’s NAV and share price total returns alongside those of the MSCI All Countries World Financial Index for the five years to the end of June 2026. The drivers of PCFT’s historic performance have been covered in our previous notes, a list of which is provided on page 16.
Figure 15: Cumulative total return performance over periods ending 30 Jun 2026
| 3 months (%) | 6 months (%) | 1 year (%) | 3 years (%) | 5 years (%) | |
|---|---|---|---|---|---|
| PCFT price | 13.6 | 4.6 | 19.3 | 89.6 | 63.7 |
| PCFT NAV | 12.3 | 6.9 | 19.8 | 75.3 | 77.7 |
| MSCI ACWI Financials | 10.9 | 5.4 | 18.0 | 77.7 | 89.2 |
| MSCI AC World Index | 14.6 | 12.9 | 28.0 | 64.6 | 75.4 |
PCFT’s recent relative returns have been helped by its overweight exposure to Europe and corresponding underweight exposure to US financials. PCFT’s managers say that when the market rotated back into US stocks during April, financials did not fully participate in the US rally.
Figure 16: PCFT NAV, share price, and MSCI ACWI Financials five years to 30 June 2026
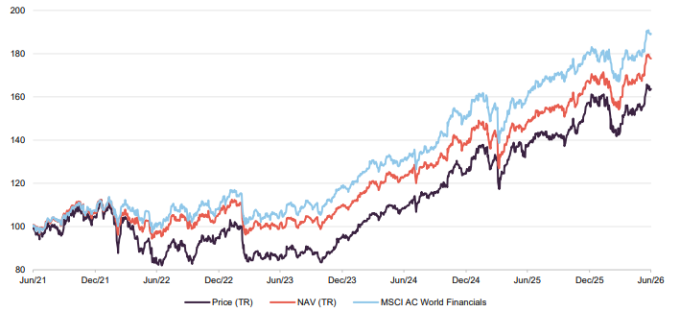
However, the main driver of PCFT’s relative returns has been stock selection.
Recent performance attribution
The manager supplied us with some performance attribution data that covers the six-month period to the end of May 2026. The data shows that over this period, PCFT’s return was 1.7 percentage points ahead of the benchmark.
Figure 17: Five-largest positive contributions to relative returns six months to 31 May 2026
| Average stock weight (%) | Active weight (%) | Stock return (%) | Total attribution (%) | |
|---|---|---|---|---|
| StoneX Group | 1.48 | 1.47 | 84.5 | 1.04 |
| IG Group Holdings | 1.81 | 1.81 | 61.1 | 0.87 |
| Plus500 | 1.58 | 1.58 | 42.6 | 0.51 |
| Bank of New York Mellon | 2.38 | 1.85 | 23.3 | 0.40 |
| Hiscox | 1.03 | 1.03 | 32.7 | 0.31 |
The effects of higher market volatility on trading volumes show up in the table in Figure 17, with all of the top four stocks being beneficiaries. Hiscox was the subject of bid speculation, as discussed on page 7.
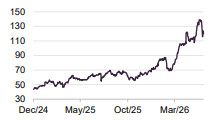
Figure 18: StoneX (USD)
StoneX
StoneX (stonex.com) is a platform that serves over 80,000 institutional, commercial, and payments clients, and over 400,000 self-directed retail investors. It provides 24-hour trading access to over 120 global markets. Over the 12 months to the end March 2026, StoneX generated operating revenues in excess of $5.2bn and net income of $462m (up 40% and 57% on the previous year, respectively).
The Q1 2026 numbers are sharply up YoY, reflecting the market volatility engendered by the US/Israeli attack on Iran. In particular, revenue from listed derivatives (+148%), OTC derivatives (+98%), and physical contracts (+162%).
StoneX is looking to expand its operations in Asia and EMEA.
Figure 19: Five largest negative contributions to relative returns six months to 31 May 2026
| Average stock weight (%) | Active weight (%) | Stock return (%) | Total attribution (%) | |
|---|---|---|---|---|
| Nu Holdings | 1.57 | 1.24 | (25.8) | (0.45) |
| HSBC Holdings | 0.58 | (1.22) | 30.2 | (0.43) |
| Goldman Sachs Group | – | (1.68) | 23.3 | (0.32) |
| S&P Global | 0.82 | (0.07) | (16.1) | (0.30) |
| Toronto-Dominion | – | (1.02) | 35.6 | (0.29) |
Four of the five negative relative contributions relate to stocks that PCFT does not hold or is underweight in, but which went up a lot.
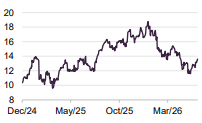
Figure 20: Nu Holdings
Nu Holdings
Nu Holdings (investidores.nu) is a Brazilian digital bank listed in the US, owned by PCFT since it was founded in 2013. The company has been phenomenally successful. It has expanded into Colombia and Mexico and can now boast 135m customers, almost double the number that it had three years ago.
It has been driving down its efficiency ratio – helped by and AI efficiencies and the lack of branch overheads that a typical bank would bear – and driving up revenue per user, which now stands at $16, from $12 in Q1 2025. This has been helped by an expansion of its net interest margin, which stood at 21.1% for Q1 2026.
In Brazil, Nu has an 18% share of the market for credit/debit cards, 8% for unsecured loans, and 4% for deposits. Mexico and Colombia are earlier-stage businesses.
The share price fall has been attributed to the departure of CFO Guilherme Lago, and missing analysts’ forecasts (despite record results). It may just reflect profit-taking and retail investors recycling money into AI stocks.
Premium/discount
Figure 21: PCFT’s premium/(discount) over the five years to 30 June 2026
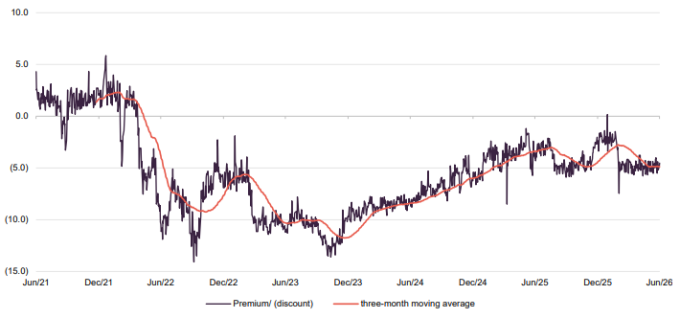
Over the 12 months ended 30 June 2026, PCFT’s discount moved within a range of a premium of 0.2% to a discount of 7.5% and averaged a discount of 4.1%. At 3 July 2026, PCFT was trading on a discount of 4.0%.
PCFT offers five-yearly exit opportunities. It also operates a discount control policy whereby if, under normal market conditions: (i) PCFT’s three-month average discount to NAV is greater than 5%, and (ii) the discount to NAV is currently greater than 5%, PCFT will buy back shares with the intention of reducing the discount to NAV to a level of no greater than 5%. We feel that both of these should help keep the discount relatively tight.
Ahead of the outbreak of the Iran war, PCFT briefly traded at a premium. However, the discount reopened in the more nervous and volatile markets that followed.
Dividend – enhanced dividend policy
Figure 22: Dividend history – periods ending 30 November
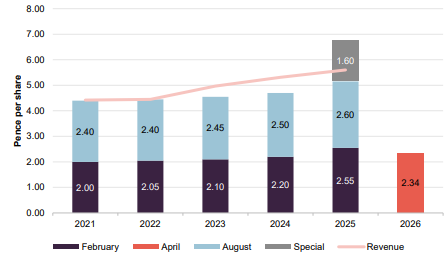
With effect from the new financial year that commenced on 1 December 2025, PCFT has adopted an enhanced dividend policy under which it will aim to pay, in the absence of unforeseen circumstances, a regular dividend equivalent to approximately 4% of the NAV in a given year. It is proposed that dividends will be paid quarterly at a level of 1% of NAV, calculated on the last business day of each prior financial quarter. The first of these was announced in March 2026 and paid in April 2026.
SWOT analysis and bull versus bear
Figure 23: SWOT analysis for PCFT
| Strength | Weakness |
| Large, experienced team dedicated to the strategy | Five-year performance lags performance benchmark |
| One-stop-shop for diversified financials exposure | |
| Attractive structure with strong discount control measures | |
| Opportunities | Threats |
| Sector is cheap relative to other sectors and its long-term history | Risk of rising defaults, if economic conditions weaken, after an extended period where these have been low |
| Regulation is being eased, which should boost profitability | |
| Opportunity to cut costs by using AI |
Figure 24: Bull versus bear analysis for PCFT
| Bull | Bear | |
| Performance | Sector is cheap and backdrop supportive | A weaker economy/falling market could bring the sector down with it |
| Dividends | New 4% of NAV distribution policy for incomeseeking investors | Dividends will fluctuate with NAV and eat into capital if the NAV falls |
| Outlook | The sector’s prospects look bright | Sentiment still seems to be against the sector and investors are nervous – muscle memory of the GFC is still there |
| Discount | Shares have been trading within discount target, loose shareholders exited earlier this year, and buying could drive it down to asset value | No real downside as long as board sticks to discount control policy, and no reason why it shouldn’t |
Previous publications
QuotedData has published a number of notes on PCFT. You can read these by clicking the links in the table below or by visiting the QuotedData.com website.
Figure 25: QuotedData’s previously published notes on PCFT
| Title | Note Type | Date |
|---|---|---|
| Don’t fear a slowing economy | Initiation | 30 April 2019 |
| Banks too cheap to ignore | Update | 29 October 2019 |
| New lease of life | Update | 22 February 2020 |
| Too much pessimism? | Annual overview | 22 October 2020 |
| The tide has turned | Update | 25 February 2021 |
| More to go for | Annual overview | 18 November 2021 |
| Riding out the storm | Update | 5 April 2022 |
| Don’t fear the dog that is yet to bark | Annual overview | 30 November 2022 |
| Avoiding mishap | Update | 7 June 2023 |
| Pessimism overdone, time to buy | Annual overview | 12 December 2023 |
| Handful of themes to drive performance | Update | 13 June 2024 |
| Taking advantage of a favourable landscape | Annual overview | 12 December 2024 |
| An entry as well as an exit opportunity | Update | 22 May 2025 |
| Cheap and cheerful | Annual overview | 7 January 2026 |
Important Information
This marketing communication has been prepared for Polar Capital Global Financials Trust Plc by Marten & Co, which is authorised and regulated by the Financial Conduct Authority (FCA). It constitutes non-independent research as defined under the UK MiFID II regime and the onshored Commission Delegated Regulation (EU) 2017/565.
This communication is intended for use by investment professionals as defined in Article 19(5) of the Financial Services and Markets Act 2000 (Financial Promotion) Order 2005. Marten & Co is not authorised to provide advice to retail clients. Accordingly, if you are not a professional investor, or are otherwise restricted from receiving this information, you should disregard it.
The note does not have regard to the specific investment objectives, financial situation and needs of any specific person who may receive it.The note has not been prepared in accordance with legal requirements designed to promote the independence of investment research and as such is considered to be a marketing communication. The analysts who prepared this note are not constrained from dealing ahead of it, but in practice, and in accordance with our internal code of good conduct, will refrain from doing so for the period from which they first obtained the information necessary to prepare the note until one month after the note’s publication. Nevertheless, they may have an interest in any of the securities mentioned within this note.
This note has been compiled from publicly available information. This note is not directed at any person in any jurisdiction where (by reason of that person’s nationality, residence or otherwise) the publication or availability of this note is prohibited.
Accuracy of Content: Whilst Marten & Co uses reasonable efforts to obtain information from sources which we believe to be reliable and to ensure that the information in this note is up to date and accurate, we make no representation or warranty that the information contained in this note is accurate, reliable or complete. The information contained in this note is provided by Marten & Co for personal use and information purposes generally. You are solely liable for any use you may make of this information. The information is inherently subject to change without notice and may become outdated. You, therefore, should verify any information obtained from this note before you use it.
No Advice: Nothing contained in this note constitutes or should be construed to constitute investment, legal, tax or other advice.
No Representation or Warranty: No representation, warranty or guarantee of any kind, express or implied is given by Marten & Co in respect of any information contained on this note.
Exclusion of Liability: To the fullest extent allowed by law, Marten & Co shall not be liable for any direct or indirect losses, damages, costs or expenses incurred or suffered by you arising out or in connection with the access to, use of or reliance on any information contained on this note. In no circumstance shall Marten & Co and its employees have any liability for consequential or special damages.
Governing Law and Jurisdiction: These terms and conditions and all matters connected with them, are governed by the laws of England and Wales and shall be subject to the exclusive jurisdiction of the English courts. If you access this note from outside the UK, you are responsible for ensuring compliance with any local laws relating to access.
No information contained in this note shall form the basis of, or be relied upon in connection with, any offer or commitment whatsoever in any jurisdiction.
Investment Performance Information: Please remember that past performance is not necessarily a guide to the future and that the value of shares and the income from them can go down as well as up. Exchange rates may also cause the value of underlying overseas investments to go down as well as up. Marten & Co may write on companies that use gearing in a number of forms that can increase volatility and, in some cases, to a complete loss of an investment.