
Cheap and cheerful
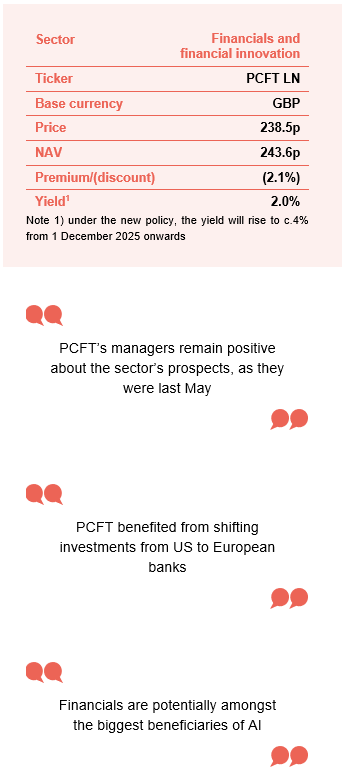
After several years of the global financials sector outperforming global equities, the managers of Polar Capital Global Financials Trust (PCFT) remain positive about the sector’s prospects, as they were last May.
They note that many investors overlook or underweight financials. Despite recent strong performance, financials still have the lowest valuations compared to other sectors and are seeing better returns on equity. Many investors, either by choice or through index-tracking ETFs, have large exposures to technology and are becoming more concerned about high valuations there. This could encourage a shift in sentiment towards financials as a way to diversify.
Growing income and capital from financials stocks
PCFT seeks to deliver income and capital growth by finding the best investment opportunities across the world of financials (which includes banks, life and non-life insurance companies, asset managers, stock exchanges, speciality lenders, and fintech companies, as well as property and other related sub-sectors). A new enhanced dividend policy aims to pay out a quarterly dividend equivalent to approximately 4% of NAV each year.
Share price and discount
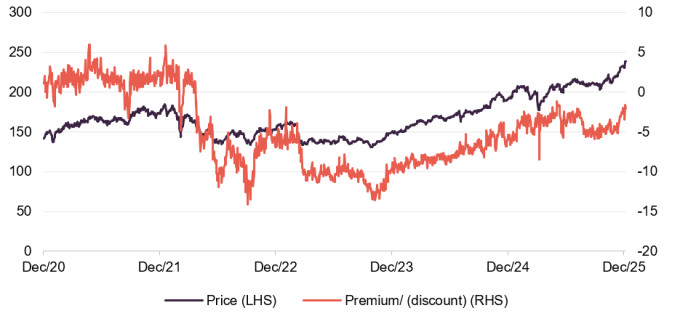
During the 12 months to 31 December 2025, PCFT’s discount ranged from 1.2% to 8.5%, averaging 4.0%. As of 6 January 2026, the discount was 2.1%.
PCFT offers investors an exit opportunity every five years and has a policy to control its discount.
Time period 31 December 2020 to 6 January 2026
Source: Bloomberg, Marten & Co
Performance over five years
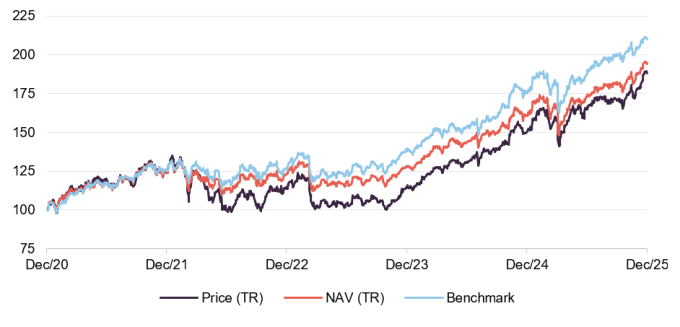
PCFT has been climbing steadily since 2023. After recovering from the tariff announcements in April, both the NAV and share price have risen in recent months, broadly matching the benchmark.
Time period 31 December 2020 to 31 December 2025
Source: Bloomberg, Marten & Co
| Year ended | Share price total return (%) | NAV total return (%) | MSCI ACWI Financials total return (%) | MSCI ACWI total return (%) |
|---|---|---|---|---|
| 31/12/2021 | 25.4 | 24.2 | 25.4 | 19.6 |
| 31/12/2022 | (9.3) | (0.5) | 0.9 | (8.7) |
| 31/12/2023 | 0.8 | 3.7 | 9.5 | 15.8 |
| 31/12/2024 | 31.8 | 25.5 | 26.7 | 19.8 |
| 31/12/2025 | 24.7 | 20.7 | 19.7 | 13.9 |
Source: Bloomberg, Marten & Co
Fund profile
PCFT looks to grow investors’ income and their capital
More information on the trust is available on its website www.pcgft.com
Polar Capital Global Financials Trust (PCFT) aims to grow both investors’ income and capital. Its global approach offers UK investors a way to broaden and diversify their exposure to financial companies.
PCFT started on 1 July 2013 with a fixed lifespan. In April 2020, shareholders voted to extend the life of the trust beyond May 2020, with a cash exit option. Most chose to stay invested. In June 2025, a 100% tender offer saw 56.17% of shares remain. These offers take place every five years, with the next due in 2030.
The trust mainly invests in listed securities and measures performance against the MSCI All-Countries World Financials Net Total Return Index in sterling. Its manager, Polar Capital LLP, had £28.4bn in assets under management as of 7 November 2025, with 13 investment teams across Europe, the US, and Asia. PCFT is managed by Nick Brind, George Barrow, and Tom Dorner.
Managers’ view – strong returns yet low valuations
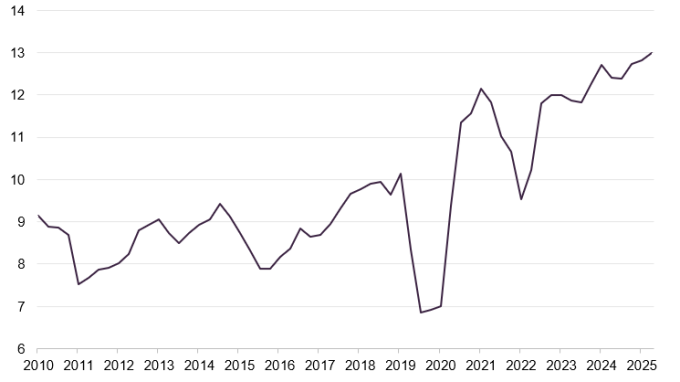
Since the global financial crisis, the sector has steadily improved its returns on equity (ROE), as shown in Figure 1. The drop during COVID was mainly due to provisions for bad debts that did not lead to actual losses. Low interest rates had previously limited returns, but as rates rose from 2022, banks’ net interest margins increased.
Figure 1: MSCI ACWI Financials ROE
Source: Bloomberg
ROE on a rising trend for financials
Strict capital discipline after the financial crisis had held back ROE in the sector. Now, with resistance to tighter regulation and a rise in share buybacks, ROE growth is being supported.
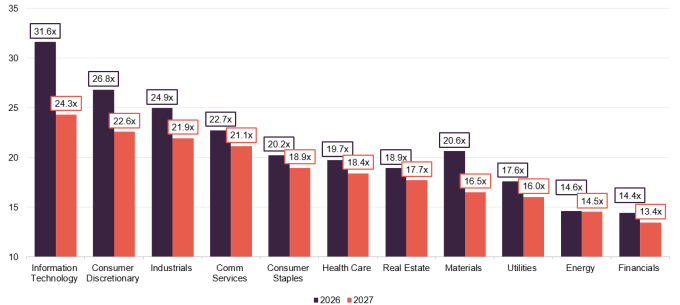
Figure 2: MSCI ACWI sector price/earnings ratios
Source: Bloomberg
PCFT’s managers are more positive about the sector than they have been in years. However, even with rising profits, this optimism is not reflected in financial stock valuations, as shown in Figure 2. This may be because investors remain cautious after the global financial crisis.
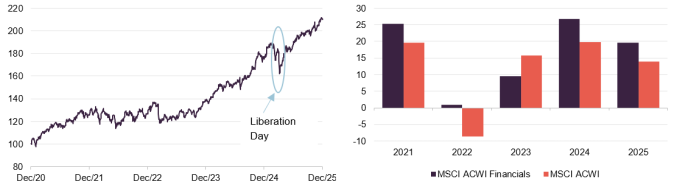
Figure 3: MSCI ACWI Financials
Figure 4: Financials versus global equities
Source: Bloomberg
Source: Bloomberg
Financials should benefit from AI
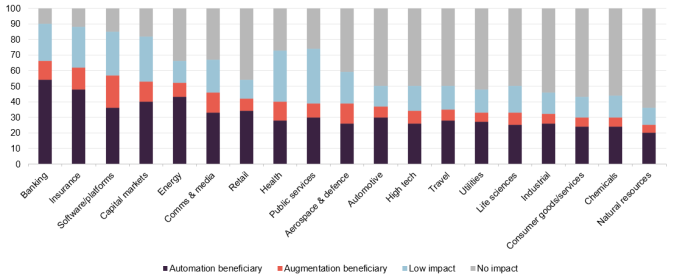
Although tariffs target products rather than services and do not directly affect financial companies’ profits, they have still hurt share prices in the sector, as seen in Figure 3. Financials recovered quickly after “Liberation Day”, but have recently lagged behind a market led by large US AI-focused companies. The managers note this is surprising, as financials could benefit significantly from AI, which is already reducing costs and boosting profits in many firms. Figure 5 presents Accenture Research findings on AI’s impact across different industries – banking and insurance could be best-positioned.
Figure 5: Estimated AI impact by industry
Source: Accenture Research
Q3 results were generally strong, though some areas like property and casualty insurance showed weaker numbers. High profits in insurance are attracting more capital to the sector (the increased competition tends to dilute returns), but the managers see more potential in life assurance companies. They have increased holdings in AIA, Prudential, and Globe Life.
Earlier this year, PCFT benefited from shifting investments from US to European banks. Managers note that moves towards deregulation in both regions should boost profits and allow banks to increase lending, which has been limited recently. Despite recent share price gains, European banks still appear cheap, with a forward P/E of 9.5x and a price to book ratio of 1.3x at November 2025.
Deregulation is becoming a reality
In the UK, the Bank of England confirmed banks passed stress tests and lowered the minimum tier 1 capital requirement from 14% to 13%. The latest budget also avoided new taxes on banks. In the US, consultants Alvarez and Marsal estimate that deregulation could release $2.6 trillion for lending and capital markets activity.
M&A activity is increasing, and the managers believe most deals make sense, with few cross-border or large-cap transactions. They highlight recent US banking deals, such as Fifth Third Bank buying Comerica Bank for $11bn and Huntington Bank acquiring Cadence Bank for $7bn, both at 1.7 times book value.
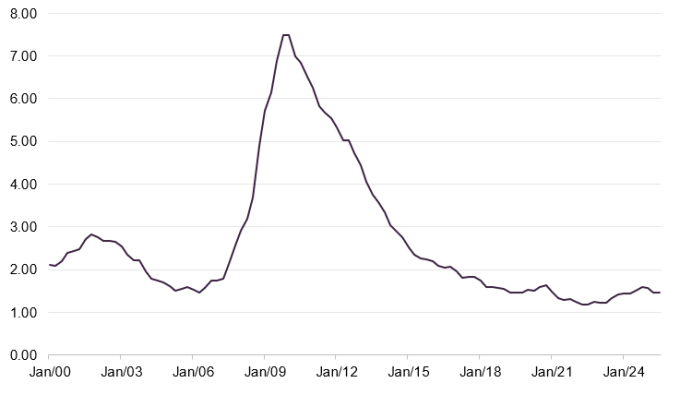
Interest rates are falling, but managers do not expect this to significantly affect interest margins yet. Bad debts remain low, and recent issues in private credit have not had a major impact on banks’ loan books. This is partly due to lending restrictions introduced since the financial crisis. Figure 6 charts the percentage of US loans that are delinquent – where the borrower has missed a payment.
Figure 6: Delinquency rate on all loans, US commercial banks
Source: Federal Reserve Bank of St Louis
Despite recent price declines in the cryptocurrency market, the managers have taken a small position in Coinbase to gain exposure to the crypto and stablecoin market, using the share price weakness as an entry point.
There is a clear trend towards more equity investing, especially in the US, with similar efforts underway in other markets like the UK. Platform business flatexDEGIRO, discussed in our previous note, has doubled in price since PCFT invested.
Investment process
PCFT’s managers focus on picking individual stocks, with geographic and sector allocations reflecting these choices. Historically, the US has offered the best opportunities due to its mature industry and fragmented banking market. However, over the past year, the portfolio has shifted more towards Europe and emerging markets, where valuations are still attractive.
Emphasis on proprietary research
The managers conduct their own in-depth research, which is central to their investment process. While they acknowledge some value in external research, they find it often too focused on the short term and prefer their own analysis.
The managers take a medium- to long-term view and value direct access to company management. Their goal is to find stocks with strong risk-adjusted returns, with balance sheet strength as a key factor.
Focus on limiting the downside
They caution that short-term profits and fast growth can hide asset quality issues, especially as most financial stocks are highly leveraged. Limiting downside risk is a priority.
They caution that short-term profits and fast growth can hide asset quality issues, especially as most financial stocks are highly leveraged. Limiting downside risk is a priority.
The investment universe is global, including emerging markets, and covers about 500 stocks. The smallest considered would have a market cap of around $500m, but most of the portfolio is in companies valued above $5bn. There are no set limits on exposure to smaller or mid-cap firms, but larger companies dominate.
The managers say 500 stocks is a manageable number. While firms like Goldman Sachs and JPMorgan are complex, most banks have straightforward business models. Pricing is often standardised, making research vital to identify quality companies.
A scoring system is used to assess risk, growth, and value by looking at factors like balance sheet strength, funding, loan book quality, and margin trends. This framework guides analysis rather than generating a buy list.
The team meets about 400 companies a year
The team meets around 400 companies annually, mainly to verify research by speaking with customers and competitors.
For banks and similar firms, value is assessed using a version of CAPM, focusing on return on equity and price to book, as price/earnings (P/E) ratios and growth measures are less useful. The sector is evolving, so the managers use a more traditional, earnings-based approach for other types of companies.
Restrictions
The investment manager can invest up to 10% of the portfolio in debt securities.
PCFT may have a small holding in unlisted and unquoted companies, but this should not exceed 10% of total assets at the time of investment.
No more than 10% of total assets will be invested in other listed closed-ended investment companies, and no single investment will usually make up more than 10% of the portfolio at the time of investment.
PCFT may use borrowing to boost returns, with a current maximum limit of 20%.
ESG
ESG factors are built into the investment process, with managers viewing them as key to long-term returns. Governance and risk management are central, shaping how businesses are managed, especially under pressure. The managers use their own ESG process, combining internal research with third-party data, and prepare an ESG summary for each company. This covers governance issues like risk management and strategy, as well as environmental factors such as fossil fuel exposure and communication.
Companies with the lowest ESG ratings, or poor governance scores, are excluded from investment. The analysis also highlights issues for managers to discuss with companies, and ongoing monitoring and engagement are a core part of the approach.
PCFT has an A MSCI ESG rating
As of 30 November 2024, PCFT had an MSCI ESG rating of A and an average ESG score of 6.86, slightly below its benchmark of 6.96. The trust’s holdings have low carbon intensity, reflecting the financial sector. The trust also has a strong voting record, voting against resolutions at over a third of company meetings.
Portfolio – asset allocation
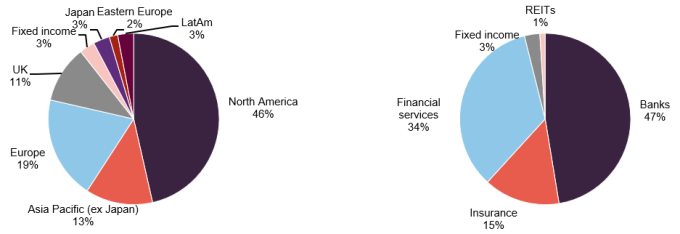
At the end of November 2025, PCFT held 68 positions, down from 77 at the end of April 2025. Its active share compared to the MSCI ACWI Financials Index was 72.9% at 30 November, higher than at the end of April.
Figure 7: PCFT geographic exposure as at 30 November 2025
Figure 8: PCFT sector exposure as at 30 November 2025
Source: Polar Capital Global Financials Trust
Source: Polar Capital Global Financials Trust
PCFT’s geographic allocation has changed notably since our last update (end of April 2025). North American exposure dropped from 51.6% to 46.4%, with most of these assets moved to Europe, which increased from 12.3% to 19.4%. Asia also saw a rise from 10.6% to 12.7%. Sector-wise, there has been a move towards banks, reducing exposure to financial services.
Top 10 holdings
Since our last update at the end of April 2025, Berkshire Hathaway, UniCredit, Barclays, SwissRe, Intercontinental Exchange, and Progressive have left the top 10. They have been replaced by Royal Bank of Canada, BPER Banca, AIA Group, Citigroup, Globe Life, and Erste Group Bank.
Figure 9: Top 10 holdings as at 30 November 2025
| Country/region | Subsector | 30/11/2025(%) | 30/04/2025(%) | Change(%) | |
|---|---|---|---|---|---|
| JPMorgan | United States | Banks | 6.9 | 6.2 | 0.7 |
| Mastercard | United States | Financial services (payments) | 4.1 | 4.8 | (0.7) |
| Bank of America | United States | Banks | 3.9 | 3.3 | 0.6 |
| Visa | United States | Financial services (payments) | 2.9 | 3.8 | (0.9) |
| Royal Bank of Canada | Canada | Banks | 2.8 | 1.8 | 1.0 |
| BPER Banca | Italy | Banks | 2.6 | – | 2.6 |
| AIA Group | Hong Kong | Insurance | 2.5 | – | 2.5 |
| Erste Group Bank | Austria | Banks | 2.3 | – | 2.3 |
| Citigroup | United States | Banks | 2.3 | 0.9 | 1.4 |
| Globe Life | United States | Insurance | 2.3 | 1.7 | 0.6 |
| Total | 32.6 |
Source: Polar Capital Global Financials Trust. Note 1) Percentage of gross assets.
Royal Bank of Canada
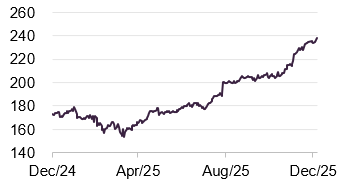
Figure 10: Royal Bank of Canada (CAD)
Source: Bloomberg
Royal Bank of Canada (rbc.com) is the top Canadian bank, with a strong capital position and expanding wealth management in the US and UK. For the year ending 31 October 2025, net income and earnings per share rose 25% from the previous year.
RBC’s 2025 acquisition of HSBC Canada is expected to deliver significant cost savings and extra revenue. The bank spends C$5bn a year on technology to cut costs, boost revenue, and improve its AI capabilities. RBC is aiming for a 16% return on equity by 2027 and annual earnings per share growth of 7%. It plans to keep its dividend payout ratio between 40% and 50%.
BPER Banca
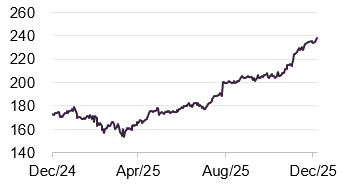
Figure 11: BPER Banca (EUR)
Source: Bloomberg
BPER Banca (bper.it) formerly Banca Popolare dell’Emilia Romagna, has grown through both organic expansion and acquisitions, most recently buying Banca Popolare di Sondrio. It now has a market cap of €21bn. PCFT made a new investment in July 2025.
The bank’s Q3 results beat expectations, with a return on equity of 19.8% and a common equity tier 1 (CET1) capital ratio of 15.1%. Helped by the recent acquisition, net profits for the year to Q3 reached €1.5bn, up nearly 20% year-on-year (or €1.3bn on a like-for-like basis). Despite this year’s share price increase, the shares still trade at less than 10 times earnings.
AIA Group
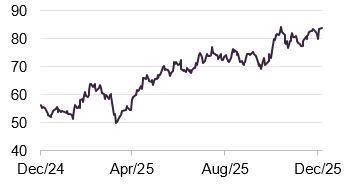
Figure 12: AIA (HKD)
Source: Bloomberg
AIA Group (aia.com) joined the portfolio in June 2025. It is a major life insurer in Asia, with US$328bn in assets as of June 2025, operating in 18 markets across Asia and Australasia. Its joint venture, Tata AIA Life, is the top retail life insurer in India.
In Q3, AIA reported 25% growth in new business, with double-digit growth in 11 out of 18 markets, and improved margins. The company is hiring more agents in China to support its expansion there.
AIA aims for annual operating profit growth per share of 9%–11% from 2023 to 2026 and believes it is on track to meet this target.
Erste Group Bank
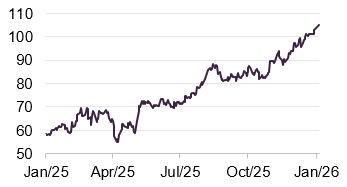
Figure 13: Erste Group bank (EUR)
Source: Bloomberg
Erste Group Bank (erstegroup.com) is one of the largest financial services providers in Eastern Europe by clients and assets.
In 2025, both earnings per share (EPS) and return on tangible equity have grown each quarter. Net interest margins have stayed steady at about 2.4%, while the cost/income ratio has improved. The bank is seeing increases in both customer loans and deposits. Its long-term savings business is also expanding, supported by the George Invest digital platform, which had 11.2 million users at the end of Q3 2025. The bank maintains a strong balance sheet with a CET1 ratio of 17.5%.
Citigroup
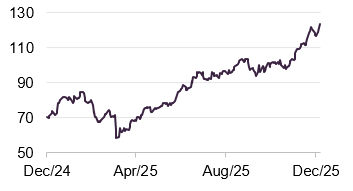
Figure 14: Citigroup (USD)
Source: Bloomberg
Citigroup (citigroup.com) one of the world’s largest banks with a market cap near $220bn, is working to boost profitability by streamlining its business and management. This includes exiting certain markets, such as reducing its stake in Banamex.
In Q3, Citigroup reported a 9% rise in revenue, a 38% increase in adjusted income, and a 48% jump in EPS. Its CET1 ratio at the end of Q3 2025 was 13.2%, about 1.1% above its regulatory minimum. The bank has been returning surplus capital to investors through buybacks and dividends, with buybacks helping drive the EPS increase.
Globe Life
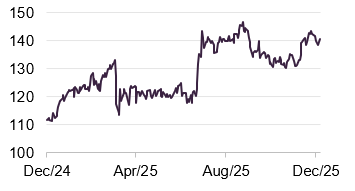
Figure 15: Globe Life (USD)
Source: Bloomberg
Globe Life (globelifeinsurance.com) is a major US life and health insurer, offering products through American Income, Liberty National, Family Heritage, United American, and direct sales. At the end of Q3 2025, life insurance made up 69% of total premiums and health insurance 31%. Life insurance contributed even more to underwriting profit, at 82% compared to 18% from health.
In Q3, Globe reported a 28% rise in net operating income, with net operating income per share up 38% due to share buybacks. Book value per share increased to $93.63 from $83.92 over the year.
Performance
Figure 16 compares the trust’s NAV and share price total returns with the MSCI All Countries World Financial Index over the five years to December 2025. Key factors behind PCFT’s past performance are detailed in earlier notes listed on page 19. After recovering from the tariff announcements in April, both the NAV and share price have risen in recent months, broadly matching the benchmark.
Figure 16: PCFT NAV, share price, and MSCI ACWI Financials five years to 31 December 2025

Source: Bloomberg, Marten & Co
Figure 17: Cumulative total return performance over periods ending 31 December 2025
| 3 months (%) | 6 months (%) | 1 year (%) | 3 years (%) | 5 years (%) | |
|---|---|---|---|---|---|
| PCFT price | 10.5 | 14.0 | 24.7 | 65.5 | 88.3 |
| PCFT NAV | 6.6 | 12.1 | 20.7 | 57.1 | 94.1 |
| MSCI ACWI Financials | 5.0 | 12.0 | 19.7 | 66.1 | 110.2 |
| MSCI AC World Index | 3.3 | 13.3 | 13.9 | 58.0 | 72.5 |
Source: Bloomberg, Marten & Co
Recent performance attribution
The manager supplied us with some performance attribution data that covers the six-month period to the end of October 2025.
Figure 18: Five largest positive contributions to relative returns six months to 31 October 2025
| Average stock weight (%) | Active weight (%) | Stock return (%) | Total attribution (%) | |
|---|---|---|---|---|
| Alpha Bank | 1.98 | 1.96 | 67.1 | 0.76 |
| Fiserv | Nil | (0.56) | (63.3) | 0.58 |
| Bank of Cyprus Holdings | 1.29 | 1.29 | 60.2 | 0.47 |
| Permanent TSB Group Holdings | 0.68 | 0.68 | 93.2 | 0.43 |
| Interactive Brokers | 1.06 | 0.89 | (58.3) | 0.42 |
Source: Polar Capital Global Financials Trust
Strong returns from Alpha Bank, Bank of Cyprus, and Permanent TSB boosted performance against the benchmark. Avoiding or holding less of Fiserv and Interactive Brokers, which underperformed, also helped returns.
Alpha Bank
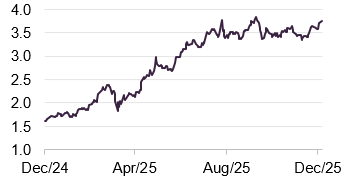
Figure 19: Alpha Bank (EUR)
Source: Bloomberg
Alpha Bank (alpha.gr) is a major Greek bank and a significant emerging market holding for PCFT. UniCredit, a large Italian banking group, recently increased its stake in Alpha Bank to 29.5% and has been the largest shareholder since 2023, following its purchase of the Hellenic Financial Stability Fund’s stake and control of Alpha Bank’s Romanian arm. UniCredit and Alpha Bank are working together to grow Alpha’s business.
Alpha Bank is aiming for annual earnings per share growth of over 10% from 2024 to 2027, supported by share buybacks, and believes it is on track to meet this target.
Figure 20: Five largest negative contributions to relative returns six months to 31 October 2025
| Average stock weight (%) | Active weight (%) | Stock return (%) | Total attribution (%) | |
|---|---|---|---|---|
| Fidelity National Information | 1.54 | 1.28 | (18.6) | (0.56) |
| Robinhood Markets | Nil | (0.47) | 203.8 | (0.48) |
| Intact Financial Corp | 1.41 | 1.16 | (13.6) | (0.37) |
| Axis Capital | 1.72 | 1.72 | (0.3) | (0.37) |
| Intercontinental Exchange | 1.91 | 1.24 | (11.0) | (0.34) |
Source: Polar Capital Global Financials Trust
Fidelity National Information Services
Figure 21: Fidelity National Information (USD)
Source: Bloomberg
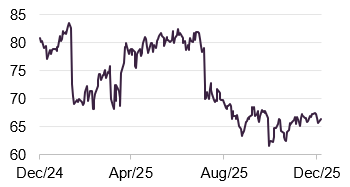
Fidelity National Information Services (fisglobal.com) saw its share price drop sharply after releasing its Q2 results. Investors were likely disappointed that recent revenue growth was mainly due to foreign exchange movements. The decline may also reflect weak results from competitor Fiserv, whose share price fell earlier in the year and dropped further after its Q3 results.
Premium/discount
Figure 22: PCFT’s premium/(discount) over the five years to 31 December 2025
Source: Bloomberg, Marten & Co
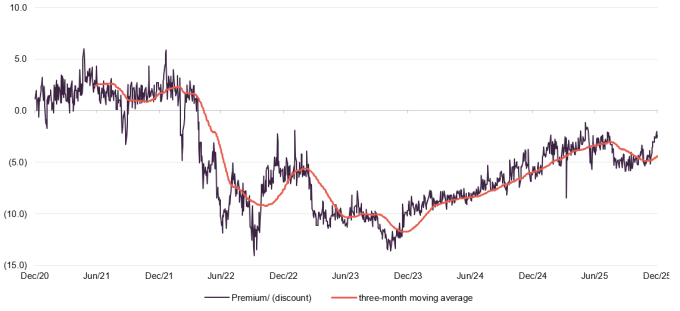
During the 12 months to 31 December 2025, PCFT’s discount ranged from 1.2% to 8.5%, averaging 4.0%. As of 6 January 2026, the discount was 2.1%.
PCFT offers investors an exit opportunity every five years and has a policy to control its discount. If the three-month average discount and the current discount both exceed 5% under normal conditions, PCFT will buy back shares to bring the discount below 5%. These measures should help keep the discount narrow.
Dividend – new enhanced dividend policy
Figure 23: Dividend history – periods ending 30 November
Source: Polar Capital Global Financials Trust
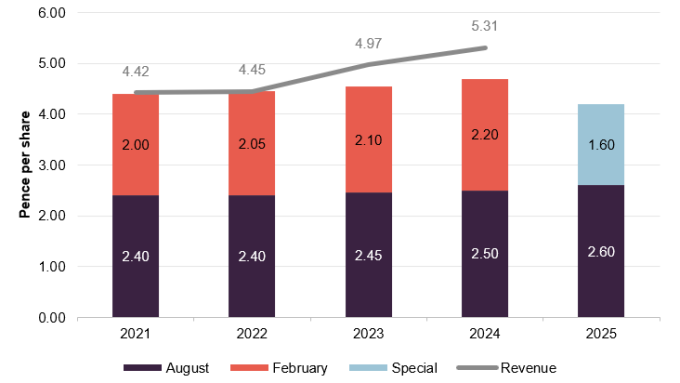
Before its recent exit opportunity, PCFT paid two interim dividends each year, in August and February, following a progressive dividend policy.
From the new financial year starting 1 December 2025, PCFT has moved to an enhanced dividend policy. It now aims to pay a regular dividend of about 4% of NAV each year, unless there are unforeseen events. Dividends will be paid quarterly at 1% of NAV, based on the value at the end of each previous quarter. The first quarterly dividend will be announced in March 2026 and paid in April 2026.
Structure
Fees and costs
PCFT is managed by Polar Capital LLC. From 1 July 2025, management fees are calculated as 50% of NAV and 50% of the lower of market cap or NAV, both on a cum income basis. Polar receives a base fee of 0.70% per year on the first £500m and 0.65% on any amount above this. Either party can end the agreement with 12 months’ notice. The fee is charged 80% to revenue and 20% to income. There is no performance fee. Historically, PCFT’s ongoing costs are 0.85% of NAV.
Capital structure and life
PCFT has a straightforward capital structure with one class of ordinary shares listed on the Main Market of the London Stock Exchange. As of 6 January 2026, there were 162,705,218 ordinary shares with voting rights and 169,044,748 shares held in treasury.
Five-yearly tender offers
PCFT has no fixed end date. The board plans to offer shareholders the chance to sell their shares at a price close to NAV every five years, with the next offer expected in 2030. Shares bought back through these offers or for discount control can be held in treasury and reissued at a premium to asset value.
PCFT’s financial year ends on 30 November, and its AGM is usually held in April.
Gearing
PCFT can borrow up to 20% of its net assets. At the end of November 2025, its net gearing was 7.1% of NAV.
Management
The five-strong global financials team at Polar Capital LLC was managing £404m, as of end October 2025.
Nick Brind
Nick joined Polar Capital after it acquired HIM Capital in September 2010. He is co-manager of PCFT and the Polar Capital Financial Credit Fund. With 29 years’ investment experience across various asset classes, he has specialised in global financials since 2003. Before HIM Capital, Nick worked at New Star Asset Management, where he managed the New Star Financial Opportunities Fund, which invested in both equity and fixed income within the financial sector. Nick has experience managing income securities for European financial companies. He previously worked at Exeter Asset Management and Capel-Cure Myers. He holds a Masters in Finance from London Business School.
George Barrow
George has been co-fund manager of PCFT since December 2020. He joined Polar Capital in 2010 and also co-manages the Polar Capital Financial Opportunities Fund. With 15 years’ industry experience, he has spent over 10 years analysing Europe, Asia, and emerging markets. Before Polar Capital, George was an analyst at HIM Capital from 2008 and completed his IMC. He holds a Master’s in International Studies from SOAS, graduating with merit.
Tom Dorner
Tom joined the team in December 2023 from Aberdeen, where he was a senior investment director in the developed markets team and managed the abrdn Europe ex UK Income Equity Fund. He covered European financials and managed several other European funds over nine years. Before Aberdeen, Tom was an analyst focused on European insurance at Citi and Lehman Brothers in London. He qualified as a Chartered Accountant with Ernst & Young in insurance audit, and holds a BA in War Studies from Kings College London and an MA in Philosophy from the University of Nottingham.
Nabeel Siddiqui
Nabeel joined the Polar Capital Financials team as an analyst in August 2013, working with John Yakas and Nick Brind, and focusing on the US, Latin America, and Australia.
Before this, he was an operations executive at Polar Capital. He started his career in August 2008 at Habib Bank, working in several roles. Nabeel holds a Master’s in Money and Banking and has passed all three levels of the CFA.
Jack Deegan
Jack joined the Polar Capital Financials team as an analyst in October 2017 and now co-manages the Financial Credit Fund with Nick Brind.
Previously, he was a lead analyst at DBRS Ratings, covering Swiss banks and also working on UK, Dutch, Japanese and Australian banks. Before that, Jack spent four years at the Bank of England’s Markets Division, assessing financial institutions for access to the Bank’s Sterling Monetary Framework and setting internal trading limits. He holds a BA in Classical Archaeology & Ancient History from Oxford University and a Master’s in Islamic Politics from SOAS.
Board
The board comprises four non-executive directors, all of whom are independent of the investment manager and who do not sit together on other boards.
Figure 24: Board member – length of service and shareholdings
| Position | Date of appointment | Length of service (years) | Annual director’s fee1 (GBP) | Shareholding1 | |
|---|---|---|---|---|---|
| Simon Cordery | Chair | 1 July 2019 | 6.5 | 46,000 | 42,497 |
| Susie Arnott | Director | 1 December 2022 | 3.1 | 32,500 | 20,000 |
| Angela Henderson | Director | 1 December 2022 | 3.1 | 32,500 | – |
| Cecilia McAnulty | Chair of the audit committee | 1 November 2021 | 4.2 | 38,250 | 40,000 |
Source: Polar Capital Global Financials Trust. Note 1) last available information as at 30 November 2024.
Simon Cordery (chair)
Simon has been a director since 2019 and became chair of PCFT in March 2023. He brings over 40 years’ experience in financial services, with nearly 30 years in wealth management. He spent almost 25 years at BMO Global Asset Management, most recently as head of Investor Relations and Sales, and has also worked at Invesco Fund Managers, Jefferies & Co, Kleinwort Benson Securities, and Rea Bros Merchant Bank. Simon has strong knowledge of the investment trust sector and remains active with the AIC. He is a Chartered Fellow of the Chartered Institute for Securities and Investment.
Susie Arnott (non-executive director)
Susie has over 20 years’ experience in fund management, mainly in the financial sector, with a focus on emerging markets and global financial portfolios. She has also worked in impact investing, combining her expertise with a passion for social investment and measuring impact. In her current role, Susie continues to focus on investments with global impact, making ESG a key part of her approach.
She is a director of Sableknight Limited and Lockfold Communications.
Angela Henderson (non-executive director)
Angela began her career as a solicitor in corporate law before moving into financial services, working as an in-house lawyer and director of global equities. She has invested in and held non-executive board roles at small UK technology and asset management firms, and previously served on the governing body of a London hospital foundation trust. Angela is now a non-executive director and chair of risk at Macquarie Capital (Europe) Limited, and also chairs the Management and Service Provider Engagement Committee at Hargreave Hale AIM VCT Plc and Wells Fargo Securities Limited. She has other private interests as well.
Cecilia McAnulty (chair of the audit committee)
Cecilia McAnulty is a Chartered Accountant and experienced non-executive director with nearly 30 years in investment and financial services. She held senior investment roles at Royal Bank of Scotland, Barclays Capital, and Centaurus Capital, working across public and private debt and equity.
Cecilia is currently audit chair at Northern 2 VCT Plc, and a non-executive director at RIT Capital Partners Plc and Eurobank Cyprus Limited.
SWOT/bull versus bear analysis
Figure 25: SWOT analysis for PCFT

| Large, experienced team dedicated to the strategy |
| One-stop-shop for diversified financials exposure |
| Attractive structure with strong discount control measures |

| Five-year performance lags performance benchmark |

| Sector appears to be performing well but stocks are cheap relative to other sectors |
| Regulation is being eased, which should boost profitability |
| Opportunity to cut costs by using AI |

| Interest rates are falling, which could affect sentiment towards sector |
| Risk of rising defaults after an extended period where these have been low |
Source: Marten & Co
Figure 26: Bull vs bear case for CGT


| Performance | Sector is cheap and backdrop supportive | A weaker economy/falling market could bring down the sector with it |
| Dividends | New 4% of NAV distribution policy for income-seeking investors | Dividends will fluctuate with NAV and eat into capital if the NAV falls |
| Outlook | The sector’s prospects look bright | Sentiment still seems to be against the sector and investors nervous – muscle memory of the GFC is still there |
| Discount | Shares have been trading within discount target, loose shareholders exited earlier this year, and buying could drive it down to asset value | No real downside as long as board sticks to discount control policy, and no reason why it shouldn’t |
Source: Marten & Co
Previous publications
QuotedData has published a number of notes on PCFT. You can read these by clicking the links in the table below or by visiting the QuotedData.com website.
| Don’t fear a slowing economy | Initiation | 30 April 2019 |
| Banks too cheap to ignore | Update | 29 October 2019 |
| New lease of life | Update | 22 February 2020 |
| Too much pessimism? | Annual overview | 22 October 2020 |
| The tide has turned | Update | 25 February 2021 |
| More to go for | Annual overview | 18 November 2021 |
| Riding out the storm | Update | 5 April 2022 |
| Don’t fear the dog that is yet to bark | Annual overview | 30 November 2022 |
| Avoiding mishap | Update | 7 June 2023 |
| Pessimism overdone, time to buy | Annual overview | 12 December 2023 |
| Handful of themes to drive performance | Update | 13 June 2024 |
| Taking advantage of a favourable landscape | Annual overview | 12 December 2024 |
| An entry as well as an exit opportunity | Update | 22 May 2025 |
IMPORTANT INFORMATION
Marten & Co (which is authorised and regulated by the Financial Conduct Authority) was paid to produce this note on Polar Capital Global Financials Trust Plc.
This note is for information purposes only and is not intended to encourage the reader to deal in the security or securities mentioned within it. Marten & Co is not authorised to give advice to retail clients. The research does not have regard to the specific investment objectives financial situation and needs of any specific person who may receive it.
The analysts who prepared this note are not constrained from dealing ahead of it but, in practice, and in accordance with our internal code of good conduct, will refrain from doing so for the period from which they first obtained the information necessary to prepare the note until one month after the note’s publication. Nevertheless, they may have an interest in any of the securities mentioned within this note.
This note has been compiled from publicly available information. This note is not directed at any person in any jurisdiction where (by reason of that person’s nationality, residence or otherwise) the publication or availability of this note is prohibited.
Accuracy of Content: Whilst Marten & Co uses reasonable efforts to obtain information from sources which we believe to be reliable and to ensure that the information in this note is up to date and accurate, we make no representation or warranty that the information contained in this note is accurate, reliable or complete. The information contained in this note is provided by Marten & Co for personal use and information purposes generally. You are solely liable for any use you may make of this information. The information is inherently subject to change without notice and may become outdated. You, therefore, should verify any information obtained from this note before you use it.
No Advice: Nothing contained in this note constitutes or should be construed to constitute investment, legal, tax or other advice.
No Representation or Warranty: No representation, warranty or guarantee of any kind, express or implied is given by Marten & Co in respect of any information contained on this note.
Exclusion of Liability: To the fullest extent allowed by law, Marten & Co shall not be liable for any direct or indirect losses, damages, costs or expenses incurred or suffered by you arising out or in connection with the access to, use of or reliance on any information contained on this note. In no circumstance shall Marten & Co and its employees have any liability for consequential or special damages.
Governing Law and Jurisdiction: These terms and conditions and all matters connected with them, are governed by the laws of England and Wales and shall be subject to the exclusive jurisdiction of the English courts. If you access this note from outside the UK, you are responsible for ensuring compliance with any local laws relating to access.
No information contained in this note shall form the basis of, or be relied upon in connection with, any offer or commitment whatsoever in any jurisdiction.
Investment Performance Information: Please remember that past performance is not necessarily a guide to the future and that the value of shares and the income from them can go down as well as up. Exchange rates may also cause the value of underlying overseas investments to go down as well as up. Marten & Co may write on companies that use gearing in a number of forms that can increase volatility and, in some cases, to a complete loss of an investment.