
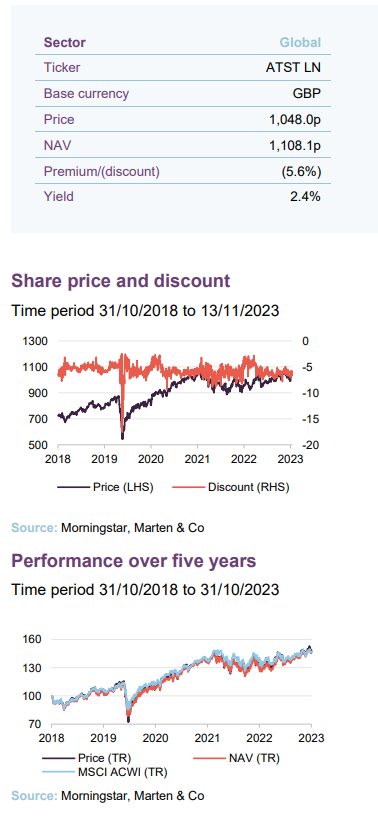
Alliance Trust
Investment companies | Annual Overview | 15 November 2023
Coming into its own
Thanks in no small part to Alliance Trust’s (ATST) diversified blend of active managers, the trust’s performance has been ahead of global equities over multiple time frames. ATST has been able to capture benefits of the major sentiment shifts in global equities over the last five years. This sets it apart from its wider peer group, where the presence of strategies with strong stylistic biases meant that the median return of this group has not kept pace in recent years.
ATST’s manager, Willis Towers Watson, has recently added a dedicated Japanese small-cap value manager Dalton to the roster. The intention is to not only to capitalise on Dalton’s long history of successful active management, but also to capture the tailwinds supporting Japan’s equity market. These are the result of an improving alignment between corporate management and shareholders, thanks to governance reforms, and more favourable macroeconomic conditions.
Global stock-picking portfolio
Alliance Trust aims to be a core equity holding for investors that delivers a real return (after adjusting for inflation) over the long term through a combination of capital growth and a rising dividend. It invests primarily in global equities across a range of industries and sectors via a ‘manager of managers’ approach. This is intended to reduce the risk often taken by investors selecting a single, star manager or one particular style that can move in and out of favour.
Fund profile
Alliance Trust (ATST) aims to be a core equity holding for investors that delivers a real return over the long term, through a combination of capital growth and a rising dividend. The company invests primarily in global equities across a wide range of industries and sectors. The investment manager, Willis Towers Watson (WTW), has appointed a number of stock pickers with different styles, who each ignore the benchmark and only buy a small number of (around 20) stocks in which they have strong conviction. For performance measurement purposes, the trust is benchmarked against the MSCI All Countries World Index in sterling terms (MSCI ACWI). The board also monitors ATST’s returns relative to similar investment companies.
“a core equity holding for investors that delivers a real return over the long term”
Given ATST’s highly diversified approach, it can be viewed as a ‘core’ investment allocation, whereby it is a strong reflection of the wider global equity markets, albeit through the lens of active management.
ATST has a long history dating back to 1888, although the current ‘manager of managers’ investment approach is much newer, having been adopted with effect from 1 April 2017. ATST is an AIC Dividend Hero, having increased its dividend in each of its last 56 financial years.
Market backdrop
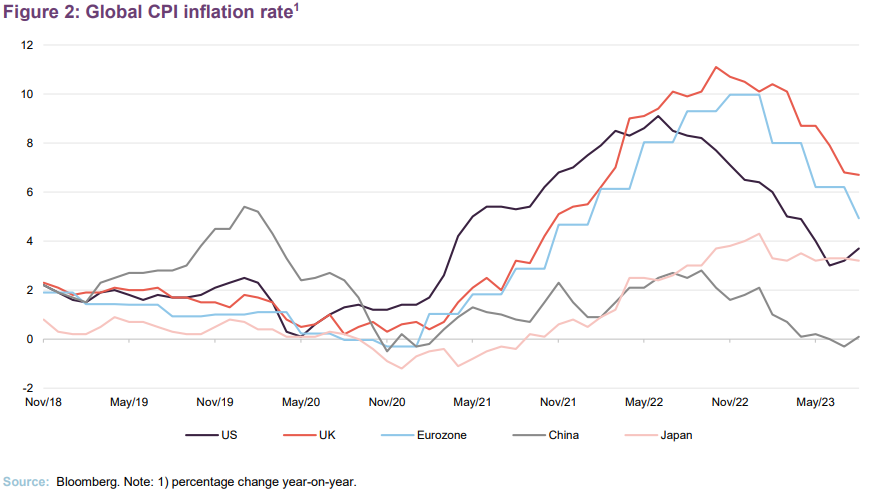
When we published our last note in November 2022, equity markets were being driven by concerns around global inflationary pressures and rising interest rates as central banks sought to take heat out of their economies and bring rising prices back under control. The question was one of how much pain central banks would need to inflict in order to rein in inflation, and whether these measures would tip the global economy into recession.
Longer duration assets such as growth stocks, which have a high proportion of their value discounted from some point in the future, have found themselves at the sharper end of the sell-off. Investors have rotated towards more value or defensive stocks, or have pulled money out of equities in favour of fixed income, which is now offering better returns than have been seen since the GFC.
Today we seem to be on a teetering point; while some of the past concerns have alleviated, we are still facing a mixed bag of economic data muddying the economic waters. The question now is whether the global economy can continue to sustain largely low growth rates, in the face of the painful combination of tighter labour markets and declining manufacturer confidence. Pundits continue to debate whether the world will see a ‘soft’ or ‘hard’ landing.
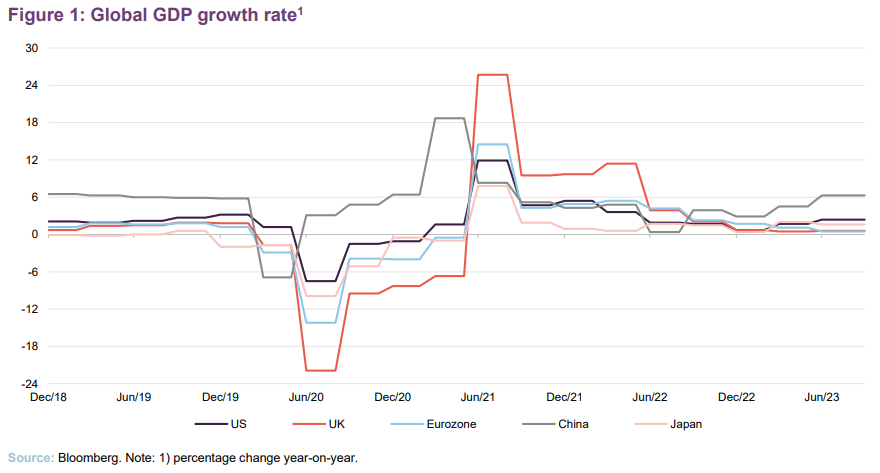
As yet, in the UK, we have thankfully dodged a recession, with recent Q1 GDP figures being revised upward to 0.3%. While our growth figures are improving, a sub-2% annual GDP growth rate would still be considered meagre.
Nor should a positive GDP and upward revision be a signal that the UK’s future is secure. UK PMI, a figure used to determine the manufacturing sector outlook, has remained below 50 since March 2023, indicating an expected contraction in manufacturing activity, and would fall subsequently each month thereafter, only being revised upward in August. August’s figure of 44.2 is one of the weakest readings we have seen in the last 14 years. The UK is also contending with a tight labour market, with a 4.3% unemployment rate making it one of the tightest in the last two decades. This has already fed into wage increases, with the UK reporting an annual earnings growth rate of 8.5%.
Nevertheless, analysts are predicting that UK interest rates will peak below 6%, likely somewhere between 5.5% to 5.75%, which may imply only one further rate increase from the current 5.25% level.
Europe seems to also be in a comparable state. While its GDP expectations have also improved, albeit to a lesser extent than the UK’s, it is also contending with a weakening outlook from its manufacturing sector, with its 43.4 PMI reading for September even weaker than the UK’s. The Eurozone’s unemployment rate of 6.4%, while not as positive as the UK’s, is still the lowest on record. However, there is a wide dispersion of employment figures within the continent, with Germany reporting a 3% unemployment rate compared with Spain’s 11.5%.
Japan seems to be having an easier run of things, with a stronger PMI of 48.5, and an annual GDP growth rate of 1.6% (low by global standards but broadly in line with its long-term average). Inflationary pressures are starting to finally creep into its economy and investors are hoping that the Bank of Japan will tighten policy, to the benefit of its banking sector and the yen, which has been extraordinarily weak.
China, once the engine of global GDP growth, has seen its growth rate disappoint, with its recent annualised growth rate of 6.3% (for Q2 2023) falling short of the 7.3% consensus. Its much-lauded post-lockdown recovery has fallen short, as domestic consumption has not met expectations. A dark cloud is also forming over China’s equity markets, as the spectre of large-scale defaults in China’s property sector have returned. These fears have been compounded by falling industrial output, as a weaker global economy weighs on demand for Chinese exports and manufacturers continue to diversify supply away from China. COVID-19 laid bare the overreliance of the developed world on China as an exporter.
Faced with the prospect of dealing with the consequences of the first true material economic downturn within the region since it joined the World Trade Organization, there seems to be increased impetus within the Communist party to revitalise its economy. China also has far fewer inflationary pressures to deal with, thanks in part to its muted recovery.
However, the most pressing question is: what is the outlook for the US? The Federal Reserve’s (Fed) policy is key to setting global expectations.
Economically, the US seems to be in a strong position, thanks in part to the Biden administration implementing one of the most supportive fiscal packages in living memory last year. The Inflation Reduction Act is still working its magic on the US economy and will act as a potent tailwind for the region for some time yet. Consequently, US GDP growth is higher than other developed markets, with an annualised growth rate of 2.1% for Q2 2023, and its PMI has increased to 49.8 for September. The US labour market has also shown impressive resilience, unexpectedly adding 336,000 new jobs in September, leaving its unemployment rate at 3.8%, just above its four-year low of 3.4%. However, all of this has reignited fears of further rate hikes and driven up long-term bond yields.
The US is also facing the potential fallout from a paralysed Congress, which could lead to a government shutdown (if a deal is not reached, there will not be funding in place to meet certain government obligations, dramatically increasingly the possibility of a debt default) in the coming days if a long-term funding proposal is not agreed.
In its most recent announcement, the Fed has paused its interest rate hiking, keeping US interest rates stable at 5.25% to 5.5% range, but it has signalled that it could foresee another 0.25% rate rise being necessary before the end of the year – something which seems ever-more likely, given the recent positive jobs data.
Déjà vu?
Recent macroeconomic activity has not been the only driver of global equity markets over 2023. Industry specific factors have at times superseded economic pressures. While the notion of rapidly rising inflation and high interest rates is new to younger investors, some of the current influences on equity markets will seem much more familiar. Just as we were talking about the dominance of the FAANG stocks on global equity returns throughout 2018, 2019 and 2020, today we are talking about the impact of the “magnificent seven”, a soubriquet that captures seven US listed mega-cap technology-focused stocks that have been dominating the US equity market returns, and by extension the returns of the global equity markets. This cohort, consisting of Apple, Microsoft, Amazon, Meta, Nvidia, Tesla, and Alphabet, saw major share price uplifts over 2023, due to investors seeking safety in companies that could demonstrate strong earnings, but also to the frenzy around the advances in artificial intelligence (AI), with many of these companies being one of the few practical ways investors could access this directly.
Mega cap tech has returned to the forefront
For regular readers of our research on ATST, this narrow leadership may be a cause for concern, as ATST’s highly diversified approach has meant that it has previously lagged global equities during the years of FAANG dominance. Yet this time it does seem to be different. For one, the rally behind the magnificent seven has not influenced other equity markets, with Europe and Japan having seen a much broader based appreciation in share prices. Even on a sector level, energy and select financial stocks have seen renewed interest on higher oil prices and higher interest rates benefitting banks’ margins. Unfortunately, the collapse of Silicon Valley Bank and others tempered enthusiasm for the banking sector.
Investment process – ‘manager of managers’
WTW has secured access for ATST to some of the world’s best stock pickers
The investment approach can be summed up as that of a ‘manager of managers’. WTW allocates the trust’s capital to a number of separate specialist accounts, managed on a committed basis by some of the world’s best stock pickers.
In adopting this style of investing, the board sought to avoid being beholden to the success of a single manager or particular investment style. Instead, individual investors in ATST get to profit from the expertise of a range of managers, many of which they would not be able to access in any other way.
WTW has the muscle to secure good deals for ATST
If poorly designed, this style of investing can result in over-diversification and can be expensive, as fees are layered on fees. This is where WTW earns its keep. It has a substantial manager research team keeping track of managers across the globe. It manages over $163bn (as at the end of December 2022) of delegated assets, giving it the wherewithal to negotiate access to top-flight managers at attractive fee levels on behalf of ATST. A core part of its role is to manage ATST’s risk exposures.
20-stock portfolios
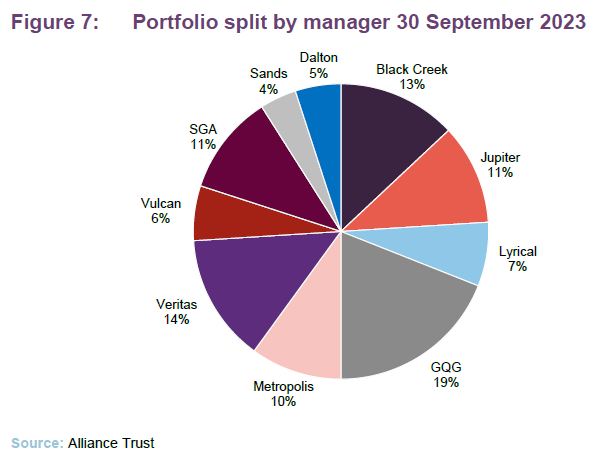
The underlying managers (described in more detail on pages 13 to 16) each run portfolios of up to 20 stocks, comprising the managers’ best ideas. At the outset, ATST’s portfolio was divided between eight managers, running nine separate portfolios. Today the trust uses 10 managers, across 11 portfolios. While the managers are typically chosen for their dedicated investment styles, with some having clear biases to certain regions, one portfolio is formally restricted to investing solely in emerging markets, while the remainder are free-ranging go-anywhere funds. However, in WTW’s experience, their managers have a natural bias towards developed markets, so the dedicated emerging markets portfolio helps redress this.
WTW looks for individuals with a long track record, across multiple investment cycles, usually established while working in large organisations. Commonly, these individuals will then set up on their own or move to a boutique.
The underlying managers should be in control of their own destiny and free to take a long-term view
It is important to WTW that the managers are in control of their own destinies – in other words, that they are not under pressure to grow assets under management or forced to fixate on short-term performance. The managers should invest with a long-term time horizon. Typically, their turnover will be in the 20% to 40% range per annum, equating to a 2.5yr to 5yr holding period. The managers think about risk in terms of permanent loss of capital rather than performance relative to benchmark indices.
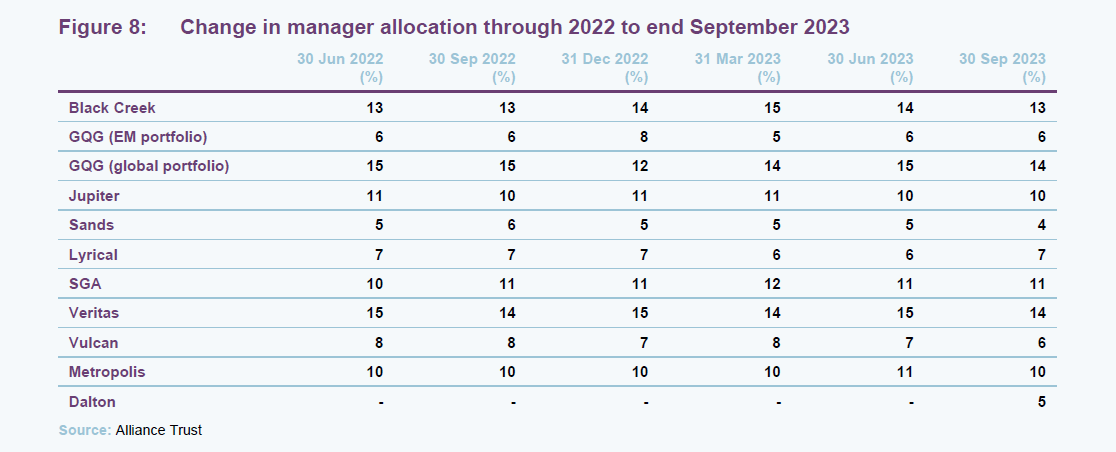
At any point, WTW will have a list of 20–30 managers that would be suitable for managing a part of ATST’s portfolio. Initially, managers will be allocated between 7% and 14% of ATST’s portfolio (though one manager, GLG, runs two portfolios, and this has a greater than 20% allocation). WTW will rebalance the overall portfolio fairly frequently, but managers will be evaluated over the long term and replaced relatively rarely.
Whilst three managers have fallen out of ATST’s portfolio since its launch, none have been removed due to performance concerns, but rather issues with the management companies themselves, such as being subject to buyouts. Three new managers have been added to replace them: Sands Capital, Dalton, and Metropolis Capital.
The day-to-day role
Target equal risk-weighted exposures
Portfolio construction starts from a premise that each manager will provide the same risk-weighted exposure. A large part of WTW’s day-to-day role involves monitoring the portfolio’s risk exposures and keeping tabs on what the underlying managers are doing. WTW has quarterly update calls with all the managers, but this represents the bare minimum of contact. They are usually talking to them much more frequently.
Stress-test assumptions
Part of the role is to stress-test the managers’ assumptions, making sure that they are doing their job properly and not falling into behavioural traps, for example.
There is a low degree of overlap between the underlying portfolios. The nature of the approach means that the overall portfolio has a high active share by comparison with the MSCI ACWI, currently 74% (as of 30 September 2023). However, WTW attempts to manage the beta within a fairly narrow (0.9–1.1) range.
A monthly investment committee reviews the portfolio’s factor risk exposures. The aim is to have a natural balance of risk, and the allocation to the underlying managers will be adjusted if necessary. As an example, from a style point of view, Jupiter has both a value and small-cap bias.
Naturally underweight the very largest companies
The aim is to be style-neutral. However, the portfolio will have a natural underweight to size and a small underweight exposure to the very largest ‘mega-cap’ companies. Otherwise, the trust should have a fairly neutral exposure to industries and regions relative to the MSCI ACWI.
Investing sustainably and responsibly
Sustainability themes can have real impacts on returns and risks
The board and manager have a strong view that sustainability themes can have real impacts on returns and risks. The effects of climate change and the policy responses to this threat are one example of this. The board expects the underlying managers to be aware of the need to factor such concepts into their decision-making. ATST’s portfolio has 29% lower carbon emissions per $1m invested than the MSCI ACWI (based on an analysis conducted as at 31 December 2022).
The board has not imposed any restrictions on the sectors that the managers can invest in, beyond an outright ban on holding companies that manufacture armaments made illegal under international law via the Inhuman Weapons Convention, and those weapons covered by standalone conventions.
Lower climate-related risk than an ETF
ATST has committed to achieving net zero (based on the emissions of its underlying assets) by 2050 at the latest, with an interim target of achieving a 50% reduction of emissions by 2030, relative to 2019. ATST’s focus on reducing its exposure to risks associated with sustainability themes should mean that its portfolio exhibits lower climate-related risk than an index-tracking exchange traded fund (ETF) mirroring the MSCI ACWI.
Engaging with companies can contribute to their long-term success
ATST is not an activist fund, but the board and the manager take their stewardship responsibilities seriously. They believe that, by engaging with the companies in which ATST invests, the trust can contribute to their long-term success; help reduce the negative impacts that they may have on the environment and society; and manage downside risks.
In support of that objective, WTW has engaged EOS at Federated Hermes (EOS) to advise on voting for the trust’s shareholdings. The underlying managers who hold the votes are not obligated to follow EOS’s advice; however, they must explain their reasoning if they diverge. EOS has adopted the UN Principles for Responsible Investment, as have WTW and all ten of Alliance Trust’s underlying managers. Alliance Trust discloses aggregated data on voting of the shares it holds and examples of engagement activity undertaken by EOS on its behalf in its annual reports.
EOS acts for many other investors and the combined might of these gives it more influence with companies. Over the course of 2022, EOS engaged with 103 companies within ATST’s portfolio on 493 issues and objectives, 27% concerned environmental issues.
Investment restrictions
ATST operates with a number of investment restrictions as follows:
- No single investment may exceed 10% of the trust’s total assets at the time of investment.
- Where market conditions permit, the trust will use gearing of not more than 30% of its net assets at any given time.
- The trust can use derivative instruments to hedge, enhance and protect positions, including currency exposures. However, in practice the manager makes no attempt to hedge currencies or markets.
- Whilst the primary focus of the trust is investment in global equities, the trust may also invest from time to time in fixed interest securities, convertible securities and other assets.
Asset allocation
ATST’s asset allocation is driven largely by the stock selection decisions taken by the underlying managers. However, WTW is able to adjust the allocations to each manager where it sees fit. This could be with the aim of generating additional alpha, or to improve diversification.
Relative to the MSCI ACWI, at the end of September 2023 the portfolio had a strong bias to the UK and was underweight to North America. This is in part due to the delegated managers’ decision-making, but also due to WTW’s allocation to Jupiter, which has a strong allocation to UK equities.
ATST has increased its Japan exposure
WTW has increased ATST’s allocation to Japan and the trust now has a slight overweight to the country, relative to its benchmark. WTW believes that the ever-improving corporate governance regime is a powerful structural tailwind for Japanese equities. Sizable excess cash and other low-returning assets held on corporate balance sheets are beginning to work their way into the hands of shareholders. The recent reform that Japan made to its listing rules was the catalyst for the shift in ATST’s Japan allocation and its addition of Dalton to its manager line up.
WTW also views the yen as being an undervalued currency, which should act as a tailwind to overseas investors in Japan, regardless of the investment style. To capitalise on this opportunity, WTW has added Dalton to its roster of managers, a team that is well primed to capitalise on the governance tailwinds, which we describe on page 16.
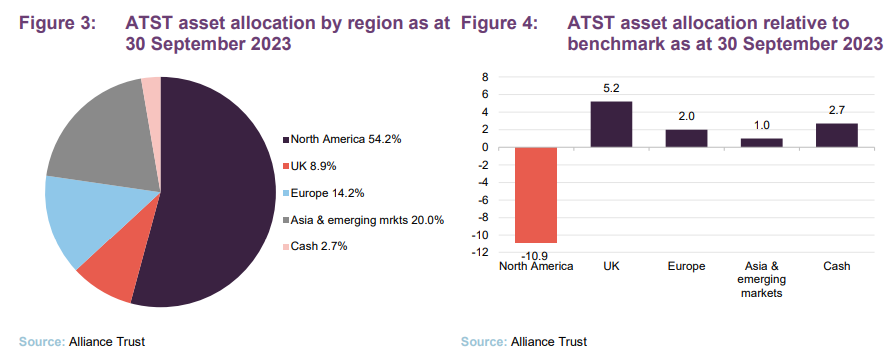
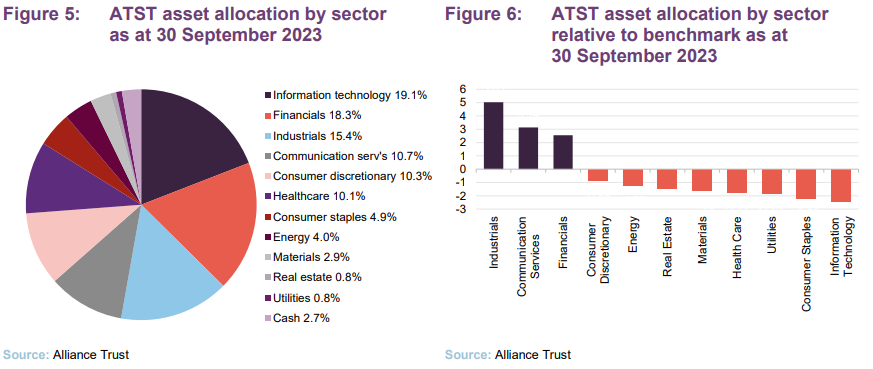
ATST’s geographical allocations in part reflect its sectoral allocations – the portfolios large underweight to the US is in part a function of its underweight to technology, which is a key part of that market. ATST is also overweight both financials and industrials as well as the UK, with those sectors being a significant component of the UK market.
The managers
The lead manager working on ATST’s portfolio is WTW’s CIO, Craig Baker. He chairs the investment committee, which includes Stuart Gray and Mark Davis. Between them, they have over 65 years of investment experience. They are backed up by a team of 160 global research associates (as at end June 2023).
Black Creek
Global leaders
This portfolio is managed by Bill Kanko, founder and president of Black Creek Investment Management. He focuses on global leading businesses (typically ranked first or second in their niche), that are taking market share rather than resting on their laurels, and that are misunderstood or misinterpreted by the market. The approach is essentially a contrarian one – buying stocks that are out of favour. Fundamental analysis, taking a long-term (five-to-10-year) view, and extensive due diligence all have a central role in the investment process.
GQG
Quality growth
Rajiv Jain runs both a global portfolio and ATST’s dedicated emerging markets portfolio, and is supported by Brian Kersmanc and Sudarshan Murthy. Rajiv founded GQG Partners in June 2016 and is its chief investment officer. GQG stands for global quality growth, which sums up what the manager is looking for in an investment. Quality is represented by factors such as strong balance sheets, businesses with high barriers to entry, and good management aligned with investors. Value is assessed based on long-term earnings potential. An analysis of the macroeconomic situation helps inform this. Rajiv acknowledges that there are periods where a focus on quality will mean that you lag markets – notably in exuberant markets where investors favour riskier investments.
Jupiter
Contrarian value in solid companies
Jupiter Asset Management’s Ben Whitmore may be one of the managers who is more familiar to UK-based investors. He has been working at Jupiter since 2006, following a long spell at Schroders. He adopts a contrarian value approach to managing money, but the companies that he invests in should also have prominent franchises, sound balance sheets and be cash generative. Stocks are screened based on their long-run (10-year) average earnings and also on the returns that they generate on their operating assets. Although he is running a high-conviction portfolio, Ben is conscious that he wants to end up with a diverse set of stocks.
Lyrical
Fundamental value
The portfolio managed by Lyrical Asset Management is overseen by Andrew Wellington. It is a fundamental value investor, looking to buy businesses at a discount to their true value. It screens the 1,000 largest US stocks using a range of value measures and then undertake more intensive research on those that pass the screen. Lyrical favours companies with good returns on invested capital and avoids overly complex businesses. The firm says that the breadth of opportunities available to it is quite narrow and so it is ideally suited to running concentrated portfolios.
SGA
Quality growth
The Sustainable Growth Advisers (SGA) sleeve is run by HK Gupta, Kishore Rao and Rob Rohn. They are looking for high-quality companies that also have strong growth. These companies have pricing power and predictable, recurring revenues. They then determine whether these stocks are trading at attractive valuations before making an investment.
Veritas
Steady growth
Andy Headley is the head of global strategies at Veritas Asset Management and the lead manager on this part of ATST’s portfolio. He is looking for companies that have long-term sustainable advantages that enable them to grow their cash flows over long periods of time. These stocks often grow steadily rather than in bursts and these steady-growth companies perform well when markets are nervous or falling. Veritas looks out for recovery situations as these present opportunities to buy stocks cheaply. It first seeks to identify quality businesses, then evaluate whether the stock is attractively valued. Veritas is prepared to sit on cash until the right opportunity presents itself.
Vulcan
Value in solid companies
The lead manager on Vulcan’s portfolio is C.T. Fitzpatrick, the CIO at Vulcan Value Partners. Mostly focused on large-cap stocks, it looks for companies where it believes there is a margin of safety between the value the market is attributing to the company and its intrinsic value. These companies tend to have strong balance sheets and high levels of recurring cash flow – making them easier to value in their opinion. Vulcan is a contrarian investor and is used to running very concentrated portfolios, typically around 14 stocks, believing that the opportunity set is limited, and it is not worth compromising on its investment criteria to achieve a more diversified portfolio. It is also a patient, long-term investor, with a time horizon of at least five years. The approach is to identify companies that it would like to own and then wait for a value opportunity to present itself.
Sands Capital
Sustainable, structural growth
The lead managers on Sands Capital’s portfolio are Dave Levanson and Sunil Thakor. Based in Arlington, Virginia in the US, Sands follows a pure growth-orientated philosophy which is rooted in the belief that over the long term, a company’s share price appreciation follows the earnings power and the growth of the underlying business. The firm focuses on finding high-quality, wealth-creating growth businesses using a fundamental, bottom-up research approach, with the view that these businesses will have higher long-term growth than the market. Sands focuses on the sustainability of a business’s future earnings growth, and belief in which companies are benefiting from structural change and secular trends – distinct from cyclical economic factors – that provide select industries and businesses with powerful growth tailwinds.
Metropolis Capital
A private equity approach to investing
Metropolis Capital has a value-focused investment style that draws upon the approaches and methodologies of Warren Buffett. It searches for businesses with strong franchises in their particular markets but which have fallen out of favour with the market because of perceived short-term problems or market risk. Metropolis is long-term-focused and considers each investment as if buying the whole business, which involves a deep, private equity style of due diligence on the business, management quality and risks. The firm seeks out companies with strong cash flows and balance sheets that are easy to understand and have enduring moats as well as management teams that have a significant stake in the business.
Dalton Investments – ATST’s newest manager addition
Japanese small cap value
Dalton Investments is the newest entry to ATST’s roster of managers and its delegated portfolio is headed up by its founder Jamie Rosenwald, who worked with industry titans such as George Sorors before setting up Dalton. Though Dalton has offices across the world, it is headquartered in Los Angeles. Dalton currently manages $3bn in assets and its strategies are typically reserved for the most professional of investors, such as endowments, pensions, and family offices. It does, however, run a single investment trust, Nippon Active Value, which we discuss below.
Dalton’s approach to investing has a heavy bias to value stocks, albeit with a sufficient eye for quality not to fall into the dreaded ‘value trap’, buying cheap companies which lack the capacity to see a positive re-rating, e.g. structurally impaired industrial stocks. Capital preservation is also a key concern across all of their investment strategies, with the team aiming the ensure that its investments offer it a ‘margin of safety’.
Dalton has a long history with Japanese equites
Within ATST, Dalton manages a dedicated Japanese equity sleeve, with the firm having a long history of Japanese equity investing. Typically speaking, Dalton will focus on the small-cap value segment of Japan’s equity market, looking for the best opportunities as a value-focused investor, though there is no specific sector preference.
When it comes to selecting Japanese equities, Dalton has a team on the ground in Tokyo to meet with companies. As important as conventional financial analysis is, Dalton also wants to evaluate other elements such as the corporate environment, the quality of employees, and the general entrepreneurial spirit amongst a company’s workforce. While these can be hard to quantify, Jamie believes that these elements are paramount in ensuring a company can generate above-market growth, with his preference being for owner-operator companies, as these are often the hungriest for growth. Despite the physical gulf between Japan and LA, Jamie will not sign off on a new investment until he has personally met with a company’s management team.
Dalton capitalises on the structural improvements in Japanese corporate governance
Dalton also runs a UK-listed Japanese small cap investment trust, Nippon Active Value Fund (NAVF). Although these strategies share the same heritage, NAVF is ostensibly an activist strategy, while the ATST portfolio is more of a conventional long-only strategy. Reflecting this, there is limited overlap between NAVF’s portfolio and the holdings in ATST’s sleave, with the latter being a better reflection of the potential of Japanese equity market as a whole.
Top 10 holdings
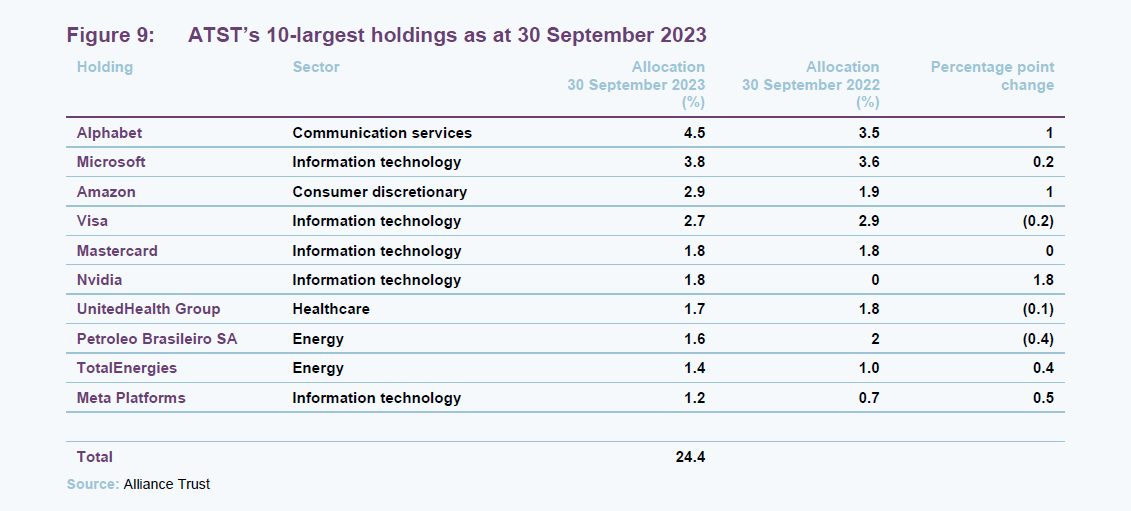
As we have discussed previously, for a portfolio such as ATST’s, where every stock is a best idea, an analysis of the top 10 holdings is perhaps less insightful than it would be for most other trusts. Arguably reflecting the trend towards lower turnover approaches within the underlying managers, many of the mainstays of older notes are still present today, such as Visa, Petrobras, and UnitedHealth. However, there has been a clear shift towards technology stocks since our last note.
We think that a key driver of this has been the enormous momentum behind the tech sector of 2022-23, through a combination of strong earnings results in a period of border economic weakness, plus a flurry of interest in AI technologies. Nvidia entered the top 10, being the leading supplier of semiconductors for AI development, and Meta has likely benefitted from both tailwinds, having seen a recovery in earnings, as well as being one of the leading developers of AI.
Performance
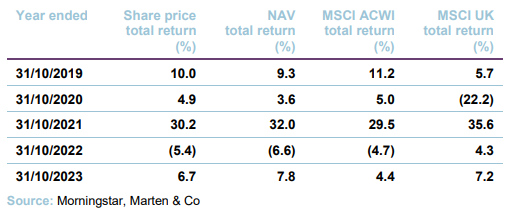
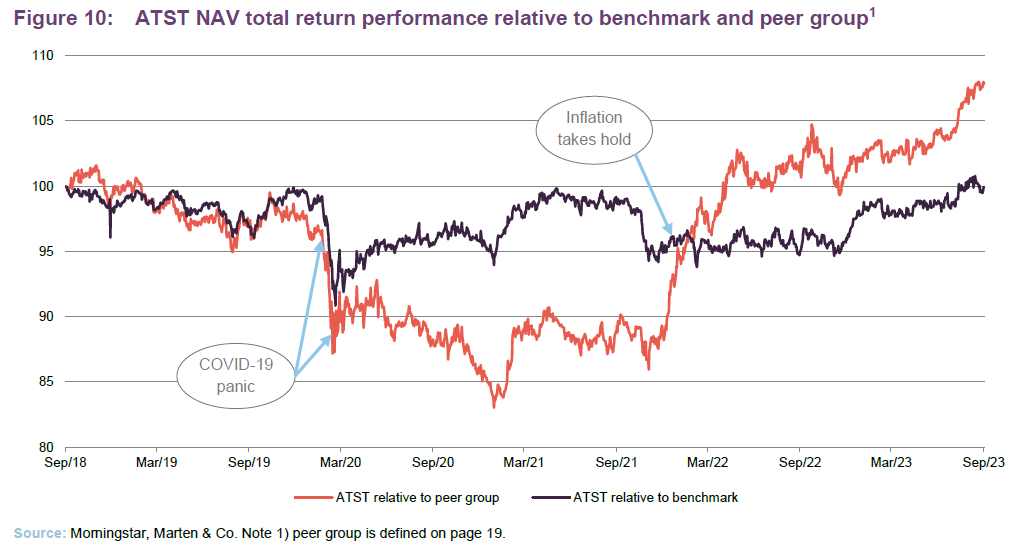 Between 2019 and 2020 global equity markets rewarded concentration and momentum within portfolios, rather than diversification, and this has hit ATST’s relative returns over those periods. This period saw the dominance of US mega-cap technology, which outperformed almost all other asset classes, as well as the wider growth style of investing. The catalyst for this was ultra-accommodative interest rates rewarding long-duration assets, the disruption of COVID-19 on business and consumer habits creating unique tailwinds for the technology sector, and the recessionary impact of COVID-19 being a natural tailwind for the outperformance of growth stocks. The combination of the dominance of a handful of mega-cap growth stocks, and a specific style of investing, has meant that ATST’s at-times structural underweight to them has prevented it from keeping up with global equity markets, as can be seen in the post-COVID-19 period in Figure 10.
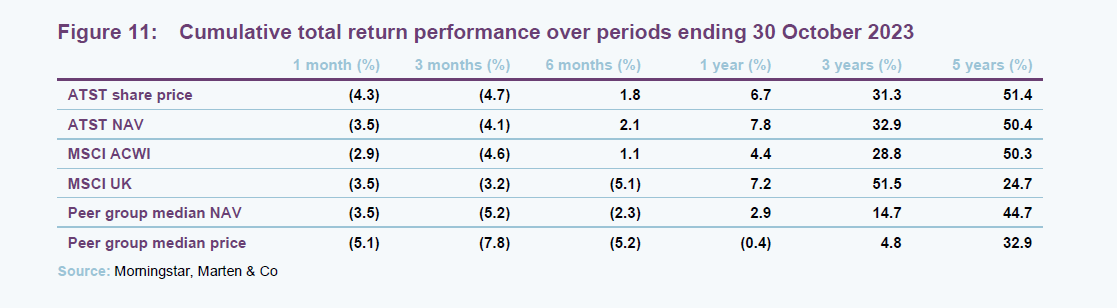
Generally speaking, during period of very narrow stock or stylistic leadership, ATST does have the potential to structurally underperform, however as can be seen by Figures 10 and 11 ATST can also rely on merits of successful stock picking to carry the trust. Looking at the longer-term five-year numbers, both ATST’s share price and NAV have performed largely in line with that of global equity markets, with the effects of fluctuating market tailwinds ‘coming out in the wash’. However, ATST has generated noticeable NAV outperformance over three and one years, whereby the impact of the growth stock rallies of 2019 and 2022 have had negligible impacts. We note that ATST’s share price returns closely track its NAV, thanks to the board’s decision to defend a 5% discount, which we cover on page 20.
Peer group
Compare ATST and its peer group on the QuotedData website
In other comparative measures, ATST compares favourably to all of its peer group. ATST’s narrow discount can be attributed to its strict discount control mechanism, with the two other trusts that trade on narrower discounts also operating a similarly strict buyback policy.
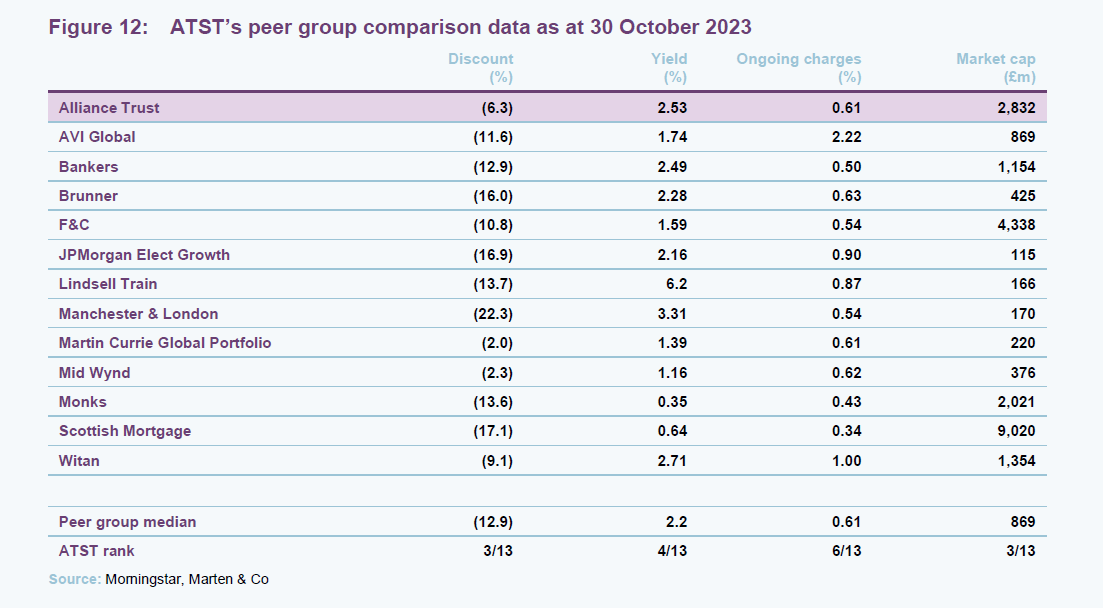
ATST’s yield remains in line with that of its wider peers, with the other multi-manager strategies also offering yields very close to ATST’s. In what is a very competitive sector, ATST’s ongoing charges are at the lower end of the peer group. ATST benefits from its own significant scale (its market cap is over three times the peer group median) as well as the ‘reach’ of the manager, who is able to secure attractive terms thanks to WTW’s scale.
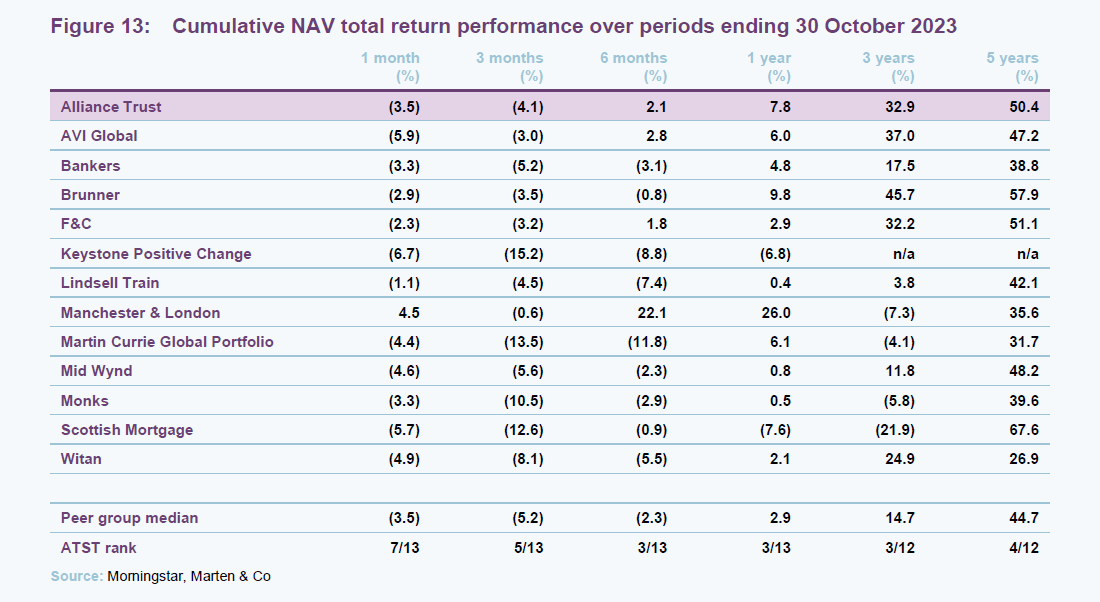
The benefits of taking a balanced approach to equity markets can be seen in greater detail in Figure 12, as ATST ranks in the top third of best-performing funds over one, three, and five years. There are few other peers which can rank as consistently as ATST, as those which were able to capitalise on the growth rally during the pandemic effectively have largely been blindsided by 2022’s bear market.
Dividend
Progressive annual dividend, paid quarterly, that has been substantially enhanced in recent years
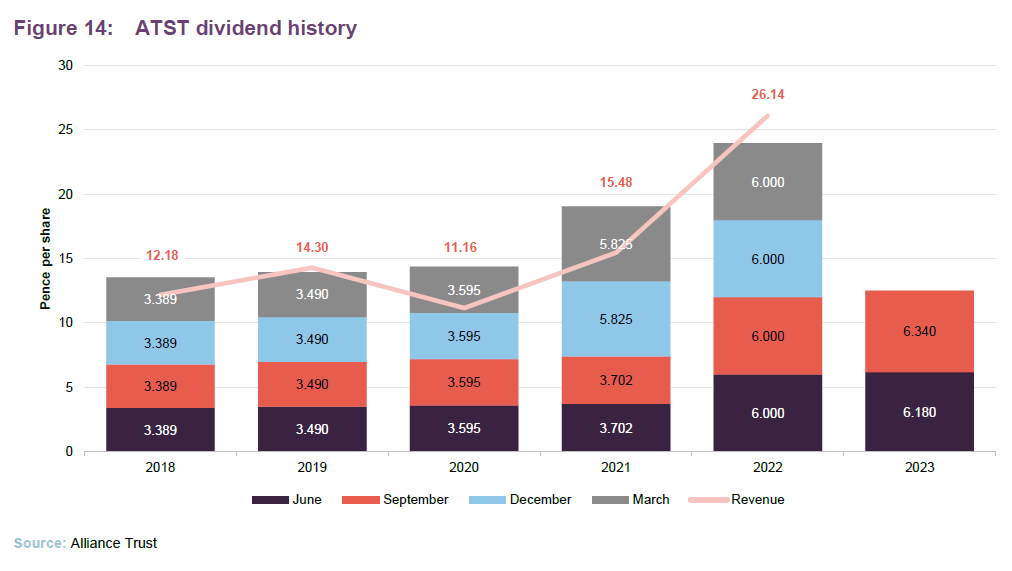
As we described in our last note, ATST has undergone a substantial re-vamp of its dividend policy. Thanks to the conversion of its merger reserve into a distributable reserve, the board was handed more leeway to increase ATST’s dividend. As can be seen from Figure 13, the board increased its 2022 dividend to 24p per share. This represents a 67% increase on its 2020 dividend, the last full year dividend to fully reflect its older distribution approach.
ATST is also known for its enduring track record of dividend increases, currently standing at 56 years and which is the second-longest track record of progressive dividends of any investment trust. Given the substantial resources available to the board, it is very likely that it will continue to follow a progressive dividend policy into the foreseeable future. ATST currently has a distributable reserve of £2.9bn (as of 31 December 2022), which represents the whole of the trust’s capital. It also has a substantial revenue reserve of 1.5 times its most recent full year dividend for 2022.
The board offers investors a dividend reinvestment plan (administered by the registrar), designed to enable shareholders to increase their holding in the trust in a cost-effective way.
Discount
Target a discount close to 5% in normal market circumstances
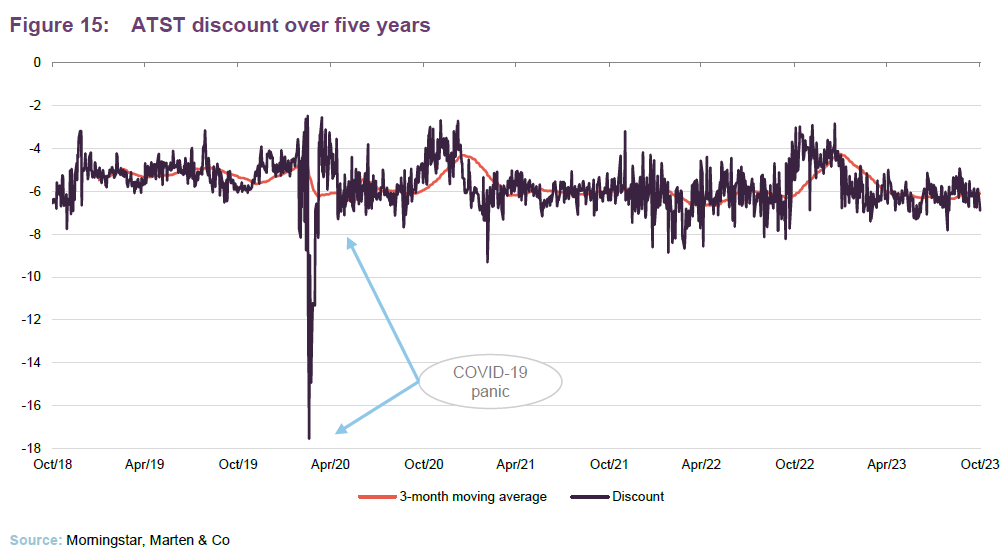
Over the year ended 30 September 2023, ATST’s discount moved within a range of 7.8% to 2.8% and averaged 5.7%.
ATST’s board adopts a policy of seeking to defend a discount around a 5% level in normal market conditions. To that end, the trust deploys share buybacks when necessary. As can be seen from Figure 15, the policy has been very successful, with ATST only trading at a discount materially wider than 6% for a sustained period in the aftermath of the COVID-related market collapse of March 2020. Figure 15 also illustrates that it is a relatively infrequent occurrence that ATST’s discount exceeds 8%. Despite the highly tumultuous markets of the last year, ATST has a z-score of -0.2, the third-lowest amongst its peers, underling its relative stability.
Each year, the board asks shareholders for permission to buy back shares, and in April 2020 they approved the repurchase of up to 14.99% of ATST’s issued ordinary share capital. Shares that are bought back are cancelled although ATST does have permission to hold these in treasury.
Fees and costs
The trust’s AIFM is Towers Watson Investment Management Limited (TWIM). TWIM is entitled to a fixed fee of £1.5m per year (increasing, from 1 October 2019, in line with inflation calculated with reference to CPI each year) plus 0.055% of ATST’s market cap (after deduction of the value of non-core assets and the value of the company’s subsidiaries – both of which are now negligible). TWIM is also entitled to an administration fee for the provision of certain administrative services outsourced by the company. This is capped at £920,000 (again increasing each year in line with CPI, based on a starting point of 1 April 2017), in 2022 this fee was £1.0m.
Each of the underlying managers is entitled to a base management fee rate, generally based on a percentage of the value of assets under management. The fees to the underlying managers are not disclosed, but the manager has indicated that their fee rates are in line with what an institutional investor would pay for the service.
No performance fees are payable.
The management agreement is terminable by either party on the receipt of six months’ notice (or the trust may pay compensation in lieu of this).
For accounting purposes, one quarter of the management fees, financing costs and other indirect expenses is charged against the revenue account and three-quarters against the capital account.
The trust’s ongoing charges ratio stood at 0.61% for the year ended 31 December 2022.
Capital structure and life
Alliance Trust has 283,964,600 shares in issue and no other classes of share capital. The trust has an indefinite life.
Financial calendar
ATST’s financial year-end is 31 December. The most recent annual results were released in March, while interim results are typically released in July. The most recent AGM was held on 27 April 2023. ATST usually pays dividends in March, June, September, and December of each year.
Gearing
The board sets the strategic level of gearing. Currently, this is around 10% gross, but some flexibility is permitted around that level and WTW operates within bounds of about 7% to 13%. If the manager wished to move ATST’s gearing outside of this range, it would need board approval. The level of gearing is driven by WTW’s view of market valuations, which is informed, in part, by the conversations it has with the underlying managers.
The trust has two £100m multi-currency facilities provided by Scotiabank Europe Plc, which mature in December 2022 and December 2023. In addition it has £100m of 15-year unsecured loan notes, with a coupon of 4.28%, which mature on 31 July 2029; £20m of 15-year unsecured loan notes with a coupon of 2.657% that mature on 28 November 2033; £20m of 25-year unsecured loan notes with a coupon of 2.936% that mature on 28 November 2043; and £20m of 35-year unsecured loan notes with a coupon of 2.897% that mature on 28 November 2053.
As at 30 September 2023, the company’s net gearing was 4.5%.
Shareholders
Board
The board consists of eight non-executive directors, all of whom are independent of the manager and who do not sit together on other boards.
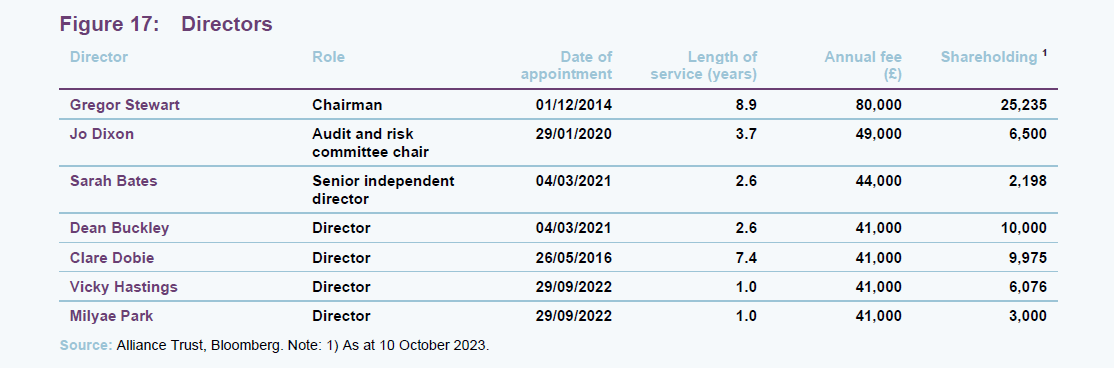
Gregor Stewart (chairman)
Gregor joined the board in 2014 and chaired the audit and risk committee until his appointment as chairman in September 2019. He was also previously a non-executive director of Alliance Trust Savings Limited.
Gregor was finance director for the insurance division of Lloyds Banking Group, including Scottish Widows, and a member of the group’s finance board. He brings over 20 years’ experience at Ernst & Young, with 10 years as a partner in the firm’s Financial Services practice.
Gregor is also a non-executive director of Direct Line Insurance Group Plc, chairman of FNZ (UK) Limited and a non-executive director of its holding company.
Jo Dixon (audit and risk committee chair)
Jo is a chartered accountant and has previously held senior positions within the NatWest Group and was finance director of Newcastle United Plc. She was commercial director, UK, Europe and the Middle East at Serco Group and sat on various advisory boards in the education and charity sector.
Jo also chairs JPMorgan European Investment Trust Plc and is a non-executive director of BB Healthcare Trust Plc, Strategic Equity Capital Plc, BMO Global Smaller Companies Plc and Ventus VCT Plc.
Sarah Bates (senior independent director)
Sarah is a Fellow of CFA UK and was previously chair of the Association of Investment Companies. She was also previously chair of Polar Capital Technology Trust Plc, Merian Global Investors Limited, St James’ Place Plc, JPMorgan American Investment Trust Plc, Witan Pacific Investment Trust plc (now Baillie Gifford China Growth Trust Plc) and chair of the audit committees of New India Investment Trust plc and of U and I Group Plc. Sarah was a founder of the Diversity Project and an Ambassador for Chapter Zero.
Sarah is also a senior independent director on Worldwide Healthcare Trust Plc.
Dean Buckley (director)
Dean is a qualified actuary who has had an executive career in fund management. Previously, he was chief executive officer of Scottish Widows Investment Partnership, and prior to that, he held several positions at HSBC Bank Plc, most recently as chief executive officer of HSBC Asset Management UK & Middle East. Dean has also held senior fund management positions at Prudential Portfolio Managers and was previously a non-executive director of Saunderson House Limited.
Dean is currently chair of Fidelity Special Values Plc and is chair of the audit committee, chair of the remuneration committee and senior independent director for JPMorgan Asia Growth & Income Plc. Dean is also chair of Evelyn Partners Fund Solutions Limited and a non-executive director of Baillie Gifford and Company Limited.
Clare Dobie (director)
Clare ran a marketing consultancy from 2005-2015. Before that, she was group head of marketing at GAM (formerly Global Asset Management) and served on its executive business committee, and prior to that, she held a number of roles at Barclays Global Investors, including head of marketing.
Clare is also a non-executive director of BMO Capital and Income Investment Trust Plc and Schroder UK Mid Cap Fund Plc.
Vicky Hastings (director)
Vicky has over 30 years’ experience in the investment management industry. She was a European equity fund manager before holding senior leadership roles at Merrill Lynch Investment Managers and JO Hambro Capital Management. Vicky was previously an independent non-executive director of JPMorgan Asset Management UK Ltd and JP Morgan Asset Management International Ltd and a non-executive director of Henderson Global Trust Plc and Charter European Trust Plc.
Vicky is also the chair of Henderson European Focus Trust Plc, and non-executive director on Edinburgh Investment Trust Plc, and Impax Environmental Markets Plc.
Milyae Park (director)
Milyae began her career as a chartered accountant in the US and holds an MBA from The Wharton School. She has held senior global executive positions spanning investment banking and other financial services, retail, consumer and technology. Milyae has experience running and advising companies from FTSE 100 to start-up in scale in over 40 countries. In addition, her recent advisory experience has focused on digital transformation and growth, as well as ESG.
Milyae is also a non-executive director of Fidelity European Trust Plc.
Previous publications
Readers interested in further information about ATST may wish to read our previous notes (details are provided in Figure 18 below). You can read the notes by clicking on them in Figure 18 or by visiting our website.
Figure 18: QuotedData’s previously published notes on ATST
| Title | Note type | Published |
| A trust for all seasons | Initiation | 25 November 2020 |
| The fruits of diversification | Update | 04 August 2021 |
| Stability in troubled waters | Update | 17 November 2022 |
Source: Marten & Co
IMPORTANT INFORMATION
This marketing communication has been prepared for Alliance Trust Plc by Marten & Co (which is authorised and regulated by the Financial Conduct Authority) and is non-independent research as defined under Article 36 of the Commission Delegated Regulation (EU) 2017/565 of 25 April 2016 supplementing the Markets in Financial Instruments Directive (MIFID). It is intended for use by investment professionals as defined in article 19 (5) of the Financial Services Act 2000 (Financial Promotion) Order 2005. Marten & Co is not authorised to give advice to retail clients and, if you are not a professional investor, or in any other way are prohibited or restricted from receiving this information, you should disregard it. The note does not have regard to the specific investment objectives, financial situation and needs of any specific person who may receive it. The note has not been prepared in accordance with legal requirements designed to promote the independence of investment research and as such is considered to be a marketing communication. The analysts who prepared this note are not constrained from dealing ahead of it, but in practice, and in accordance with our internal code of good conduct, will refrain from doing so for the period from which they first obtained the information necessary to prepare the note until one month after the note’s publication. Nevertheless, they may have an interest in any of the securities mentioned within this note. This note has been compiled from publicly available information. This note is not directed at any person in any jurisdiction where (by reason of that person’s nationality, residence or otherwise) the publication or availability of this note is prohibited
Accuracy of Content: Whilst Marten & Co uses reasonable efforts to obtain information from sources which we believe to be reliable and to ensure that the information in this note is up to date and accurate, we make no representation or warranty that the information contained in this note is accurate, reliable or complete. The information contained in this note is provided by Marten & Co for personal use and information purposes generally. You are solely liable for any use you may make of this information. The information is inherently subject to change without notice and may become outdated. You, therefore, should verify any information obtained from this note before you use it.
No Advice: Nothing contained in this note constitutes or should be construed to constitute investment, legal, tax or other advice.
No Representation or Warranty: No representation, warranty or guarantee of any kind, express or implied is given by Marten & Co in respect of any information contained on this note.
Exclusion of Liability: To the fullest extent allowed by law, Marten & Co shall not be liable for any direct or indirect losses, damages, costs or expenses incurred or suffered by you arising out or in connection with the access to, use of or reliance on any information contained on this note. In no circumstance shall Marten & Co and its employees have any liability for consequential or special damages.
Governing Law and Jurisdiction: These terms and conditions and all matters connected with them, are governed by the laws of England and Wales and shall be subject to the exclusive jurisdiction of the English courts. If you access this note from outside the UK, you are responsible for ensuring compliance with any local laws relating to access.
No information contained in this note shall form the basis of, or be relied upon in connection with, any offer or commitment whatsoever in any jurisdiction.
Investment Performance Information: Please remember that past performance is not necessarily a guide to the future and that the value of shares and the income from them can go down as well as up. Exchange rates may also cause the value of underlying overseas investments to go down as well as up. Marten & Co may write on companies that use gearing in a number of forms that can increase volatility and, in some cases, to a complete loss of an investment.