Alliance Trust
Investment companies | Update | 17 November 2022
Stability in troubled waters
More than five years after it refocused its global equity portfolio, Alliance Trust (ATST) has proven the merits of blending different expertise across different investment styles. Its manager, Willis Towers Watson, has been able to demonstrate the benefits of its balanced, multi-manager strategy. By eschewing a single investment style bet (such as ‘growth’ or ‘value’) in favour of a focus on stock picking, ATST has been able to provide handy outperformance of the majority of its peers over 2022.
ATST has also implemented a new dividend policy, which has substantially enhanced its pay-outs. The trust now has a 2.4% yield, and the board aims to extend its 55-year track record of increasing the dividend every year.
Global stock-picking portfolio
Alliance Trust aims to be a core equity holding for investors that delivers a real return (after adjusting for inflation) over the long term through a combination of capital growth and a rising dividend. It invests primarily in global equities across a range of industries and sectors via a ‘manager of managers’ approach. This is intended to reduce the risk often taken by investors selecting a single, star manager or one particular style that can move in and out of favour.
Bellwether by design
Readers may wish to refer to our initiation note which was published in November 2020.
Alliance Trust (ATST) has since April 2017 been under the management of Willis Towers Watson (WTW), one of the world’s leading investment consultants, with multiple trillions of pounds of assets under advisory. It is the intention of WTW to ensure that ATST is not only a superior choice for a ‘core’ allocation to equities, but to also use the trust as a seldom-found opportunity for retail investors to gain access to both the expertise of WTW and a number of investment strategies that are not marketed to retail investors in the UK.
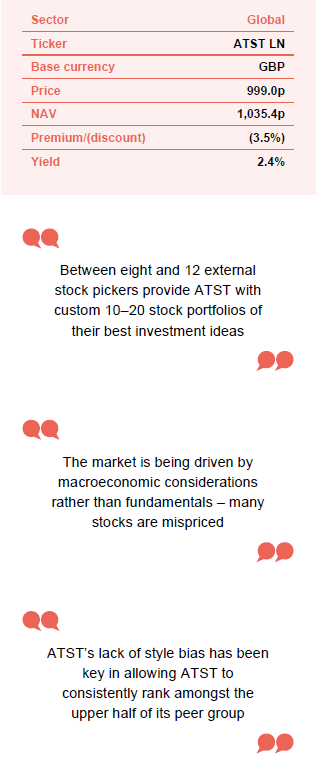
Between eight and 12 external stock pickers provide ATST with custom 10–20 stock portfolios of their best investment ideas.
WTW’s approach to constructing ATST’s portfolio is a multi-manager one, selecting between eight and 12 external stock pickers to provide ATST with custom 10–20 stock portfolios of their best investment ideas. It is WTW’s belief – which they evidence via the use of academic research – that the best-performing professional investors are those which follow a highly concentrated approach to stock selection. Thus, their approach should allow them to invest via a group of managers which are amongst the most likely to generate alpha over the long term.
WTW brings more than academic rigour to ATST; it also offers ATST’s shareholders access to its enormous wealth of professional resources. So great is the level of resourcing that WTW assesses over 12,000 professional, long-only equity strategies before producing a short-list of about 20 managers from which the investment team assigned to ATST is able to select its preferred managers.
Many of WTW’s chosen managers can only be accessed by retail investors via ATST.
This potential universe is also far greater than the products available to retail investors, meaning that not only are the portfolios constructed by ATST’s managers an entirely unique offering, but many of their chosen managers can only be accessed by retail investors via ATST. WTW’s relationships with its chosen managers goes far beyond ATST, given its vast client and asset base. WTW can in fact utilise the weight of these assets to help negotiate lower fees from its chosen managers as well, further improving the advantages of ATST even over managers which are available to UK retail investors.
WTW also places a considerable amount of weight on integration of an assessment of environmental, social and governance (ESG) aspects, not only when selecting its managers but also in their day-to-day monitoring to ensure not only that they adhere to WTW’s strict ESG criteria, but also that each of their holdings receives the correct amount of active engagement around ESG topics, and that the voting is undertaken having considered ESG factors. WTW utilises a third-party consultant, EOS, to oversee its voting and engagement activities, as not only is it a specialist in this sector, but also benefits from advantages of scale, having combined the assets of a number of professional investment managers and asset owners. We described WTW’s ESG approach in substantial detail in our prior note.
“a core equity holding for investors that delivers a real return over the long term” alliancetrust.co.uk
The board intends for ATST to be a core equity holding for investors that delivers a real return (after adjusting for inflation) over the long term, through a combination of capital growth and a rising dividend. ATST has a long history dating back to 1888. It is an AIC Dividend Hero, having increased its dividend in each of its last 55 financial years. The trust merged with its sister trust, Second Alliance Trust in 2006, and WTW took over management from 1 April 2017. Alliance Trust Investments (the trust’s internal management company, which also ran 11 funds and had assets under management excluding ATST of £2.5bn) was then sold to Liontrust.
Market backdrop
iMarket dynamics have evolved substantially since our last update.
When we wrote our last note in August 2021, we could not have predicted the subsequent roller-coaster that equity markets would ride, especially considering they had only just recovered from COVID-19. Sentiment in today’s equity markets is dominated by global inflationary pressures and rising interest rates, as well as increasing geo-political tensions – thanks to the outbreak of the war in Ukraine as well as more region-specific issues such as the turmoil in UK politics, and China’s rigid adherence to its zero-COVID policy.
Figure 1 shows the returns over 2022 (up to the end of October) for various countries and regions. All the figures have been translated back into pounds. The weak UK currency has had an impact on these as it bolsters sterling returns.

The dominant factor is the impact of rising global inflation and the associated rise in interest rates.
Be it issues in the supply of global energy, rising costs of raw materials, the realisation of pent-up demand post-pandemic, or tight labour markets, there have been numerous factors causing inflation to rise across almost all global economies.
Prior to 2022, most major economies had benefited from nearly a decade of rock-bottom inflation, with accommodative central banking policy fuelling asset price increases. However, 2022 brought these issues home to roost in financial markets and economies, with an unexpectedly steep, sharp rise in global inflation leading to a U-turn in central banking policy, which raised interest rates and in doing so raised the discount rates investors use to value future cash flows.
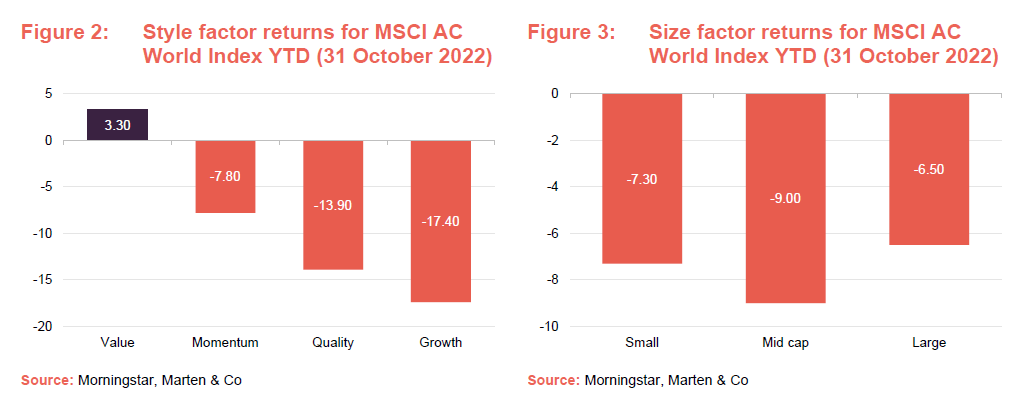
Figure 2 shows that the only style that has produced a positive return over 2022 is ‘value’. By contrast, ‘growth’ has been hit quite badly. In terms of size (shown in Figure 3), stocks with large market capitalisations have outperformed small and medium-sized companies. The question now is whether this inflation will persist, and by extension how much pain the central banks will be forced to inflict on the global economy and equity markets in order to contain it. These forces do not treat all stocks equally either, with high-growth companies feeling a disproportionately large amount of the pain given their sensitivity to discount rates (higher discount rates tend to have a greater negative impact on the valuations of growth stocks whose cash flows are discounted back from further in the future). There are a small number of beneficiaries of this rising inflation, such as those directly associated with the production of energy and raw materials.
Unfortunately, the market outlook is only becoming murkier, as investors not only need to grapple with rising inflation but also falling GDP, with professional commentators suggesting that the likelihood of a recession across the developed world is increasing. The difficulty comes in predicting which style of investing would win-out in such an environment. For example, growth investing has tended to do well during market downturns (as investors seek out any source of economic growth), but this relationship may not be as straight forward in a stagflationary environment (one with inflation and economic recession).
The consequences of this have been made apparent by today’s equity markets, as no sector has been untouched by the aforementioned headwinds. While the stark decline in Europe’s performance is predictable, given its proximity to the Ukraine conflict and its greater reliance on Russian gas, many of 2021’s global winners have given back returns, with 2022 effectively putting an end to the market momentum that carried many investment styles throughout 2020 and 2021.
The team at WTW does not try and pick which style will outperform but instead focuses on finding attractive companies with strong long term fundamentals that will allow them to navigate a variety of economic conditions.
Manager’s view
WTW has needed to make few changes to its portfolio, with its managers already making adjustments.
WTW’s portfolio manager Stuart Gray describes similar macroeconomic issues to the ones we outlined above. However, he remains fully confident in the delegated managers’ abilities to navigate an inflationary, or even recessionary, environment. To that end WTW notes that it has had to do little proactive adjustment to ATST’s manager allocations (other than the redistribution of capital from River & Mercantile – see below), as the delegated managers have already made sufficient adjustments to their own allocations as to allow for the changing market environment.
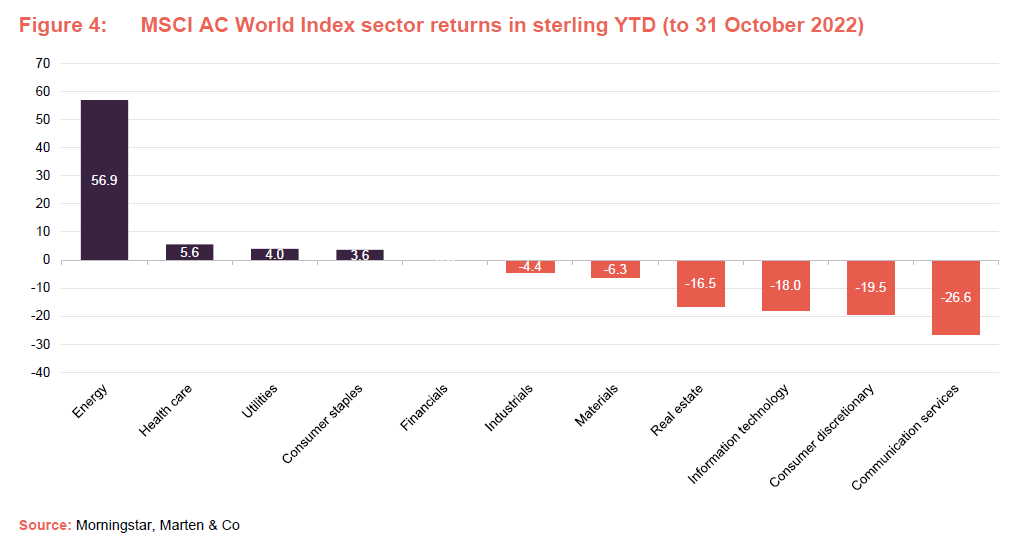
WTW does comment that 2022 has not been a year of a rotation from growth into value but rather out of technology and into energy. Whilst these sectors are often seen as the stalwarts of growth and value investing respectively, because the change in momentum is so focused on these sectors, selecting outperforming managers is not as easy as simply rotating from one style into another, though a permanent shift to a higher inflationary and interest rate environment may eventually throw up additional winners in the value sector.
The market is being driven by macroeconomic considerations rather than fundamentals – many stocks are mispriced.
Despite the sell-off in the growth sector, and the rise in interest rates, WTW still believes that many high-growth companies are yet to be valued correctly as their valuations today have not adjusted for the prospect of a structural rise in discount rates, but instead are merely reacting to short-term macroeconomic data. Mispricing remains likely as investors have not yet valued companies based on their long-term cash flows relative to structurally higher interest rates.
In fact, WTW believes that the market does not yet reflect true company fundamentals, with investors continuing to look for short-term flights to safety rather than searching for companies which are strong based on long-term outlooks. Often, in the case of ATST’s invested companies, their fundamentals have grown faster than the market even though their share prices have not, as they do not neatly fit into the current macro trades. However, this does mean that on a fundamental basis, ATST has become increasingly cheaper.
WTW’s confidence is also due to its long-term view of manager selection, whereby it would not trust a manager’s investment process if this did not account for all aspects of a market cycle, effectively allowing for a decade-long investing horizon. This means that the companies in ATST’s portfolio will have various ways in which they can adapt to either an inflationary or recessionary environment.
For example, Intuit, which is held by Sands Capital, is an example of a company with low capital intensity, requiring smaller amounts of capital to grow, and thus less exposed to rising input costs, whereas Visa, which we discuss later in this note, is directly correlated to inflation via its transaction-based revenue model and earns more money as the nominal price of goods increases. Then there are companies like Mercado Libre, held by Sands Capital and Sustainable Growth Advisers, which is an example of a secular growth opportunity, as its earnings growth is based on a long-term market transition rather than cyclical trends in the global economy.
Manager allocation
The lead manager working on ATST’s portfolio is WTW’s global chief investment officer, Craig Baker. He chairs an investment committee comprised of Stuart Gray and Mark Davis, who are co-portfolio managers. Maria Musiela is senior client lead. Between the four, they have over 85 years of investment experience. They are backed up by a team of 108 global research associates, 250 operations and support associates and 21 portfolio management team associates (as at end 2020).
There are currently nine underlying managers who make up 10 separate mandates (GQG manages both an emerging markets and a global portfolio).
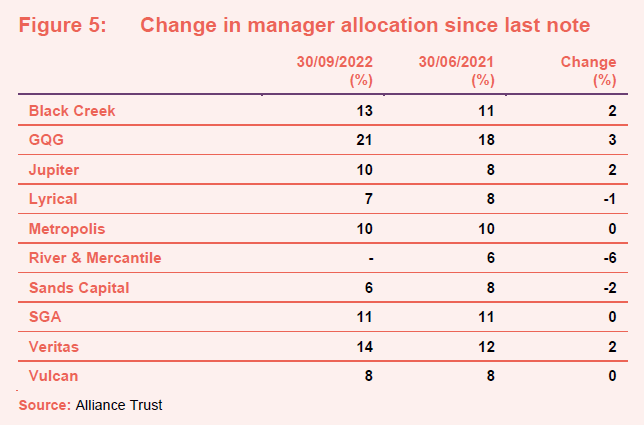
Since our last note, the WTW team has exited its position with River and Mercantile, the UK value strategy. This was not done on the back of any concerns around process or performance, but rather due to the takeover of River and Mercantile by AssetCo. The team felt that following the purchase, the River and Mercantile managers would no longer have the same level of investor-alignment they did prior to the merger, a key element of its manager selection, and exited its position accordingly. The resulting capital was distributed across a number of other stock pickers, with no new manager added to replace River and Mercantile.
Since taking over the mandate in April 2017, WTW has exited three managers in total, adding in four more. None of these exits were due to performance concerns; rather due to WTW changing its view on the managers.
GQG – skilful navigation
GQG seeks high-quality sustainable businesses at reasonable prices which should be able to perform regardless of the macro environment, with this philosophy shared across both their global and emerging market strategy.
Although many of ATST’s stock pickers have adopted a fixed investment style, the US-based GQG partners take a more malleable approach to stock selection. While it has a clear devotion to high-quality businesses, it is more than willing to adjust its allocations in line with the changing market tailwinds; something which has clearly been the case over the last 12 months, with GQG’s current portfolios looking remarkably different to the one it held in 2021.
Prior to 2022 one would have historically associated GQG with the growth factor, with technology stocks in particular being a mainstay in their allocation. However, by the end of 2021 the GQG team had made a substantial rotation in its allocations, selling down these high-growth companies to rotate into more value-oriented sectors like oil and gas.
This was not a purely macroeconomic call, but rather a reflection of the GQG team wanting to take advantage of the changing supply/demand dynamics in the wider energy sector, which led oil and gas companies like Petroleo Brasileiro (also known as Petrobas) and Exxon Mobil to have sufficiently resilient and growing cash flows to meet the GQG team’s investment criteria.
While WTW’s other stock pickers have moved in and out of favour in accordance with their styles, GQG has remained one of its top contributors over both 2021 and 2022. This consistent growth, in conjunction with them being a good diversifier against some of the other stock pickers in the portfolio and receiving some of the capital from the disposal of the River and Mercantile position, has resulted in it having the largest allocation within ATST, as well as the largest allocation increase, albeit across its two separate portfolios.
Jupiter: cash-heavy, valuation-light
Jupiter aims to identify companies which trade at attractive discounts based on their cash-flows, typically with some form of pending catalyst to narrow the aforesaid discount. Following a ‘value’ style of investing, Jupiter also has a large overweight to the UK market.
The Jupiter Asset Management sleeve of ATST is manged by Ben Whitmore, whose focus is finding ‘cheap’ companies on a cash flow-relative-to-valuation basis. This leads him to be considered a value manager, but Ben is aware that a heavily valuation-focused approach can lead to investing into ‘value traps’ – cheap companies with no upside. Ben believes that his focus on balance-sheet strength when assessing a company will help him avoid the aforesaid traps, as stronger balance sheets are typically associated with well-run and successful companies.
More than simply selecting cheap, high-quality companies, Ben has a preference for companies going through periods of ‘change’, which can lead to short-term share price depression. Such occurrences offer entry points into companies which he expects will come out of this temporary period of turbulence much stronger, which should narrow the discount they trade on.
Although Ben operates with a global remit, he has long held a large overweight to the UK, given the multinational natures of the UK’s largest companies and also the inexpensive valuations that many UK companies trade on relative to international peers, thanks in large part to the heightened risks Brexit brought to the region. This UK overweight is also why Jupiter received a large proportion of the River and Mercantile capital, as it was a close proxy for their style. However, Ben is seeing increasing value in several Japanese companies, as well as a handful of stocks in other regions, which has led to him reducing his UK weighting recently.
Asset Allocation
Although WTW’s approach to portfolio construction is nuanced, its outcome is easily understood. Each of the allocated managers’ portfolios is an entirely stock-specific selection, reflecting their best ideas as opposed to any attempt by them to construct a balanced selection that takes account of the exposures to different risk factors. Instead, it is the WTW team which chooses to allocate between them in whatever proportion it deems fit.
WTW team aims to create a well-diversified portfolio which simultaneously preserves the benefits of active management.
Most importantly, the WTW team aims to create a well-diversified portfolio which simultaneously preserves the benefits of active management, as demonstrated by ATST’s high active share of 78%, while also limiting the portfolio’s overall factor exposures. The result is to ensure that ATST does not typically have any substantial stylistic over- or underweight exposures when compared to its performance benchmark, the MSCI ACWI. It is WTW’s intention for ATST’s risk to come entirely at a stock level, so as to ensure that ATST is as strong a reflection of the skill of their chosen stock pickers as possible.
WTW’s approach to construction is not mechanical however, rather it follows what it believes to be good principles of portfolio construction. It still accounts for the conventional concepts of investing, like developed market large caps stocks having the highest liquidity.
Whilst ATST aims to not take significant top-down bets relative to the benchmark, it has some marginal style biases. Its greatest deviation from its benchmark comes from its regional allocations, with ATST having an overweight the UK and underweight to North America. These positions reflect the underlying managers’ convictions, with many of the global mandates being bullish on the relative attractiveness of UK valuations.
Top 10 holdings
Figure 6 shows ATST’s top 10 holdings as at 30 September 2022 and how this has changed since 30 June 2021 (as our last note was published on 04 August 2021). New entrants to the top 10 since then are Petroleo Brasileiro, UnitedHealth Group, HDFC Bank, and Exxon Mobile. The inclusion of these companies reflects the changing nature of markets, with ATST’s managers’ weight rotating into likely market winners or said winners having seen their share prices positively re-rate over 2022. ATST’s allocations to technology companies like Amazon and Alphabet have correspondingly fallen for the same reason, managers like GQG having sold out of them in 2021 in anticipation of the market rotation, whereas long-term holders of such high-growth companies will have seen their valuation fall sharply since our last note.
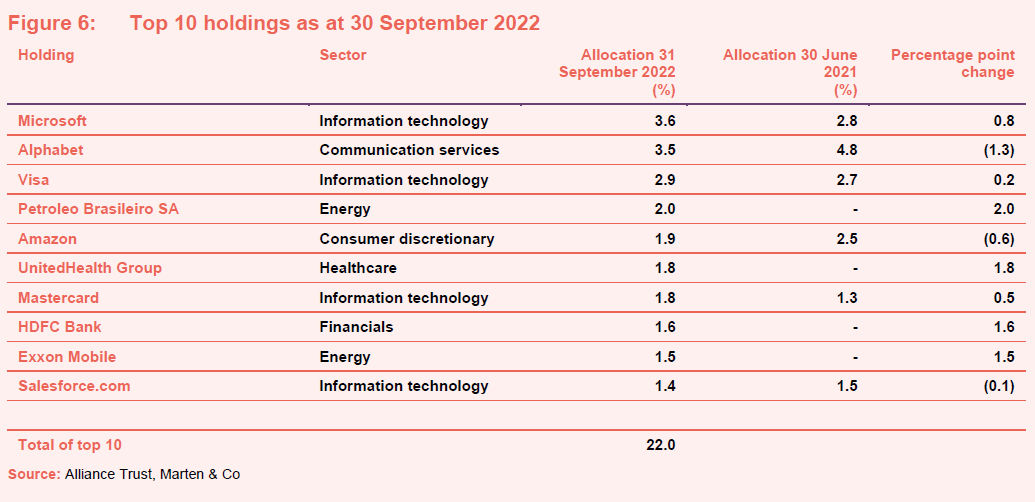
Turnover has been heightened over the last 12 months, in part due the redistribution of capital previously allocated to River and Mercantile, but also due to the increased volatility and market drawdowns we are currently seeing, with ATST’s stock pickers having sold out of some positions entirely. Examples of outright sales include LAM Research, Walt Disney, Lukoil, Rosneft Oil, Sanofi and Crown Holding.
Visa
Visa (visa.com) is an American financial services firm, known primarily for its electronic payment solutions. Visa is also one of the most-held companies within ATST, finding a place in the portfolios of five of ATST’s different stock pickers, as well as also being one of the largest overweight exposures within the portfolio, with a 2.4% overweight position relative to the MSCI all countries world index (ACWI). Visa was a direct beneficiary of the post-pandemic increase in consumer activity, given that it has a critical role in facilitating transactions, leading it to be directly correlated to consumer spending. Also, by being driven by the nominal value of transactions, Visa acts as a natural inflation hedge. We note that similar rationale can also be applied to Visa’s closest competitor, Mastercard, which is also held in ATST’s portfolio.

Petroleo Brasileiro
Petroleo Brasileiro (petrobras.com), also known as Petrobras, joined ATST’s top 10 in January 2022, having been purchased by GQG Partners after it rotated from growth into energy stocks. Oil companies have been one of the few bright spots in global equity markets over 2022, with Petrobras up about 30% over the year-to-date (YTD). Petrobras has been a clear beneficiary of the global energy shortage. Analysts expect a meteoric year-on-year earnings growth of over 100% for 2022. Yet Petrobras, like many major oil producers, has underinvested into oil extraction in recent years, thanks to the previous downward trend in oil prices, often due the expectation that a more sustainable economy could require less oil.
Given the potential for expansion, GQG is confident that Petrobras will be able to generate above-market free cash flow growth with ever-increasing reliability given the structural uptick in the cost of energy and oil.
Petrobras also demonstrates a phenomenal value opportunity, where despite its powerful tailwinds, it trades on a rock-bottom price/earnings (P/E) ratio of sub-3 times, in part due to the market historic aversion to oil extractors.

Performance
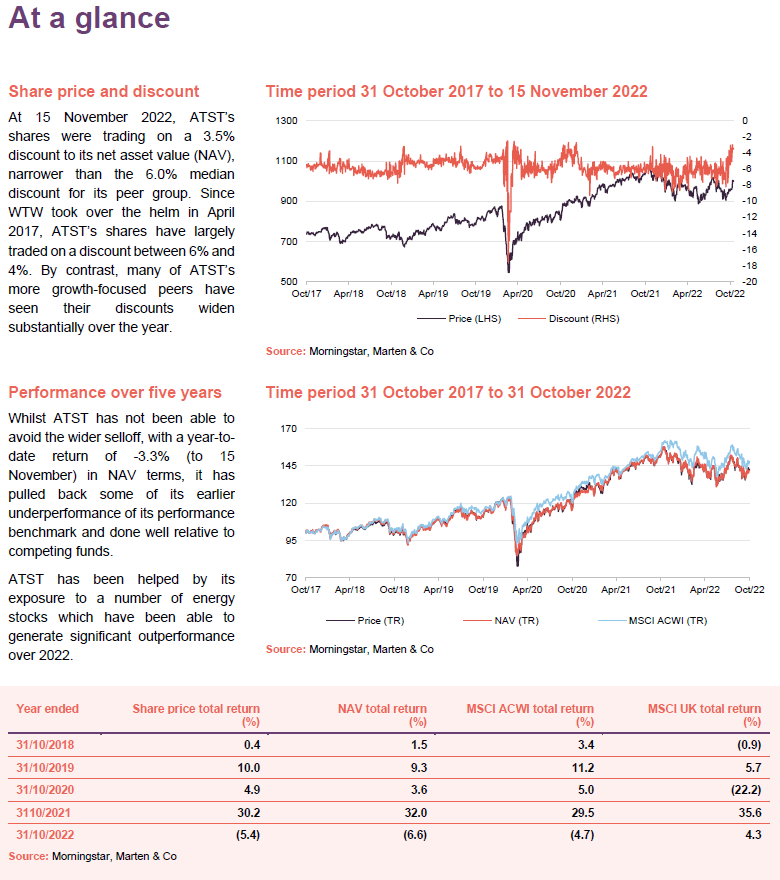
2022 has been a telling period for ATST’s global equity peer group, with many of the past winners having been caught painfully off-guard by the market’s rotation. Whilst ATST has not been able to avoid the wider selloff, with a YTD return of -3.3% (to 15 November) in NAV terms, it has pulled back some of its earlier underperformance of its benchmark and done well relative to competing funds.

We remind readers that for the majority of WTW’s tenure as managers (having taken over in April 2017), there were a number of illiquid legacy assets that it slowly disposed of. As such, ATST’s reported NAV is not a perfect reflection of the performance of WTW’s investment approach, though none of these legacy assets remain in the portfolio as of today.

In the years prior to 2022, the MSCI ACWI was overwhelmingly driven by a handful of mega-cap US technology stocks, of likes of Microsoft and Apple. Given ATST investment approach, it tended not to take the same concentrated bets that its benchmark did.
Figure 11 compares ATST’s performance to both its benchmark and an equally weighted version of the MSCI ACWI (which WTW believes to be a closer comparison to the allocation weights present in ATST).

ATST’s near-term performance (i.e. over the last six months) has been superior to its benchmark, helped by its overweight exposure to a number of energy stocks which have been able to generate significant outperformance over 2022 (as seen by the changes in ATST’s top 10 holdings).
Within ATST’s portfolio, growth-stock managers such as Sustainable Growth Advisors, which once helped drive the portfolio’s performance, have now underperformed over 2022, while the more valuation-conscious managers like Jupiter have been amongst the best.
Peer group
For the purposes of this note, we have excluded Blue Planet Investment Trust from ATST’s peer group on size grounds. Other changes include the addition of Keystone Positive Change, which entered the sector with effect from February 2021, while Scottish Investment Trust has merged with JPMorgan Global Growth and Income since we last published.
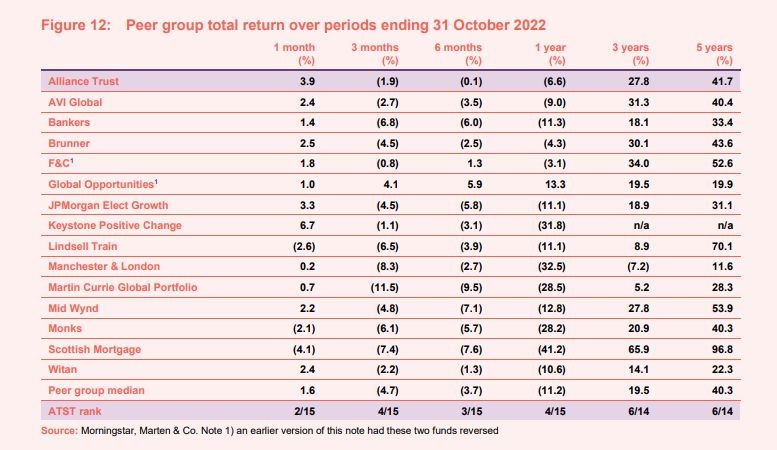
Thanks to WTW’s investment approach, ATST is, relative to many of its peers, more of a consistently ‘core’ style of investment, with the majority of its peers either carrying a substantial bias to a specific style of investing or having some sort of drift in their style in an attempt to match the varying market tailwinds.
This lack of bias has been key in allowing ATST to consistently rank amongst the upper half of its peer group, with its relative ranking having only improved over time. This is because it has not been caught off guard by sudden shifts in market sentiment in the same way as many of the others have.
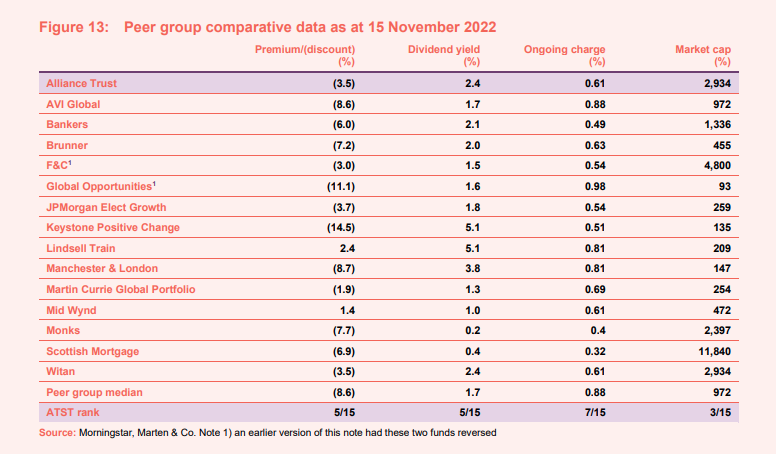
Outside of its out-performance, ATST is also set apart from its peers by its much more stable discount, which we describe below. ATST is not the sole multi-manager strategy within its peer group, as Witan, JPMorgan Elect Managed Growth, and F&C also utilise a similar approach. Yet what sets ATST apart from this smaller cohort of peers is firstly its commitment to not relying on factor bets, which mitigates the risk of behavioural factors impacting the performance of the strategy, and secondly its use of not only custom portfolios, but WTW’s ability to source seldom found mangers, with no pressure to use ‘in-house’ managers which may lag their wider peers.
Dividend
ATST has, in the last 12 months, dramatically improved its dividend profile. This has not come via any change in the underlying portfolio, but rather the board having tapped into the trust’s substantial £645m ‘merger reserve’, which following shareholder approval was converted into a distributable reserve, giving the board greater capacity to fund ATST’s dividend.
ATST’s recent full year dividend of 19.05p represented a 32.5% increase on the prior year’s, but only the third and fourth interim dividends were paid utilising the merger reserve. The third and fourth interim dividends were in fact a 62.0% increase on the prior year’s third and fourth interim dividends and reflect the overall increase of future dividends going forward. ATST currently has a dividend yield of 2.4%, which is roughly in line with the expectations of the board. ATST’s yield is higher than that of its sector median of 1.8%.
ATST has substantially improved its dividend profile over the last year.
Whilst the board anticipates that ATST will maintain its more attractive yield going forward, it has not given explicit guidance around a target nominal dividend. Rather, it retains the same approach to dividend payments as prior to the increase, to deliver a rising dividend year-on-year in conjunction with capital growth. The board is highly unlikely to cut ATST’s dividend in the future, given the substantial reserves, ATST will pay a level which is commensurate with prevailing market conditions, accounting for factors such as inflation, dividend growth, and the dividend yield of the wider global sector.
The board offers investors a dividend reinvestment plan (administered by the Registrar), designed to enable shareholders to increase their holding in the trust in a cost-effective way.
ATST already boasts a track record of 55 consecutive years of increasing dividends, one of the longest track records of any investment trusts and making it one of the AIC’s leading dividend heroes.
Premium/(discount)
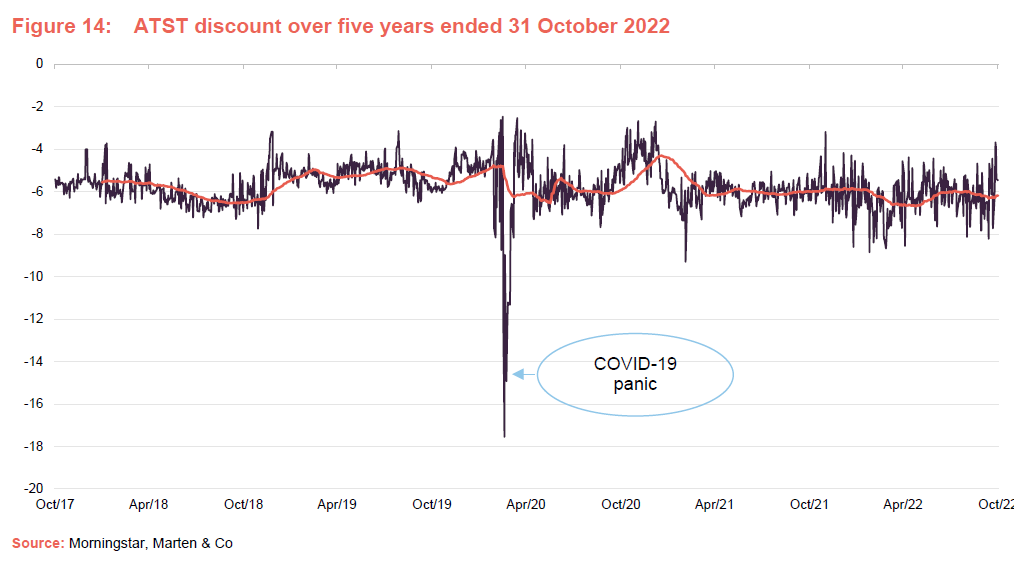
Over the 12 months ended 31 October 2022, ATST’s shares traded within a discount range of between 3.2% and 8.9%. The average discount over that period was 6.2%.
At 15 November 2022, ATST’s shares were trading on a 3.5% discount to NAV, narrower than the 6.0% median discount for its peer group. Since WTW took over the helm in April 2017, ATST has largely traded on a discount between 6% and 4%. This has also largely been the case over the course of 2022 despite the broader sell off of risk assets, with many of ATST’s more growth-focused peers having seen their discount widen substantially over the year.
ATST’s stable discount is in part due to its appeal as a ’core’ equity product, one which should in theory be less sensitive to the stylistic swings in the market than its peers. It is also due to the actions of ATST’s board, who have been practice in buying back shares of the trust to help control the discount. In December 2016, the board adopted a policy of seeking to defend a discount around a 5% level in normal market conditions. Over the last 12 months the board has repurchased 15.5m shares to achieve this goal, equal to 8% of the current shares in issue.
ATST has the least volatile discount of its peers.
The stability of ATST discount is far more apparent when compared to that of its wide peer group, with many of the more stylistically-biased trusts seeing their discount swing much more wildly than ATST’s over the last 12 months. The peer group has a 12-month average discount volatility three times greater than that of ATST.
ATST has been so reliable that is has the lowest discount volatility and the highest five-year z-score amongst its peers, of 0.01% and 0.5 respectively. ATST is also one of two trusts to have a current discount which is narrower than its five-year average, a sign of the trust’s resilience and the diligence of the board.
Previous publications
Readers interested in further information about ATST may wish to read our previous notes (details are provided in Figure 15 below). You can read the notes by clicking on them in Figure 15 or by visiting our website.
Figure 15: QuotedData’s previously published notes on ATST
| Title | Note type | Published |
| A trust for all seasons | Initiation | 25 November 2020 |
| The fruits of diversification | Update | 04 August 2021 |
Source: Marten & Co
Legal
Marten & Co (which is authorised and regulated by the Financial Conduct Authority) was paid to produce this note on Alliance Trust Plc.
This note is for information purposes only and is not intended to encourage the reader to deal in the security or securities mentioned within it.
Marten & Co is not authorised to give advice to retail clients. The research does not have regard to the specific investment objectives financial situation and needs of any specific person who may receive it.
The analysts who prepared this note are not constrained from dealing ahead of it but, in practice, and in accordance with our internal code of good conduct, will refrain from doing so for the period from which they first obtained the information necessary to prepare the note until one month after the note’s publication. Nevertheless, they may have an interest in any of the securities mentioned within this note.
This note has been compiled from publicly available information. This note is not directed at any person in any jurisdiction where (by reason of that person’s nationality, residence or otherwise) the publication or availability of this note is prohibited.
Accuracy of Content: Whilst Marten & Co uses reasonable efforts to obtain information from sources which we believe to be reliable and to ensure that the information in this note is up to date and accurate, we make no representation or warranty that the information contained in this note is accurate, reliable or complete. The information contained in this note is provided by Marten & Co for personal use and information purposes generally. You are solely liable for any use you may make of this information. The information is inherently subject to change without notice and may become outdated. You, therefore, should verify any information obtained from this note before you use it.
No Advice: Nothing contained in this note constitutes or should be construed to constitute investment, legal, tax or other advice.
No Representation or Warranty: No representation, warranty or guarantee of any kind, express or implied is given by Marten & Co in respect of any information contained on this note.
Exclusion of Liability: To the fullest extent allowed by law, Marten & Co shall not be liable for any direct or indirect losses, damages, costs or expenses incurred or suffered by you arising out or in connection with the access to, use of or reliance on any information contained on this note. In no circumstance shall Marten & Co and its employees have any liability for consequential or special damages.
Governing Law and Jurisdiction: These terms and conditions and all matters connected with them, are governed by the laws of England and Wales and shall be subject to the exclusive jurisdiction of the English courts. If you access this note from outside the UK, you are responsible for ensuring compliance with any local laws relating to access.
No information contained in this note shall form the basis of, or be relied upon in connection with, any offer or commitment whatsoever in any jurisdiction.
Investment Performance Information: Please remember that past performance is not necessarily a guide to the future and that the value of shares and the income from them can go down as well as up. Exchange rates may also cause the value of underlying overseas investments to go down as well as up. Marten & Co may write on companies that use gearing in a number of forms that can increase volatility and, in some cases, to a complete loss of an investment.

