
Steady as he goes
CQS New City High Yield Fund (NCYF) has continued to do what it was designed to do: deliver a high level of income from a diversified portfolio of higher-yielding credit, while seeking to preserve capital through detailed bottom-up credit selection. Its current yield of around 9% remains a key attraction, particularly while inflation, interest rates and geopolitical risk continue to complicate the market outlook.
Recent years have presented numerous challenges for credit markets, but NCYF’s NAV and share price total returns have held up well. With the planned transition of manager from Ian “Franco” Francis to Darren Toner now underway, shareholders should take comfort from Darren’s 15 years working closely with Franco, his familiarity with NCYF’s process, portfolio and underlying credits, and Franco’s expected consultancy role after he steps back in May 2027, all of which allow for a measured handover.
High-dividend yield and potential for capital growth
NCYF aims to provide investors with a high-dividend yield and the potential for capital growth by investing mainly in high-yielding fixed interest securities. These include, but are not limited to, preference shares, loan stocks, corporate bonds (convertible and/or redeemable) and government stocks. The company also invests in equities and other income-yielding securities. The manager has a strong focus on capital preservation and is conservative in his approach to growing NCYF’s capital.
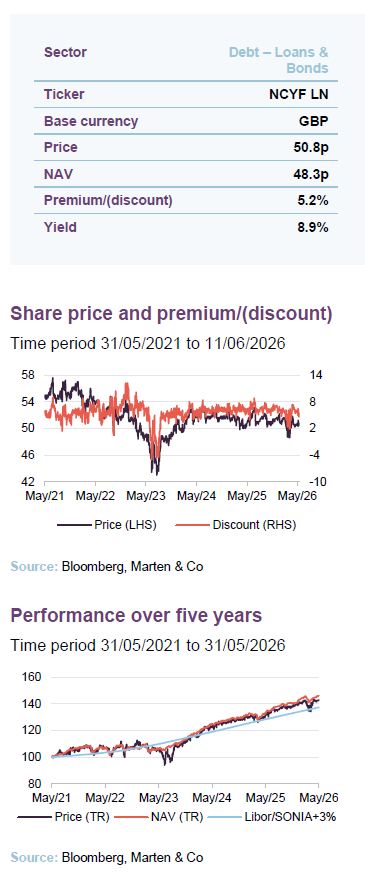
| 12 months ended | Share price TR (%) | NAV total return (%) | Libor/SONIA + 3% (%)1 | CPI + 4% (%) |
|---|---|---|---|---|
| 31/05/2022 | 6.3 | 6.6 | 3.4 | 8.4 |
| 31/05/2023 | (0.8) | (0.7) | 6.3 | 14.0 |
| 31/05/2024 | 16.9 | 18.0 | 8.3 | 9.3 |
| 31/05/2025 | 6.5 | 6.8 | 7.9 | 6.4 |
| 31/05/2026 | 8.9 | 9.5 | 7.0 | 7.4 |
Fund profile
Further information can be found at: ncim.co.uk
A predominantly higher-yielding fixed income exposure
NCYF aims to provide a high level of quarterly income, with the prospect of capital growth, by investing primarily in higher-yielding fixed income securities. It also has flexibility to invest in equities and equity-related securities.
The manager seeks securities that are undervalued by the market.
The manager typically seeks securities that appear undervalued and capable of generating above-average income relative to their risk, while also offering scope for capital appreciation. It also looks to exploit opportunities created by market yield movements and corporate events, including redemptions, conversions, reconstructions and takeovers.
CQS Group and New City Investment Managers
NCIM has managed NCYF since its launch in March 2007.
New City Investment Managers (NCIM) has managed NCYF since its launch in March 2007, having also managed its predecessor, from 2004 until its assets were rolled into NCYF. NCIM joined CQS Group in October 2007. In November 2023, CQS was acquired by Manulife Investment Management, a global asset manager with US$1.3trn of assets under management and administration.
Manager transition underway as Darren Toner joins Franco
Franco will be available for three years after he steps back in May 2027.
On 21 May 2026, Darren Toner, a senior portfolio manager within Manulife | CQS Investment Management’s Multi Asset Credit business, was appointed co-manager of NCYF alongside longstanding manager Ian “Franco” Francis. The appointment is part of a planned succession process, under which Franco is expected to step back from portfolio management in May 2027, while remaining available as a consultant for around three years.
Darren joined CQS in 2010 and has worked closely with Franco for 15 years, giving him a deep understanding of NCYF’s strategy, process and portfolio. In recent years, he has been closely involved in portfolio management support, particularly in identifying and assessing potential investments and portfolio construction.
Shareholders may naturally have some concern about Franco stepping back after such a long and successful tenure. However, Darren is already highly familiar with NCYF’s portfolio, underlying credits and established investment process. He will also continue to draw on the wider Manulife | CQS credit platform, including the 40-strong team of asset class specialists and analysts that has long supported Franco. With a lengthy handover period and Franco’s ongoing consultancy role, we view this as an evolution designed to preserve continuity rather than disrupt the investment approach.
Constructed without reference to a benchmark
Reflecting its fixed income focus, absolute return mindset and diversified portfolio, NCYF is not managed against a benchmark. However, over the longer term, we believe it should be capable of delivering positive real returns and returns above cash rates. We have therefore included comparisons with LIBOR/SONIA +3% and CPI +4%, although these are not formal benchmarks for the fund.
Manager’s view
Significant inflationary risks in the global economy
NCYF’s manager has long warned that global inflation risks remain significant and that, in the event of disruption, inflation and interest rates could stay higher for longer than markets expect. Even so, Ian entered 2026 as cautiously constructive: the UK economy was performing better than expected, with improving domestic and export demand.
Cost pressures remain an issue, particularly for labour-intensive sectors such as hospitality, following higher national insurance contributions and minimum wages, while supply-chain disruption remains an ongoing risk. Before the outbreak of war in Iran, however, the UK economy was showing resilience, with new orders improving across manufacturing and services. Persistent inflation above the Bank of England’s 2% target and softer labour market data were still limiting the Bank’s ability to cut rates.
Few obvious safe havens from effects of Iran war
The war in Iran materially changed the backdrop. Closure of the Strait of Hormuz, through which a significant share of global oil supply passes, fed quickly into energy markets, pushing Brent crude from just over $72 a barrel at the start of March to almost $104 by month-end. This spilled over into rates, credit, equities and currencies. UK gilts weakened, credit spreads widened, equities fell and sterling declined against the dollar, reflecting concerns that energy and trade disruption could keep inflation higher for longer.
For the UK, renewed inflationary pressure has arrived, while the economy remains fragile. Ian highlights the Bank of England’s dilemma: tighter policy may be needed to curb inflation, but the economy may struggle with higher rates. Although the 10-year gilt yield has fallen back from its peak of 5.20% to 4.78%, and the 30-year yield remains around 5.5%, borrowing costs are still elevated and likely to constrain growth.
Europe faces a similar challenge. Early signs of recovery, led by German manufacturing, have faded as higher input costs and conflict-related uncertainty have weighed on activity and sentiment. Ian expects the ECB to keep rates unchanged until there is greater clarity on the conflict, inflation and the wider economic impact.
In the US, growth has also slowed. Manufacturing strength appears to have reflected front-loaded orders ahead of expected price rises, rather than a durable demand recovery. The Federal Reserve therefore faces the same dilemma as the Bank of England and ECB: inflationary pressure has risen, but underlying growth remains weak, making rate cuts difficult.
Volatility returns as inflation risks re-emerge
The managers expect volatility to remain elevated while markets assess the duration and economic impact of the conflict. Although the US and Iran have agreed to extend their ceasefire and reopen the Strait of Hormuz, relations are still strained, key facilities have been damaged, and it will take time to normalise traffic. This suggests that higher inflation and market volatility could persist for some time.
For high-yield investors, however, volatility can create opportunities. Some sectors, particularly those linked to oil, have benefitted from the disruption. NCYF’s managers say that credit selection is especially important in this environment, but they are deploying capital where pricing is attractive and the underlying credit risk acceptable. For example, Frontline was reduced earlier this year after strong performance, with part of the proceeds reallocated into a new equity position in Ithaca Energy.
Bottom up investment process
NCYF’s portfolio is built through a bottom-up process, based on detailed fundamental analysis of each investment’s credit risk and return potential. This assesses free cash flow across the capital structure, including equity, debt, preferred stock and convertibles; the potential impact of changes in cash flow, interest rates or competitive pressures; the company’s track record in meeting obligations; and the quality of management.
The manager seeks securities that appear undervalued and capable of generating attractive income relative to their risk, with scope for capital appreciation as they rerate. Whilst income generation and sustainability are central to the process, capital preservation remains a key focus; the manager is not prepared to sacrifice capital in pursuit of yield.
Low turnover portfolio
NCYF maintains a moderately concentrated portfolio. The top 10 holdings account for 25–30% of the portfolio.
The portfolio typically holds around 110–120 issues and is moderately concentrated, with the top 10 usually accounting for about 25%–30% of assets. The largest positions tend to be relatively liquid in normal market conditions. The manager maintains a core group of well-understood holdings, resulting in inherently low turnover, excluding called positions.
Given limited secondary-market liquidity in many holdings, investments are selected on the basis that they offer attractive risk-adjusted returns through to maturity, rather than as trading positions. Where holdings exit early, this is usually because they have been called by the issuer, often at a worthwhile premium. Annual turnover is typically around 50%, although 30%–40% of this may reflect forced redemptions.
NCYF’s portfolio has a duration of around three-and-a-half to four years. It earns a geared return of around 8% per annum and pays out a yield in the region of 7%.
The portfolio typically has a relatively short duration of around three-and-a-half to four years, generates a geared return of about 8% per annum and pays a yield of around 7%. This has been achieved without using options or dividend stripping.
The manager does not hedge currency risk, but does take a macro view on currencies and avoids those it does not favour. For example, NCYF has not held any Australian dollar-denominated assets since 2014/15.
Exposure to niche issues and unrated bonds
Exposure to smaller niche issues and unrated bonds can earn a yield premium.
The manager’s ability to assign internal credit ratings allows it to assess smaller, niche and unrated issues. These can offer a premium of around 150–200bps for an equivalent level of risk, supporting NCYF’s ability to generate attractive risk-adjusted returns.
Investment restrictions
No defined limits on type of securities, countries, issue size or sectors.
Alongside fixed income securities, NCYF may invest in equities and other income-yielding securities. There are no formal limits by security type, country, issue size or sector, although exposure to any single investee company is limited to 5% of total investments. The fund may use derivatives, financial instruments, money market instruments and currencies for efficient portfolio management, and may invest in closed-ended and open-ended funds, subject to a 10% limit of total assets at the time of investment.
A maximum of 10% of total assets can be invested in collective investment vehicles.
NCYF may also invest up to 10% of total assets in securities that are neither listed nor traded, measured at the time of investment. This includes unlisted or unquoted securities expected to become convertible, at NCYF’s option, into listed or traded securities. Securities that subsequently cease to be listed or traded may also be retained where the manager considers this appropriate, subject to the same limit.
Gearing is currently limited to 25% of net assets by the board. This limit is reviewed periodically.
NCYF is permitted to borrow, with gearing capped at 25% of net assets at the time of borrowing and reviewed periodically by the board. The manager expects the portfolio to be normally fully invested, but may raise cash or increase exposure to money market instruments and derivatives when market conditions warrant a more defensive stance.
Risk management
NCYF’s board monitors the spread of investments.
In addition to the investment restrictions outlined above, the board monitors portfolio diversification to ensure exposure to individual countries, sectors and other risk factors remains appropriate. The manager also applies risk controls to monitor the portfolio and quantify and manage market and other relevant risks.
Oversight is provided by the risk management and performance analysis team within CQS.
Manulife | CQS has a permanent risk management function, independent of the portfolio manager. Its risk management and performance analysis team is not involved in managing NCYF’s portfolio, and operates policies, processes and procedures to identify, measure, monitor, report on and manage all material risks relevant to the fund’s strategy. Its systems include third-party applications such as Tradar, Sungard Front Arena and MSCI RiskMetrics, along with proprietary tools.
Asset allocation
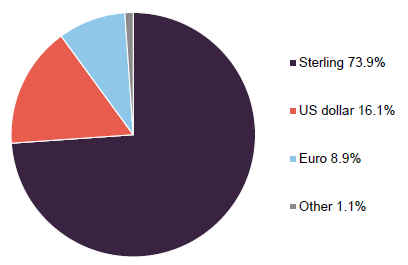
As at 30 April 2026, NCYF’s portfolio had exposure to 96 issues, down modestly from 99 a year earlier. As Figure 5 shows, the top 10 issues accounted for 35.7% of the portfolio, down from 38.2% at 30 April 2025. Figures 1 to 4 show the most recently available portfolio splits by asset class, fair value hierarchy, sector and currency.
NCYF has no exposure to utilities, reflecting the manager’s long-standing concerns over dividend sustainability in the sector. The portfolio also currently has no exposure to communication services. Although the sector has featured previously, the manager believes selectivity is essential given its exposure to high leverage, significant capex requirements, rapid technological change and regulatory risk.
Figure 1: NCYF portfolio split by asset class at 30 April 2026
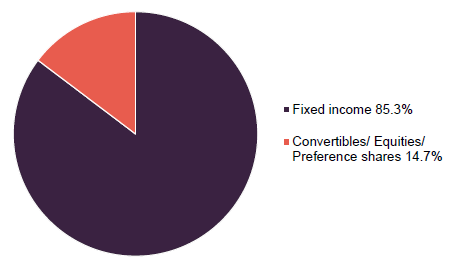
Figure 2: NCYF portfolio split by Fair value hierarchy at 31 December 20251
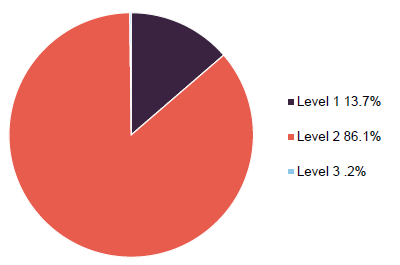
Figure 3: NCYF portfolio split by sector at 31 December 2025
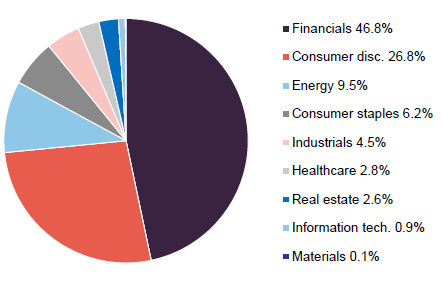
Figure 4: NCYF portfolio split by currency at 30 April 2026
These charts highlight several key themes. The portfolio is overwhelmingly invested in fixed income securities, with almost all holdings either quoted in an active market or valued using observable market prices, although around 7% trades OTC and is therefore relatively illiquid, even in normal conditions.
The portfolio is diversified by sector, but has a heavy weighting to financials, reflecting the manager’s positive view of selected bank and insurance issues. It is predominantly sterling-denominated, at around 74%, with a significant US dollar exposure of around 16%, and is entirely invested in developed market currencies.
NCYF’s investments are generally located in developed jurisdictions that are currently supportive of businesses.
Top 10 holdings
Figure 5 shows NCYF’s top 10 holdings as at 30 April 2026 and the changes over the preceding year. Reflecting the manager’s long-term, low-turnover approach, most of the issuers will be familiar to regular followers of NCYF’s portfolio announcements. As expected, there has been limited change in the concentration of the largest holdings. We discuss some of the more notable developments over the following pages. Readers interested in other top 10 names should refer to our previous notes, where many have been covered in more detail.
Figure 5: Top 10 holdings as at 30 April 2026
| Holding/issue | Sector | Portfolio weight 30 April 2026 (%) | Portfolio weight 30 April 2025 (%)1 | Percentage point change |
|---|---|---|---|---|
| Shawbrook Group 22-08/06/2171 FRN | Banks | 4.7 | 5.1 | (0.4) |
| Stonegate Pub 10.75% 24-31/07/2029 | Restaurants & bars | 4.5 | 3.3 | 1.2 |
| TVL Finance 10.25% 23-28/04/2028 | Hotels | 4.1 | 3.9 | 0.2 |
| RL Finance No6 23-25/11/2171 FRN | Insurance | 3.9 | 4.2 | (0.3) |
| Sherwood Financing 9.625% 24-15/12/2029 | Asset managers | 3.8 | 1.2 | 2.6 |
| Bellis Acquisition 8.125% 24-14/05/2030 | Grocery retail | 3.2 | 1.2 | 2.0 |
| Cidron Aida Finco 9.125% 25-27/10/2031 | Pharmaceutical | 3.2 | – | 3.2 |
| Barclays Plc 22-15/12/2170 FRN | Banks | 2.9 | 3.3 | (0.4 |
| Wheel Bidco 9.875% 21-15/09/2029 | Restaurants & bars | 2.9 | – | 2.9 |
| 888 Acquisitions 10.75% 24-15/05/203 | Gambling & Casinos | 2.7 | – | 2.7 |
| Total of top five | 20.8 | 21.9 | (1.1) | |
| Total of top 10 | 35.7 | 38.2 | (2.5) |
Shawbrook Group 22-08/06/2171 FRN – additional Tier 1 capital
Figure 6: Shawbrook Group 2171 bond price
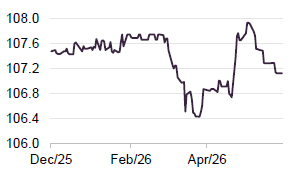
Shawbrook Group (shawbrook.co.uk) is a UK specialist bank focused on selected areas of SME and consumer lending, including specialist mortgages, business finance, asset finance and savings. NCYF has held Shawbrook bonds for several years, reflecting the manager’s familiarity with the credit and confidence in the bank’s focused lending model, capital position and management team.
The current holding is a sterling Additional Tier 1 security, making it a deeply subordinated bank-capital instrument rather than a conventional senior bond. Effectively perpetual, it may be called by Shawbrook at specified dates, subject to regulatory approval, but there is no obligation to redeem it. In return for accepting this subordination, extension risk and the potential for coupons to be cancelled in stress scenarios, investors receive a high coupon, currently just over 12%.
Stonegate Pub 10.75% 24-31/07/2029 – significant asset backing
Figure 7: Stonegate Pub 10.75% 2029 bond price
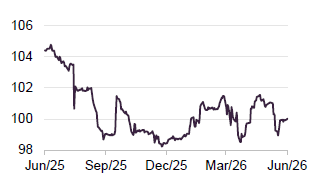
Stonegate Group (stonegategroup.co.uk) is the UK’s largest pub company, operating more than 4,500 pubs, bars and venues across community pubs, traditional inns, high-street bars and late-night venues. Its brands include Slug & Lettuce and Be At One, alongside a large leased and tenanted estate.
Stonegate bonds have long featured in NCYF’s portfolio. The manager believes the group’s extensive property portfolio provides significant asset backing, while its scale leaves it well placed to benefit from sector consolidation. The current holding is a sterling senior secured bond issued as part of Stonegate’s 2024 refinancing, which was supported by a £250m equity contribution from its private equity owner, TDR Capital.
Stonegate remains exposed to wage inflation, energy and food costs, business rates, changing consumer spending and a sizeable debt burden. However, NCYF’s manager believes the group is well managed and these risks are more than compensated for by the bond’s yield, senior secured ranking and asset backing.
TVL Finance 10.25% 23-28/04/2028 – benefits from scale in the budget hotel segment
Figure 8: TVL Finance 10.25% 2028 bond price
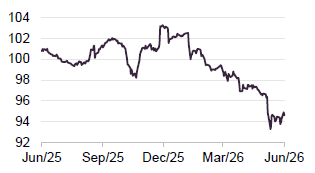
TVL Finance is the financing vehicle for Travelodge (travelodge.co.uk), one of the UK’s largest budget hotel operators, with a substantial estate across the UK, Ireland and Spain. The business benefits from a well-known brand, scale in the budget segment and exposure to both leisure and business travel. Its ongoing hotel refit programme, which had upgraded more than two-thirds of its room estate by the end of 2025, and modest international expansion, including 21 hotel openings during 2025, should also support trading.
The holding is a sterling senior secured bond with a 10.25% coupon and 2028 maturity. For NCYF’s manager, the attraction is the high income, secured ranking and exposure to a large, recognisable operator in the value-focused hotel market. The shorter maturity creates some refinancing risk, although Travelodge’s debt profile is reasonably spread, with £415m of senior secured notes due April 2028, €250m of floating-rate notes due June 2030 and a £50m revolving credit facility maturing in October 2027.
RL Finance No6 23-25/11/2171 FRN – Tier 1 capital
Figure 9: RL Finance FRN bond price
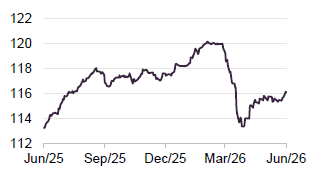
RL Finance Bonds No.6 is a financing vehicle for The Royal London Mutual Insurance Society, one of the UK’s largest mutual life, pensions and investment groups. The bond is a sterling Restricted Tier 1 insurance-capital security, making it a deeply subordinated perpetual instrument rather than a conventional corporate bond. Royal London may call the bond at specified dates, subject to regulatory approval, but is not obliged to redeem it. The instrument is designed to support Royal London’s Solvency II capital position and absorb stress if that position deteriorates. For NCYF, the bond provides high income from a large, established, profitable and well-capitalised UK mutual insurer, with relatively defensive underlying activities. However, this comes with the added complexity and risk of subordinated financial debt, which is explicitly designed to absorb losses under stress.
Sherwood Financing 9.625% 24-15/12/2029
Figure 10: Sherwood Fin. 9.625% 2029 bond price
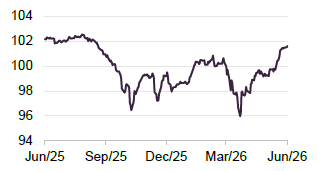
This sterling senior secured high-yield bond is issued by Sherwood Financing Plc, part of Sherwood Parentco/Arrow Global. It sits alongside €1.065bn of floating-rate senior secured notes due 2029 and €300m of 7.625% fixed-rate senior secured notes due 2029.
Arrow Global is a major European alternative asset manager and credit investor, backed by TDR Capital, with a focus on credit and real estate opportunities, including performing and non-performing loan portfolios. Its capital-light, fee-based model can generate attractive returns, but is sensitive to funding costs, collections performance, asset valuations, economic conditions and investor appetite for private and opportunistic credit strategies.
The bond is rated single B by Fitch, which affirmed the rating on 22 May 2026, with a stable outlook for Sherwood Parentco Limited, reflecting the group’s 2029 debt stack, including the euro floating-rate notes, euro 7.625% notes and sterling 9.625% notes.
Performance
As Figure 11 shows, NCYF’s NAV and share price total returns were ahead of our chosen benchmarks, LIBOR/SONIA +3% and CPI +4%, until inflation re-emerged and interest rates rose in response. This was first evident after Russia’s invasion of Ukraine and the 2022 UK “mini-budget”, both of which weighed on sentiment towards bonds and income-producing assets.
Figure 11: NCYF’s NAV and share price total return versus Libor/SONIA + 3% and CPI +4%, rebased to 100 over five years to 31 May 2026
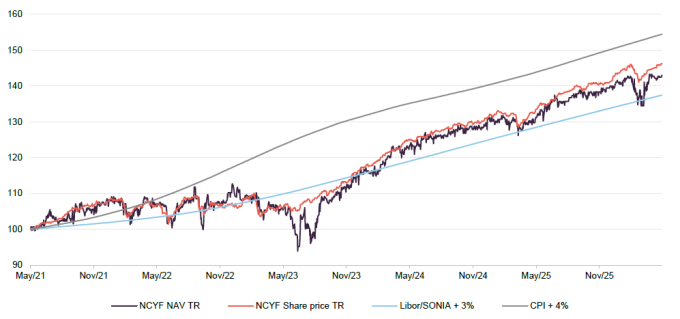
Performance began to recover from July 2023, as markets rallied on signs of cooling US inflation and hopes that major economies could avoid a severe recession. This also illustrates the tendency of bonds to pull back to par as they mature. Similar – but shorter-lived – disruptions are visible around Trump’s tariff announcements in April 2025 and, more recently, the outbreak of war in Iran.
Over five years, NCYF’s NAV and share price total returns are ahead of LIBOR/SONIA +3%, having recovered their earlier underperformance. They have also broadly kept pace with CPI +4%, although they have not yet fully recovered the underperformance suffered during 2022 and the first half of 2023. A more settled market backdrop should help NCYF close this gap and potentially overtake this more demanding benchmark.
Although all of NCYF’s peers are fixed-income-focused, most do not share its emphasis on high income. As Figure 12 shows, NCYF’s NAV has outperformed the peer group average over most periods up to five years. The picture is similar for the share price, which has also modestly outperformed the peer group average over 10 years.
Figure 12: Cumulative total return performance over periods ending 31 May 2026
| 1 month (%) | 3 months (%) | 6 months (%) | 1 year (%) | 3 years (%) | 5 years (%) | 10 years (%) | |
|---|---|---|---|---|---|---|---|
| NCYF NAV | 1.0 | 0.1 | 4.0 | 9.5 | 38.1 | 46.2 | 64.0 |
| NCYF share price | (0.2) | 0.2 | 3.4 | 8.9 | 35.6 | 43.0 | 99.8 |
| Libor/SONIA + 3%1 | 0.6 | 1.7 | 3.4 | 7.0 | 25.1 | 37.5 | 63.2 |
| CPI + 4% | 0.6 | 1.7 | 3.5 | 7.4 | 25.0 | 54.5 | 104.0 |
| Peer group average NAV | 0.8 | 0.8 | 2.7 | 7.5 | 37.4 | 37.6 | 88.8 |
| Peer group average share price | 0.9 | (0.4) | 1.8 | 6.4 | 40.8 | 39.2 | 99.5 |
Peer group
Please click here to visit QuotedData.com for a live comparison of the Debt – Loans and bonds peer group.
NCYF is a member of the AIC’s debt – loans & bonds sector, which comprises five members, which are illustrated in Figures 13 and 14. This peer group has shrunk in recent years as a number of funds have been wound up or merged. Members of Debt – Loans & Bonds will typically have over 80% invested in general debt instruments such as secured loans and bonds and syndicated lending; and an investment objective/policy to invest in general debt instruments such as secured loans and bonds and syndicated lending.
As noted in the performance section above, NCYF’s approach is distinctly different from the rest of its peers, in that the peer group has less focus on generating high levels of income than NCYF.
NCYF’s higher-yield focus meant it was hit harder than the peer group average during the COVID-related market sell-off in March 2020, which still affects the 10-year numbers, although it subsequently recovered strongly. It was also affected by the difficult bond market conditions of 2022 and the first half of 2023. Even so, NCYF generally ranks in the top half of the peer group, with its three-month figure likely affected by the rise in inflation expectations following the outbreak of war in Iran.
Figure 13: Peer group cumulative NAV total return performance to 31 May 2026
| 1 month (%) | 3 months (%) | 6 months (%) | 1 year (%) | 3 years (%) | 5 years (%) | 10 years (%) | |
|---|---|---|---|---|---|---|---|
| NCYF | 1.0 | 0.1 | 4.0 | 9.5 | 38.1 | 46.2 | 64.0 |
| CVC Income & Growth GBP | 0.6 | 0.4 | 2.6 | 8.1 | 31.4 | 21.8 | 74.5 |
| Invesco Bond Income Plus | 0.7 | 2.0 | 2.3 | 5.9 | 42.9 | 53.0 | 105.9 |
| M&G Credit Income | 0.0 | 0.6 | 1.7 | 4.9 | 24.4 | 28.1 | N/A |
| TwentyFour Select Monthly Income | 1.5 | 0.8 | 2.8 | 9.1 | 50.3 | 38.9 | 110.8 |
| NCYF rank | 2/5 | 5/5 | 1/5 | 1/5 | 3/5 | 2/5 | 4/4 |
| Sector arithmetic avg. | 0.8 | 0.8 | 2.7 | 7.5 | 37.4 | 37.6 | 88.8 |
| Sector arithmetic avg. exc. NCYF | 0.7 | 0.9 | 2.3 | 7.0 | 37.3 | 35.4 | 97.1 |
Figure 14: Peer group comparison – size, fees, discount, yield and gearing as at 12 June 2026
| Market cap (£m) | St. dev. of NAV returns over 1 year | Ongoing charges (%) | Perf. fee | Premium/ (discount) (%) | Dividend yield (%) | Gross gearing (%)1 | Net gearing (%)1 | |
|---|---|---|---|---|---|---|---|---|
| NCYF | 349 | 7.38 | 1.17 | No | 5.2 | 8.9 | 12.5 | 11.8 |
| CVC Income & Growth GBP | 79 | 4.51 | 1.66 | No | (0.8) | 6.84 | 2.0 | 2.0 |
| Invesco Bond Income Plus | 224 | 10.11 | 1.66 | No | 0.5 | 8.36 | 12.0 | 22.3 |
| M&G Credit Income | 480 | 3.73 | 0.88 | No | 1.6 | 7.08 | Nil | (1.8) |
| TwentyFour Select Monthly Income | 189 | 5.63 | 1.18 | No | 0.7 | 8.28 | Nil | (0.8) |
| NCYF rank | 2/5 | 3/5 | 3/5 | 1/5 | 1/5 | 5/5 | 4/5 | |
| Sector arithmetic avg. | 270 | 7.50 | 1.28 | 1.4 | 8.0 | 5.3 | 6.7 | |
| Sector arithmetic avg. exc. NCYF | 255 | 7.52 | 1.30 | 0.6 | 7.8 | 3.5 | 5.4 |
With NAV total returns tending to exceed the peer group average, its high yield does not appear to have come at the expense of total return.
NCYF is one of the largest funds in the peer group, ranking second by market capitalisation even after combining the two CVC Credit Partners European Opportunities share classes. Its above-average rating – currently the highest premium in Figure 14, and typically among the top two in the peer group – likely reflects its consistently high yield.
NCYF’s ongoing charges are modestly below the sector average, reflecting its above-average size. The only fund with a lower OCR is M&G Credit Income, the only peer group fund larger than NCYF. Assuming NCYF continues to grow as it has in recent years, its OCR should continue to edge lower, all else being equal. Like most funds in the peer group, NCYF does not charge a performance fee.
NCYF has the second-highest level of net gearing in the sector, but the relatively stable nature of the underlying strategies means these funds should be well placed to use gearing. If interest rates fall and capital values rise, NCYF should benefit from its higher market exposure, although the reverse is also true.
Notably, NCYF’s NAV return volatility is below the sector average, which is perhaps surprising given its higher-yield focus, and suggests that the additional yield has not been accompanied by higher volatility.
Quarterly dividend payments
The board intends to pay an attractive level of dividend income and the total annual dividend has increased every year since launch.
Subject to market conditions, performance and its financial position, NCYF aims to pay an attractive quarterly dividend, with all dividends paid as interims.
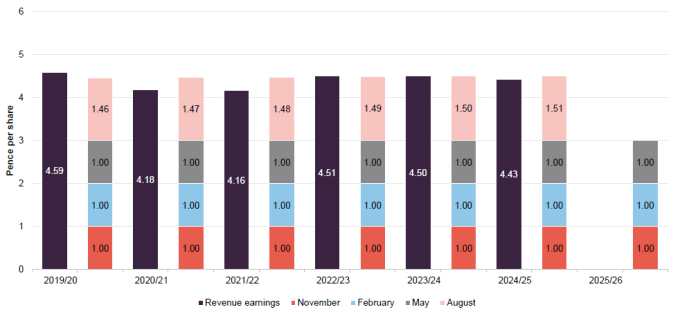
For each financial year, the first interim is paid in November, with the second, third and fourth paid in February, May and August. As Figure 15 shows, the first-quarter dividend rate is typically maintained for the second and third interims, followed by a larger fourth-quarter “balloon” payment. Although not a formal policy, NCYF’s total annual dividend has increased every year since launch.
Over half a year’s worth of dividends in reserve
The board avoids issuing stock close to ex-dividend dates to protect NCYF’s revenue reserve.
Over the longer term, revenue earnings have generally exceeded dividends, allowing NCYF to build a revenue reserve. The board can draw on this during periods of shortfall, as it did in FY2021 and FY2022, and marginally in FY2025. As at 31 December 2025, the revenue reserve stood at 2.26p per share, equivalent to 58% of the total FY2025 dividend. The board is also mindful of the dilutive impact of share issuance on the revenue reserve and avoids issuing shares close to ex-dividend dates.
In its interim results for the half year ended 31 December 2025, the board said that, as things stand, it expects to follow the same dividend payment pattern as last year and maintain or slightly increase the total dividend for the year.
Figure 15: NCYF revenue income and dividend by financial year (ended 30 June)
Premium/(discount)
Figure 16: NCYF premium/(discount) over five years to end May 2026
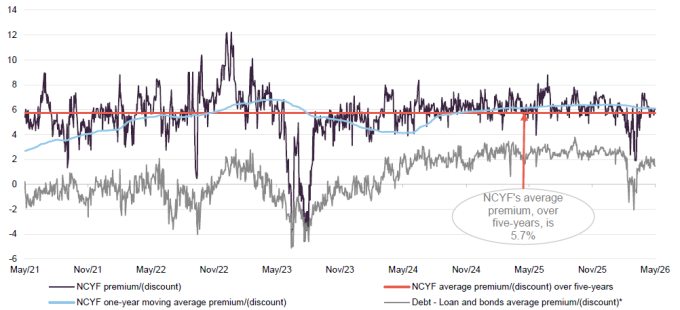
As Figure 16 shows, NCYF has traded predominantly at a premium over the past five years, typically within a 0%–10% range and averaging 5.7%. This reflects strong demand for the strategy and has supported continued share issuance. In the 12 months to 31 May 2026, NCYF issued 76m shares, increasing its issued share capital by 12.5%. Issuance is accretive to existing shareholders, as NCYF generally issues shares only when the premium exceeds 5%–6%. This allows the fund to grow in a measured way, with care taken to avoid diluting the revenue account; new issuance must generate sufficient income to cover itself before the next ex-dividend date. NCYF has also consistently traded at a marked premium to the debt – loans and bonds sector average, and this remains the case.
Structure
Fees and costs
NCYF has a tiered management fee.
The manager receives an annual fee of 0.8% of total assets, less current liabilities excluding bank borrowings, up to £200m; 0.7% between £200m and £300m; and 0.6% above £300m. The fee is paid monthly in arrears, with no performance fee, and the agreement is terminable by either party on 12 months’ notice.
BNP Paribas Securities Services S.C.A. provides company secretarial and administrative services, and also acts as custodian, banker and depositary. Secretarial and administration fees were £244,000 for the year ended 30 June 2025, compared with £214,000 in 2024. Bank and custody fees were £69,000, compared with £66,000, while depositary fees were unchanged at £45,000.
Allocation of fees and costs
Figure 17: NCYF Ongoing charges ratio (%)1
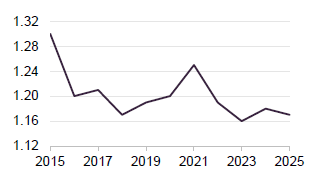
NCYF allocates investment management fees 40% to capital and 60% to revenue. Its ongoing charges ratio was 1.17% for the year ended 30 June 2025, down slightly from 1.18% in 2024, but marginally above the 1.16% reported for 2023.
As Figure 17 shows, the broader trend over the past decade has been lower ongoing charges, supported by growth in net assets, largely driven by sustained share issuance amid strong demand. The main exceptions were FY2015, during the Greek debt crisis and wider market turbulence, and the COVID period, when higher bond yields depressed capital values.
Further share issuance should continue to put downward pressure on the ongoing charges ratio, while falling interest rates over the past two years have supported capital values. However, renewed inflationary pressure and the potential for higher rates could weigh on asset values in the near term. Overall, NCYF appears well positioned for a lower ongoing charges ratio over the medium term.
Capital structure and life
Simple capital structure
NCYF has one class of ordinary share in issue.
NCYF has a simple capital structure, with a single class of ordinary shares listed on the premium segment of the London Stock Exchange. As at 16 June 2026, there will be 690,451,858 shares in issue, with none held in treasury. NCYF has a strong retail presence on its share register, with platforms accounting for over 60%.
The board has set a borrowing limit equal to 25% of NCYF’s net assets. NCYF has a £50m loan facility with BNP Paribas, London Branch.
NCYF is permitted to borrow, with the board setting and regularly reviewing gearing limits to ensure they remain appropriate. As at 30 June 2025, the maximum gearing limit was 25% of net assets. The company has a £50m loan facility with BNP Paribas, London Branch, priced at a 1.40% margin over the daily non-cumulative compounded risk-free rate. The facility expires on 18 December 2026 and carries a 0.45% commitment fee on the undrawn balance. As at 30 April 2026, NCYF’s gearing was 12.6%.
The facility includes covenants covering minimum NAV, loan-to-value, indebtedness cover and restrictions on additional borrowings, all of which NCYF has comfortably met.
Unlimited life with an annual continuation vote
NCYF has no fixed winding-up date, but shareholders vote annually on its continuation as an investment company. If the ordinary resolution is not passed, the board would bring forward proposals to liquidate, reconstruct or reorganise the company.
Financial calendar
NCYF’s year-end is 30 June. Annual results are typically released in October, interims in March, and AGMs held in November. The company pays quarterly dividends in November, February, May and August.
Board
NCYF’s board comprises five independent non-executive directors, with no shared directorships outside the company. Aggregate directors’ fees are capped at £250,000 per annum under the articles of association, and all directors stand for re-election annually.
Director’s average length of service is 5.6 years.
The board’s average tenure is 5.6 years, although three directors – Ian Cadby, John Newlands and Caroline Hitch – have now served for more than eight years. Board policy limits service to nine years, except in exceptional circumstances, and a succession plan is in place to ensure an orderly refreshment. Given current tenures, this is likely to be a key focus over the next couple of years, with the nomination committee also building diversity targets into its plans.
At the time of writing, the board has a 60/40 gender split, with a woman serving as chair and men holding the next two senior roles; audit committee chair and senior independent director. The board is currently entirely white British or white other, and acknowledges that it falls short of the target of at least one director from a minority ethnic background. It says that this, alongside knowledge and expertise, will be a key consideration in its next recruitment process.
As Figure 18 shows, all directors have personal investments in NCYF. We view this positively, as it helps align directors’ interests with shareholders. The chair’s holding is worth more than two years of her fees, which may provide further reassurance.
Three directors bought NCYF shares over the past 12 months: Andrew Dann purchased 25,000 shares at 51.892p on 27 June 2025, Caroline Hitch bought 50,000 shares at 50.415p on 8 April 2026, and Joanne Dentskevich bought 39,180 shares on 21 May 2026 at 50.499p. No directors sold shares during the period.
Figure 18: Board member – length of service and shareholdings
| Director | Position | Date of appointment | Length of service (years) | Annual fee (£)1 | Share-holding2 | Years of fee invested3 |
|---|---|---|---|---|---|---|
| Caroline Hitch | Chair | 16 March 2018 | 8.3 | 50,000 | 261,500 | 2.7 |
| Andrew Dann | Chair of the audit and risk committee | 1 February 2025 | 1.4 | 44,000 | 25,000 | 0.3 |
| Ian Cadby | Senior independent director, chair of the nomination committee and chair of the remuneration committee | 18 January 2017 | 9.4 | 37,500 | 25,000 | 0.3 |
| John Newlands | Chair of the management engagement committee | 5 October 2017 | 8.7 | 37,500 | 10,000 | 0.1 |
| Joanna Dentskevich | Director | 1 February 2026 | 0.4 | 37,500 | 39,180 | 0.5 |
| Average (service length, annual fee, shareholding, years of fee invested) | 5.6 | 41,300 | 72,136 | 0.8 |
Caroline Hitch (chair)
Caroline has worked in financial services since the early 1980s, including 24 years with HSBC Group in London, Jersey, Monaco and Hong Kong. Her roles focused on multi-asset and institutional global fixed income portfolios, with a particular interest in transparency and governance, and included a period as head of wealth portfolio management at HSBC Global Asset Management (UK) Ltd. Prior to HSBC, she worked at James Capel and Standard Chartered. Caroline is also a director of Schroder Asian Total Return Investment Company Plc and Standard Life Equity Income Trust Plc, and holds a degree in economics from the University of Cambridge.
Andrew Dann (chair of the risk and audit committee)
Andrew has more than 40 years’ experience advising local and international financial services clients, including regulated funds, fiduciary businesses and investment management structures. He spent almost 38 years as managing partner of Ernst & Young Channel Islands before becoming chairman. He has been a Fellow of the Institute of Chartered Accountants in England and Wales since 1987, and is a member of both the Institute of Directors and the Association of Investment Companies’ Channel Islands Committee.
Ian Cadby (senior independent director, chair of the nomination committee and chair of the remuneration committee)
Ian has more than 27 years’ experience as a board executive and investment manager in the hedge fund and derivatives trading industry, across Asia, the US, the UK and Jersey. He also has extensive experience in board strategy, corporate governance and risk management. He was formerly CEO of Ermitage Ltd and has held senior roles at Cadby Wauton, Regent Pacific and Citibank. A Jersey resident, Ian is founder and group CEO of fintech business Sequential Ermitage Limited and co-founder and CEO of its wholly-owned subsidiary, Tiller Investments Limited. Ian holds a Combined Science degree from Coventry University and has completed the Advanced Management Programme in Business/Finance at Harvard Business School. He is also a director of Aberdeen Asian Income Fund Limited.
John Newlands (chair of the management engagement committee)
Following a 26-year career in the Royal Navy, John moved into the City in 1995. He was most recently head of investment companies research at Brewin Dolphin from 2007 until his retirement in 2017, having previously held roles at Greig Middleton and Williams de Broë. He also founded Newlands Funds Research in 2003 and was a member of the Association of Investment Companies’ Statistics Committee from 2000 to 2017. John has an MBA from Edinburgh University Business School and is a Chartered Engineer, having gained a degree in Electrical and Electronic Engineering from the University of Brighton. He is a member of Durham Cathedral’s investment committee and has written four books on financial history, the latest covering Dunedin Income Growth Investment Trust.
Joanna Dentskevich (director)
Joanna has more than 35 years’ experience in risk, finance and investment banking, gained across global banks, alternative investments and the offshore funds industry. She was previously a director at Morgan Stanley, where she headed its customer valuations group, director of risk at Deutsche Bank, and chief risk officer of London-based hedge fund Allometry Capital. She has also served as a non-executive director of GCP Asset Backed Income Fund Ltd and EJF Investments Ltd. Joanna holds a BSc (Hons) in Maths and Accounting from Oxford Brookes University.
Previous publications
Figure 19: QuotedData’s previously published notes on NCYF
SWOT analysis
Figure 20: SWOT analysis for NCYF
| Strengths | Weaknesses |
|---|---|
| NCYF offers a relatively high dividend yield compared with many traditional equity income and investment-grade bond strategies.
The portfolio is diversified across issuers, sectors and geographies, reducing dependence on any single borrower or industry, helping to mitigate idiosyncratic default risk. The manager has long experience in high-yield and special situations credit markets. A well-resourced team is an advantage when selecting issuers and monitoring credits in a market where credits are illiquid and frequently held to maturity. NCYF’s closed-end structure allows it to take advantage of periods of volatility and can create attractive entry points in discounted bonds or stressed credits, allowing the manager to lock in higher yields and potential capital upside. |
High-yield issuers inherently carry greater credit risk and higher probability of default than investment-grade borrowers, particularly during economic slowdowns. However, the manager is well positioned to take advantage of mispricings when these occur.
The underlying credit and therefore NCYF’s NAV can be affected by the prevailing economic conditions. For example, recessionary environments can widen spreads and pressure valuations, although the reverse is also true. NCYF employs gearing to enhance returns, and this has added value over the longer term. However, it can also magnify losses during periods of credit market weakness – the reverse is also true – although the manager does not use gearing rigidly and will ease it down when he believes the outlook is softening. The underlying asset class tends to be illiquid and can become more so during stressed markets, leading to wider bid-offer spreads and valuation volatility. |
| Opportunities | Threats |
| Rising base rates widen credit spreads and increase yields across credit markets, potentially allowing the managers to access stronger long-term income streams on new/reinvestment.
Periods of geopolitical stress, tariff uncertainty or recession fears increase the potential for mispriced credits that the manager can exploit. Discounted bonds of fundamentally sound issuers have the potential to recover strongly if refinancing conditions improve or if issuers are successful in being able to deleverage (say moving them from high yield to investment grade). Economic stabilisation in Europe and the UK could support improved corporate fundamentals among selected issuers, leading to spread compression and NAV upside. If inflation moderates and central banks eventually reduce rates, high-yield bonds could benefit from both income carry and capital appreciation. |
Weak growth combined with persistent inflation could increase defaults while keeping financing costs elevated – a difficult environment for leveraged borrowers.
Persistently high policy rates increase refinancing pressure on lower-rated issuers and may suppress bond prices. A deterioration in corporate earnings, consumer demand or financing conditions could lead to increased restructurings and credit losses. Geopolitical instability – for example, Middle East conflict, trade wars, tariff escalation and energy market disruption – could widen credit spreads and reduce investor risk appetite. High-yield markets can experience sudden liquidity withdrawals during stress periods, leading to sharp price declines and NAV volatility. Growing scrutiny of leveraged finance, fossil fuel exposure and ESG considerations may reduce investor demand for certain parts of the high-yield universe. |
Bull vs. bear case
Figure 21: Bull vs. bear case for NCYF
| Aspect | Bull case | Bear case |
|---|---|---|
| Performance | Whilst there is the prospect of capital growth, investors should expect the majority of their returns to be in the form of income.
Although NCYF invests in higher-yield credits, which by definition have higher risk attached than investing in ‘investment grade bonds’, these offer a yield premium, which supports a higher yield for NCYF. NCYF’s manager is backed by a deep resource allowing detailed credit analysis – even applying their own internal ratings to otherwise unrated bonds (which also attract a yield premium). Idiosyncratic risk is well spread |
Rising interest rates, on the back of rising inflation expectations (which are currently on the increase fuelled by energy price rises), will cause the capital value of fixed rate bonds to fall within the portfolio. This has the effect of depressing the NAV, albeit amplifying the portfolio’s yield.
However, provided the credits continue to pay interest, total income is unaffected and, as these assets tend to be held to maturity, or when called (typically at a premium due to early redemption clauses), these bonds will pull back to par as they mature, reversing the previous NAV fall. The reverse is also true. |
| Dividends | NCYF focuses on paying a high level of income quarterly. In selecting credits, emphasis is given to protecting capital, which in turn supports future income generation. Reflecting this, NCYF’s dividend has grown every year since launch.
NCYF has over half a year’s worth of revenue reserves that it can use to smooth dividends where there is a revenue shortfall. NCYF’s board has said it expects to maintain or slightly increase the total level of dividends for the year ending 30 June 2026. The board also avoids issuing stock close to ex-dividend dates to protect the revenue reserve and has said that it expects to maintain or slightly increase the total level of dividends for the current year. |
A prolonged lower interest rate environment could make it harder for the manager to achieve the high levels of income that NCYF targets. In the near term, NCYF’s board could draw on its revenue reserve, but this could be exhausted eventually.
However, credit risk will likely be lower in such an environment and NCYF successfully navigated the 15-year period of low interest rates following the GFC, so the risk of this scenario looks very limited, particularly in an environment where inflation risk and interest rate risk appears to be to the upside. |
| Outlook | Whilst the US outlook has softened, the outlook for Europe and the UK was improving prior to the outbreak of hostilities in Iran (for example, better than expected activity in the UK, growing demand and stronger order books). Signs of a resolution in the Middle East could see these trends return to the fore. | An escalation in tensions in the Middle East could drive energy costs higher, weighing on growth and driving up interest rates and widening credit spreads. However, the manager has long been concerned about inflationary risks – seeing stagflation in the UK as a possibility – and has been positioning the portfolio accordingly. The portfolio is now positioned with a focus on the medium- to long-term impact of potential energy disruption on global growth and inflation. |
| Discount | NCYF overwhelmingly trades at a premium reflecting strong demand for its strategy, driven by its high yield. Shares are issued at premiums of 5-6% and above so as to cover the costs associated with new issuance and provide a small uplift in NAV per share for existing holders. Barring severe market dislocations, shareholders can generally enter and exit NCYF around these levels. | NCYF rarely trades at a discount. Interest rate rises or a market dislocation can cause its credits to derate and the resulting drop in performance can precipitate a discount. However, the effects tend to be short-lived. Reflecting its strong history of selecting good credits, losses are limited and asset values will tend to pull back to par over time. |
IMPORTANT INFORMATION
This marketing communication has been prepared for CQS New City High Yield Fund Limited by Marten & Co, which is authorised and regulated by the Financial Conduct Authority (FCA). It constitutes non-independent research as defined under the UK MiFID II regime and the onshored Commission Delegated Regulation (EU) 2017/565.
This communication is intended for use by investment professionals as defined in Article 19(5) of the Financial Services and Markets Act 2000 (Financial Promotion) Order 2005. Marten & Co is not authorised to provide advice to retail clients. Accordingly, if you are not a professional investor, or are otherwise restricted from receiving this information, you should disregard it. The note does not have regard to the specific investment objectives, financial situation and needs of any specific person who may receive it.
The note has not been prepared in accordance with legal requirements designed to promote the independence of investment research and as such is considered to be a marketing communication. The analysts who prepared this note are not constrained from dealing ahead of it, but in practice, and in accordance with our internal code of good conduct, will refrain from doing so for the period from which they first obtained the information necessary to prepare the note until one month after the note’s publication. Nevertheless, they may have an interest in any of the securities mentioned within this note.
This note has been compiled from publicly available information. This note is not directed at any person in any jurisdiction where (by reason of that person’s nationality, residence or otherwise) the publication or availability of this note is prohibited.
Accuracy of Content: Whilst Marten & Co uses reasonable efforts to obtain information from sources which we believe to be reliable and to ensure that the information in this note is up to date and accurate, we make no representation or warranty that the information contained in this note is accurate, reliable or complete. The information contained in this note is provided by Marten & Co for personal use and information purposes generally. You are solely liable for any use you may make of this information. The information is inherently subject to change without notice and may become outdated. You, therefore, should verify any information obtained from this note before you use it.
No Advice: Nothing contained in this note constitutes or should be construed to constitute investment, legal, tax or other advice.
No Representation or Warranty: No representation, warranty or guarantee of any kind, express or implied is given by Marten & Co in respect of any information contained on this note.
Exclusion of Liability: To the fullest extent allowed by law, Marten & Co shall not be liable for any direct or indirect losses, damages, costs or expenses incurred or suffered by you arising out or in connection with the access to, use of or reliance on any information contained on this note. In no circumstance shall Marten & Co and its employees have any liability for consequential or special damages.
Governing Law and Jurisdiction: These terms and conditions and all matters connected with them, are governed by the laws of England and Wales and shall be subject to the exclusive jurisdiction of the English courts. If you access this note from outside the UK, you are responsible for ensuring compliance with any local laws relating to access.
No information contained in this note shall form the basis of, or be relied upon in connection with, any offer or commitment whatsoever in any jurisdiction.
Investment Performance Information: Please remember that past performance is not necessarily a guide to the future and that the value of shares and the income from them can go down as well as up. Exchange rates may also cause the value of underlying overseas investments to go down as well as up. Marten & Co may write on companies that use gearing in a number of forms that can increase volatility and, in some cases, to a complete loss of an investment.