
The long and short of emerging markets
Fidelity Emerging Markets Limited (FEML) provides investors with access to emerging market equities. Its managers operate an unconstrained mandate, investing across the market cap spectrum and maintaining broad diversification by geography and sector. According to the manager, a differentiating feature is the fund’s use of short positions held alongside its long book, which they say gives exposure to opportunities and inefficiencies at various quality levels of the market.
Performance numbers have been strong during the last 12 months; a period where conditions for emerging markets have broadly been favourable. This has been accompanied by a tightening in the discount, with the possibility that this could narrow further if sentiment improves.
Long-term capital growth from emerging markets
FEML aims to achieve long-term capital growth from an actively managed portfolio made up primarily of securities and financial instruments providing exposure to emerging market companies, both listed and unlisted.
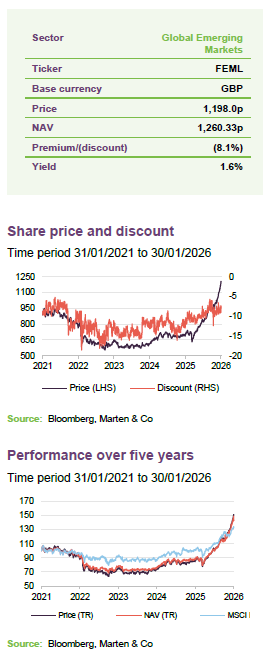
| Year ended | Share price total return (%) | NAV total return (%) | MSCI Emerging Markets total return (%) | MSCI World total return (%) |
|---|---|---|---|---|
| 31/01/22 | (10.0) | (8.3) | (5.1) | 19.4 |
| 31/01/23 | (16.9) | (15.8) | (3.9) | 1.4 |
| 31/01/24 | (1.3) | (1.9) | (5.6) | 14.0 |
| 31/01/25 | 18.7 | 17.8 | 17.7 | 24.5 |
| 30/01/26 | 71.2 | 59.6 | 30.4 | 9.1 |
Source: Bloomberg, Marten & Co. Note: 1) The fund was managed by Genesis Investment Management prior to October 2021.
Fund profile
Fidelity took over management of the trust in October 2021.
Established in 1989, FEML invests across emerging and select frontier markets with the stated aim of achieving long-term capital growth. In October 2021, Fidelity International was appointed as FEML’s manager, and the trust changed its name from Genesis Emerging Markets Fund. Since then, the trust has drawn on Fidelity’s global analyst network to build a portfolio of long positions in companies the managers consider to be quality, alongside short positions. Investment is typically in listed companies, and the mandate allows the use of derivatives, which the managers say gives them flexibility to express their views and manage risk.
The lead manager of the portfolio is Nick Price, with Chris Tennant as co-manager, who took over upon Fidelity’s appointment. Both have experience in emerging markets and use Fidelity’s on-the-ground research to source ideas and monitor risks. This resource includes approximately 50 analysts across different regions and sectors. According to Fidelity, Nick and Chris use a disciplined and repeatable process focused on fundamental, stock-specific research.
The managers employ an “extension” style of management that combines long positions in selected franchises with short positions in other businesses (sometimes through pair trades), which may hedge risk and create the potential for additional upside. This approach allows gross market exposure to exceed shareholders’ funds, while typically keeping net equity exposure near 100% of total net assets. The trust has a diverse spread of market cap and sector exposure. Its long book is focused on companies that the managers believe have durable cash generation at reasonable valuations.
The MSCI Emerging Markets Index is FEML’s official benchmark. While the portfolio is constructed on a bottom-up basis, the managers comment that some consideration is given to the composition of the index, particularly with regard to country weightings.
FEML provides an alternative approach to traditional long-only peers for investors seeking exposure to emerging markets within a closed-ended structure. The combination of active stock selection, selective shorting, and gearing aims to capture emerging market growth while potentially reducing market volatility.
Manager’s view & current themes
Multi-country emerging markets funds tend to hold a wide variety of investments across different sectors and geographies. While the portfolio is constructed using a bottom-up approach, a number of themes appear to be present within the portfolio.
Artificial intelligence
The global equity market rally of recent years appears to have been influenced, in part, by developments in artificial intelligence (AI). However, the focus so far seems to have mainly been on larger cap companies in developed markets, particularly the so called “Magnificent Seven” mega-cap US technology companies. The extent to which artificial intelligence supply chains are present within emerging markets may be less widely recognised. The managers comment that this is particularly evident with Taiwan Semiconductor (TSMC), but this may also apply further down the supply chain. Here, they highlight that companies such as Elite Material – which makes copper-clad laminates used in printed circuit boards – are often found on lower valuations.
The technology-heavy Taiwanese equity market is cheaper than its US equivalent but has generally been more expensive than other emerging markets. The market turmoil that followed “Liberation Day” in April, when President Trump announced tariffs, led to the market reaching its “limit down” on several days. The market has since recovered.
Gold and copper
Nick and Chris have believed for some time that the market backdrop may be conducive to positive performance for both gold and copper. According to Nick and Chris, gold is supported by structural demand from both the retail market and central banks, and may be influenced by heightened geopolitical tensions. Gold miners are viewed by Nick and Chris as potentially attractive, with cost rises limited given weak oil prices in their view. They believe that that the copper price is underpinned by its role in the energy transition and ongoing supply constraints.
The gold price has risen significantly since the beginning of 2024, and this has contributed positively to FEML’s performance. Nick and Chris have been active in repositioning their gold exposure, taking profits in companies that have performed well and reinvesting into names that have underperformed. Nick and Chris believe that, even if the gold price were to fall, the companies in FEML’s portfolio would still be attractive due to what they consider to be cheap valuations.
The price of copper also increased in 2025, though to a lesser extent. There appears to be increased demand from the growth in data centres, while the supply of copper appears to be constrained.
China
China remains the largest component of the index (see Figure 3). FEML’s managers avoid banks in the country, as they view the sector as challenged due to thin profit margins, squeezed earnings and concerns about asset quality. However, the managers state that they are more comfortable with exposure to technological leaders in the industrials sector and select consumer exposure, for example in experiences categories like music streaming. The most significant Chinese exposure is currently achieved through Naspers, which is listed in South Africa but holds a large stake in Chinese internet business Tencent.
Financials
FEML’s managers state that their exposure to the financials sector is not intended as a bet on the future direction of interest rates. Some of the portfolio’s companies, such as fintech firms, may benefit from lower rates, while others, such as their Indonesian banks, tend to perform better when rates are higher.
Instead, the investments are designed to benefit from structural growth. The managers comment that FEML’s holdings in Indian and Indonesian banks provide exposure to the expansion of the middle class in markets where many companies and sectors already have high valuations. They add that, in contrast, holdings such as Hungarian and Greek banks trade at a discount to both their peers and recent history, which may be due to the country they are listed in rather than their fundamentals.
Investment process
Nick and Chris also run the open-ended Fidelity FAST Emerging Markets Fund.
Nick and Chris manage FEML as well as the Fidelity FAST Emerging Markets Fund. The Fidelity FAST Emerging Markets Fund was launched in 2011 and uses the same long-short strategy, albeit with some minor differences. The open-ended fund has been managed by Nick (more recently alongside Chris) since its launch.
The trust is not subject to UCITs rules and can therefore hold more than 10% of assets in one holding, as is the case with the current position in Taiwan Semiconductors. There are some small legacy holdings remaining from when Nick and Chris took over management from Genesis in 2021.
Figure 1: FEML’s research and investment process
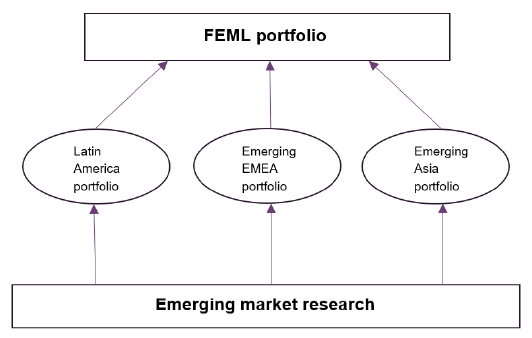
Nick and Chris are supported by a large team of analysts, each covering 20-30 stocks.
FEML’s investment process uses Fidelity’s broader resources, including the research team and Fidelity’s regional EM portfolios. Chris and Nick are supported by a large team of analysts, some of whom are in Asia and the remainder in the UK, each covering between 20 and 30 stocks. From this initial list, each regional emerging markets portfolio manager filters selected names into the relevant sub-portfolios as outlined in Figure 1. From these ideas, Chris and Nick, after further analysis, select stocks for the FEML portfolio. The team also uses the work of shorting analysts, including a dedicated emerging markets shorting analyst. Chris and Nick have the final decision on any investment, and there is no specific requirement for a stock to have first been held within one of the sub-portfolios, although this is typically the case.
FEML has a “go anywhere” approach. Its closed-ended structure allows its managers to invest in companies with smaller market capitalisations, without being required to meet the liquidity requirements of an open-ended fund. The focus is on holding what the managers consider to be quality names in the long book.
In this context, quality refers to companies that generate returns that appear to be superior and sustainable throughout the business and market cycle. Companies selected tend to have net cash on their balance sheet, deliver returns that the managers consider robust, display practices that suggest good corporate governance, and include measures that protect minority shareholders. These companies will tend to screen favourably on valuation and quality metrics.
The ability to short
FEML’s ability to short makes it unique in the emerging markets sector.
FEML differs from others in the sector in that, alongside its long book, the managers also hold a series of short positions, whereby the fund gains from any fall in value of the holding. These shorts typically represent 30-35% of the portfolio’s total exposure. They are made up of a combination of one-off short positions and pair trades – in the case of the latter, a short position is paired with a long position in a correlated company.
The short book positions are intended to be the mirror opposite of those in the long book. For inclusion, a company is required to meet two criteria: being in either fundamental or cyclical decline, and having several red flags related to its balance sheet. A new short position is not initiated on valuation grounds alone; fundamental concerns with the balance sheet must also be identified. Short positions typically do not exceed 100bps and average around 40bps.
According to management, a further feature of the short book is that, although there is a broad aim for net exposure in the portfolio of around 100%, the short positions can be offset against additional long holdings, which may extend long exposure to around 130-135%.
The specific identities of active short positions are not disclosed by the managers.
Asset allocation
As at 31 December 2025, FEML’s current gross market exposure was 157.1%, reflecting the portfolio’s short positions held alongside its long book. The net equity exposure was 106.9%.
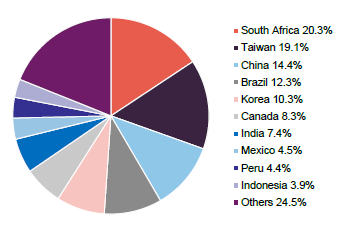
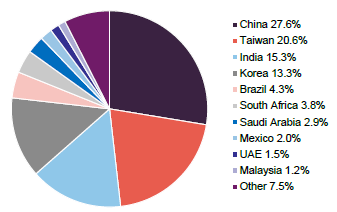
As shown in Figures 2 and 3, FEML’s geographic exposure differs from the index. The portfolio’s active share was 129.9% for the year ended 30 June 2025.
Figure 2: FEML geographic allocation as at 31 December 2025*
Source: Fidelity Investment Companies. *Note: as a proportion of net assets
Figure 3: MSCI Emerging Markets geographic allocation as at 31 December 2025
Source: MSCI
Some of the allocations in Figure 2 may not fully reflect the underlying exposures. The large overweight position to South Africa, FEML’s largest geographical weighting, is partly due to the holding of Naspers, the fund’s second-largest individual position (see page 8). A significant proportion of the value of this holding is attributable to its stake in Chinese company Tencent. For the same reason, the apparent underweight position to China may be less pronounced on a look-through basis, after accounting for the Tencent exposure.
Apart from China and South Africa, FEML has an overall underweight position to Taiwan. According to the managers, this market tends to trade on a higher multiple than other emerging markets and they believe there are better opportunities elsewhere, although they state that there are opportunities along the AI supply chain, and exposure has been increased in recent months. The fund is also underweight India and Korea, but overweight Brazil.
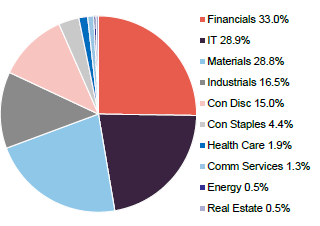
Figure 4: FEML sector allocation as at 31 December 2025*
Source: Fidelity Investment Companies. *Note: as a proportion of net assets
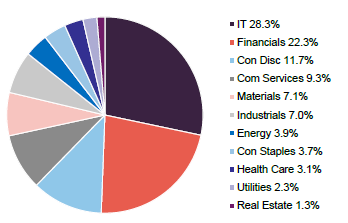
Figure 5: MSCI Emerging Markets sector allocation as at 31 December 2025
Source: MSCI
FEML has a 1.3% negative net exposure to the utilities sector, due in part to relevant short positions. The largest absolute long allocation is to financials, with two of the fund’s top 10 holdings belonging to the sector (see Figure 6). The second-largest allocation is to IT, which is broadly in line with the index. Materials is the third-largest allocation, and also represents the largest overweight versus the index. This appears to reflect the managers’ view of the sector, particularly gold and copper.
Top 10 holdings
Figure 6: Top 10 holdings as at 31 December 2025
| Holding | Sector | Country | Allocation 31 December 2025 (%) | MSCI Emerging Markets Index (%) | Relative versus index |
|---|---|---|---|---|---|
| Taiwan Semiconductor | Information technology | Taiwan | 13.8 | 11.9 | 1.9 |
| Naspers | Consumer discretionary | South Africa | 7.8 | 0.5 | 7.3 |
| Pan African Resources | Materials | South Africa | 4.1 | 0.0 | 4.1 |
| Samsung Electronics | Information technology | Korea | 3.7 | 4.3 | (0.6) |
| OTP Bank | Financials | Hungary | 3.1 | 0.2 | 2.9 |
| Aura Minerals | Materials | Brazil | 3.0 | 0.0 | 3.0 |
| Contemporary Amperex Technology | Industrials | China | 3.0 | 0.2 | 2.8 |
| Sieyuan Electric | Industrials | China | 2.9 | 0.0 | 2.9 |
| TBC Bank | Financials | UK | 2.8 | 0.0 | 2.8 |
| Cia de Minas Buenaventura | Materials | Peru | 2.5 | 0.0 | 2.5 |
| Total of top 10 | 46.9 | 16.6 |
Sieyuan Electric
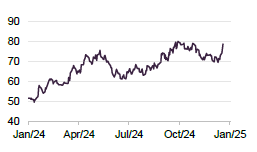
Figure 7: Sieyuan Electric (CNY)
Source: Bloomberg
Sieyuan Electric (www.sieyuan.com) is a Chinese grid equipment supplier and is the only private company competing with a group of State-Owned Enterprises (SOEs). The company originated in high-voltage gas insulated switches, an area where FEML’s managers say it has benefit from global supply and demand dynamics. According to the company, its private ownership model has enabled it to attract R&D engineers and expand into new product lines. This expansion has contributed to an increase in its market share in a sector that may also be experiencing growth.
FEML’s managers believe Sieyuan could benefit from continued rising demand, as the shift in global power generation and the build-out of renewables could require extensive grid reinforcement.
TBC Bank
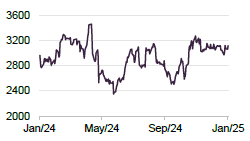
Figure 8: TBC Bank (GBP)
Source: Bloomberg
TBC Bank (www.tbcbankgroup.com) is a mid-cap Georgian banking group. Georgia has a population of just under 4 million people and TBC is one of two dominant banks in the country, which together have about 80% market share. TBC Bank earns returns on equity of more than 25% and trades on approximately 5x earnings. Nick and Chris describe this as a very cheap multiple for a dominant, profitable bank.
TBC has launched a digital bank in Uzbekistan, a market with a population 10 times the size of Georgia’s, providing significant potential for expansion in the managers’ view. They add that with an experienced CEO, who has a track record of running fintech companies, the expansion into Uzbekistan offers additional optionality.
Aura Minerals
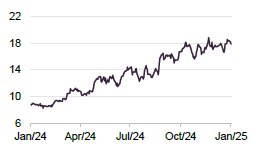
Figure 9: Aura Minerals (CAD)
Source: Bloomberg
Aura Minerals (www.auraminerals.com) is a Brazilian gold miner which Nick and Chris believe remains relatively cheap despite the rally in the gold price this year. At current production levels, the company can generate a free cash flow yield of over 20% at gold prices as low as $3k/oz, which is below today’s spot levels.
The managers observe that, while Aura’s capital expenditure levels are also high, the company can fund this out of cash while still maintaining its current dividend, and production may double once the current project pipeline is complete.
Other notable holdings
Alfamart
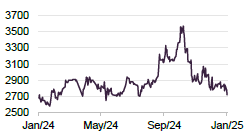
Figure 10: Alfamart (IDR)
Source: Bloomberg
Alfamart (www.alfamart.co.id) is an Indonesian grocery retailer, predominantly in the minimarket space. The company is trading at a historical low, having recently derated to a price to earnings ratio of approximately 20x, against a backdrop of macroeconomic uncertainty in Indonesia and weak margins. FEML’s managers believe it has the potential to be a high-quality compounder over the long term.
Formal retail penetration remains low in Indonesia and, as a result, the managers think that it could have a decade-long runway of rolling out new stores. Nick and Chris believe Alfamart has a competitive position, as the stronger player in a duopoly market.
Orizon
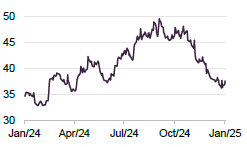
Figure 11: Orizon (BRL)
Source: Bloomberg
Orizon (www.orizonvr.com) is a waste management business that operates landfill sites in Brazil. The company appears to have pricing power due to the local monopolies it holds, and FEML’s managers expect to see continued margin expansion from price negotiations in the coming years. In addition, landfill penetration in Brazil is currently around 60%, which suggests there may be room for volume growth in the sector as regulation around refuge treatment continues to tighten.
Orizon may have an opportunity to increase earnings by adding biomethane capacity or through inorganic expansion, where it could acquire assets at lower multiples.
Kazatomprom
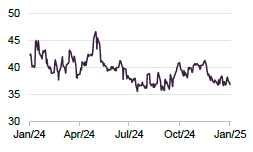
Figure 12: Kazatomprom (USD)
Source: Bloomberg
Kazatomprom (www.kazatomprom.kz) is one of the largest uranium miners in the world, with attributable output accounting for approximately 20% of global production. The managers think that the current supply and demand outlook for uranium favours producers and could prompt a re-rating.
FEML’s managers believe that the rapid expansion of AI and data centre infrastructure could lead to increased demand for energy, and that nuclear power could be one of the potential solutions to this growing demand, to the benefit of the uranium price. Kazatomprom is trading at a low multiple in the managers’ view, who note that it pays out almost the entirety of its earnings in dividends.
Performance
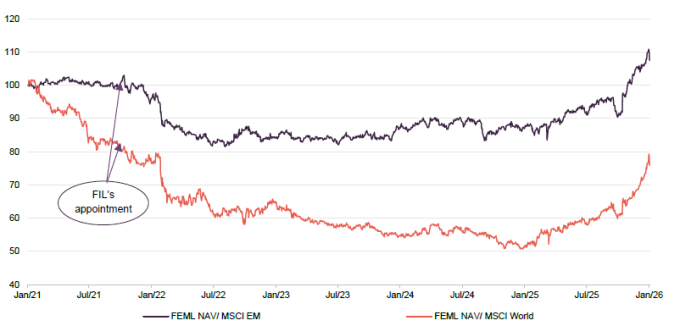
Figure 13: FEML’s NAV total return relative to emerging market and global indices, over five years to 30 January 2026
Source: Bloomberg, Marten & Co
Figure 14: Cumulative total return performance over periods ending 30 January 2026
| 1 month (%) | 3 months(%) | 6 months (%) | 1 year (%) | 3 years(%) | 5 years(%) | |
|---|---|---|---|---|---|---|
| FEML NAV | 9.0 | 23.2 | 41.1 | 59.6 | 84.3 | 42.2 |
| FEML share price | 12.4 | 29.0 | 46.5 | 71.2 | 100.6 | 50.0 |
| MSCI Emerging Markets index | 6.8 | 4.9 | 19.6 | 30.4 | 44.9 | 32.3 |
| MSCI World index | 0.3 | (0.9) | 7.9 | 9.1 | 54.8 | 87.4 |
FEML’s current management was appointed towards the end of 2021. The underperformance during 2022 appears to have been related to the overweight exposure to Russia at the time of the invasion of Ukraine in 2022. These positions were subsequently written down to zero due to the lack of price discovery and the inability of foreigners to trade the market. Some have subsequently been disposed of by trading over the counter, while others remain. This was accompanied by an underweight position to parts of the market that increased in value at the time, such as the Middle East. FEML’s relative performance appears to have improved subsequently, and the NAV has outperformed the index.
FEML has lagged the MSCI World Index since the managers took over. The MSCI World Index is dominated by the US equity market (currently over 70% of the total), which is itself dominated by mega-cap technology companies. These companies have performed strongly over recent years, outperforming most other assets, while the performance of emerging markets has been more mixed.
Peer group
FEML is in the global emerging markets sector, which currently has 11 members. Africa Opportunity has been excluded on size grounds, as it has a market cap of £6m and is not included as a comparator for FEML. Members of this sector typically have:
- over 80% invested in quoted global emerging market shares;
- less than 80% in any single geographic area;
- an investment objective or policy to invest in global emerging market shares; and
- a global emerging market benchmark.
Peer group performance
Figure 15: Peer group cumulative NAV total return performance to 30 January 2026
| 1 month (%) | 3 months(%) | 6 months (%) | YTD (%) | 1 year (%) | 3 years(%) | 5 years(%) | FIL’s tenure*(%)1 | |
|---|---|---|---|---|---|---|---|---|
| FEML | 9.0 | 23.2 | 41.1 | 9.0 | 59.6 | 84.3 | 42.2 | 48.2 |
| Ashoka WhiteOak EM | 6.7 | 5.3 | 19.4 | 6.7 | 29.2 | – | – | – |
| Barings Emerging EMEA | 10.2 | 11.1 | 21.6 | 10.2 | 31.9 | 68.9 | 42.7 | 21.2 |
| BlackRock Frontiers | 6.8 | 9.4 | 15.6 | 6.8 | 19.9 | 52.6 | 99.5 | 70.3 |
| JPMorgan Emerging EMEA | 8.7 | 10.1 | 17.4 | 8.7 | 25.9 | 56.6 | (88.8) | (91.8) |
| JPMorgan Emerging Mrkts | 8.3 | 7.7 | 25.2 | 8.3 | 29.1 | 36.9 | 25.2 | 25.7 |
| JPMorgan Global EM Inc | 8.5 | 8.3 | 22.0 | 8.5 | 31.3 | 48.1 | 54.9 | 51.0 |
| Mobius | 5.8 | 4.2 | 11.2 | 5.8 | 3.2 | 19.3 | 45.8 | 13.7 |
| Templeton Emerging Mrkts | 12.7 | 11.0 | 31.1 | 12.7 | 49.0 | 73.2 | 49.0 | 65.2 |
| Utilico Emerging Markets | 5.9 | 9.4 | 16.9 | 5.9 | 23.5 | 40.4 | 69.1 | 49.1 |
| FEML rank | 3/10 | 1/10 | 1/10 | 3/10 | 1/10 | 1/9 | 7/9 | 5/9 |
| Sector arithmetic avg. | 8.3 | 10.0 | 22.1 | 8.3 | 30.3 | 53.4 | 37.7 | 28.1 |
| Sector arithmetic avg. exc. FEML | 8.2 | 8.7 | 20.3 | 8.2 | 27.3 | 49.9 | 37.2 | 25.8 |
As outlined in Figure 15, FEML’s short-term NAV performance, up to one year, compares favourably to its peer group, ahead of every other fund in the sector over 3 months, 6 months and a year. Over three-years, FEML is also the highest-ranked fund. The five-year number – which includes the period of Genesis’s management – is weaker. Since Nick and Chris took over the management, FEML ranks fifth out of nine funds.
Figure 16: Peer group comparison – size, fees, discount, and yield as at 26 November 2025
| Market cap (£m) | St. dev. of NAV returns over one year | Ongoing charges (%) | Perf. fee | Premium/ (discount) (%) | Dividend yield(%) | Gross gearing(%)3 | Net gearing(%)3 | |
|---|---|---|---|---|---|---|---|---|
| FEML | 450 | 13.9 | 0.83 | No | (9.8) | 2.0 | 70.9 | 61.3 |
| Ashoka WhiteOak EM | 56 | 14.1 | 1.90 | Yes1 | (0.9) | – | Nil | (7.5) |
| Barings Emerging EMEA | 89 | 23.4 | 1.70 | No | (14.6) | 2.2 | Nil | (1.8) |
| BlackRock Frontiers | 330 | 10.6 | 1.41 | Yes | (4.3) | 4.3 | 23.9 | 11.9 |
| JPMorgan Emerging EMEA | 115 | 52.5 | 4.17 | No | 344.6 | 0.2 | Nil | (2.7) |
| JPMorgan Emerging Mrkts | 1,303 | 14.6 | 0.79 | No | (8.5) | 3.8 | Nil | (2.7) |
| JPMorgan Global EM Inc | 431 | 10.8 | 0.96 | No | (9.5) | 3.5 | Nil | (0.2) |
| Mobius | 160 | 14.1 | 1.4 | No | (10.1) | 1.2 | Nil | (6.4) |
| Templeton Emerging Mrkts | 2,221 | 16.2 | 0.95 | No | (8.6) | 2.3 | 3.0 | (0.2) |
| Utilico Emerging Markets | 475 | 11.2 | 1.5 | No | (11.1) | 3.4 | 3.1 | 3.0 |
| FEML rank2 | 4/10 | 4/10 | 2/10 | 7/10 | 7/10 | 10/10 | 10/10 | |
| Sector arithmetic avg.4 | 563 | 18.1 | 1.56 | (8.6) | 2.5 | 10.1 | 5.5 | |
| Sector arithmetic avg.4 exc. FEML | 576 | 18.6 | 1.64 | (8.5) | 2.6 | 3.3 | (0.7) |
FEML is one of the larger emerging market trusts by market cap, although it remains smaller than JP Morgan Emerging Markets and Templeton Emerging Markets.
FEML’s ongoing charges figure is lower than or comparable to those of other funds in the sector. Like most of the funds in this peer group, it does not charge a performance fee.
In a sector where income payments are typically low, FEML’s yield is around the sector average. The same is true for the discount, with most of the sector trading on discounts in the high single- or low double-digits.
Both FEML’s gross and net gearing levels are higher than those of the rest of the sector; most of its peers have net cash positions. These gearing levels appear to be primarily due to the fund’s extension on the long and short side.
FEML’s volatility, as measured by the standard deviation of NAV returns, is in the middle of the peer group.
Dividend
FEML is primarily focused on generating capital growth. Any income generated is a secondary consideration and shareholders are not expected to receive income as a significant component of their returns. Income may occur, and after allowing for costs that are charged to the revenue account, board policy is to pay out the majority of revenue earnings as a final dividend. This is usually paid in December of each year.
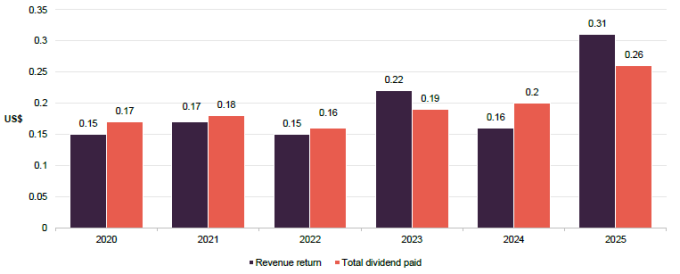
For the year ended 30 June 2025, FEML’s board has approved the payment of a final dividend of US$0.26 per share (2024: US$0.20 per share), which is equivalent to a yield of 1.6% on the trust’s share price of 1,198p per share as at 30 January 2026.
Figure 17: FEML revenue income and dividend by financial year (ended 30 June)
Source: Fidelity Emerging Markets Limited
The dividend paid in 2025, which was 30% higher than the previous year, was fully covered by revenue. As shown in Figure 17, dividends in previous recent years had exceeded revenue income, but the longer-term trend appears to have been one of paying a covered dividend. This has enabled FEML to build up a revenue reserve. As at 30 June 2025, this reserve was US$59.1m or US$0.9185 per share (30 June 2024: US$51.3m or US$0.6877 per share).
Premium/(discount)
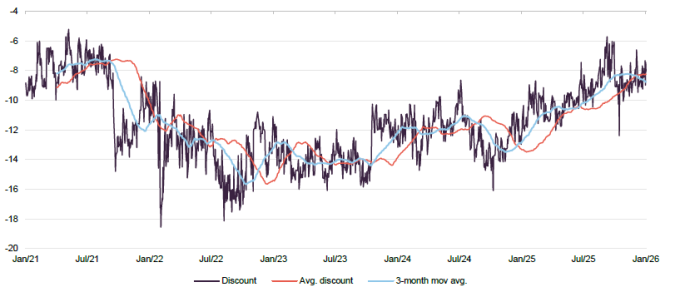
As shown in Figure 18, FEML moved to a wider discount from late 2021, as emerging-market equities appeared to fall out of favour at the same time as global interest rate expectations rose, and the fund experienced a manager change alongside an over-subscribed tender offer. The discount then narrowed, but it subsequently widened further in the period following Russia’s invasion of Ukraine. More recently, there has been a narrowing of the discount, particularly over the course of 2025, such that it has generally been less than 10% in recent months. The average over the past 12 months has been 9.5%, within a range of 5.7% to 12.4%. With the trust trading on a discount of 8.1% as at 30 January, it is at the narrower end of that recent range.
Figure 18: FEML premium/(discount) over five years to 30 January 2026
Source: Bloomberg, Marten & Co
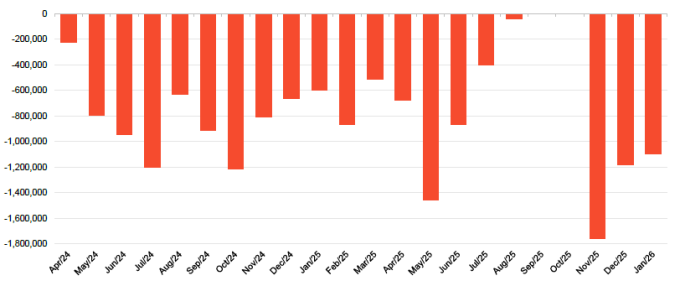
The company has stated an aim of keeping the trust’s discount to single digits, and to this end has been active in buying back shares. FEML’s most recent tender offer was in March 2024, and the monthly share repurchases since then are shown in Figure 19. These have totalled 22.0% of the total share capital over this period, and the board has indicated an intention to continue with this buyback strategy in future.
Figure 19: FEML share buybacks and issuance
Source: Fidelity Emerging Markets Limited
Strathclyde Pension Fund sale
Following an EGM held on 24 October, the board of FEML announced that shareholders had given their approval for the company to repurchase 16,441,177 shares, or 25% of the fund, from Strathclyde Pension Fund, the second-largest shareholder. The process was completed on 13 November 2025 at a discount of 14% to NAV, against a prevailing market discount of 9.8% on that day.
Strathclyde’s holding was a legacy of FEML’s previous management by Genesis. The sale resulted in an approximate 4.5% uplift to NAV for remaining shareholders.
Capital structure
FEML is a Guernsey-incorporated closed-end investment company. It has two share classes – “founder shares” and “participating preference shares” – and the participating preference shares have a premium listing on the London Stock Exchange. The founder shares were created at FEML’s launch in 1989 to ensure compliance with Guernsey company law at the time. Unlike the participating preference shares, the founder shares carry no economic rights and do not participate in the company’s profits, assets, or dividends. The founder shares were transferred to FIL Investment Services (UK) Limited on 7 October 2021 and their only function is to give the holder limited voting rights on matters that would affect the existence of the class itself. They do not dilute or affect the rights of participating preference shareholders.
Gearing
FEML is permitted to borrow, although net gearing is capped at 10% of net assets and the company states that it aims to keep the use of its overdraft facility for trading purposes to a minimum.
As at 31 December 2025, FEML had net gearing of 6.9% of net assets. Gross gearing was 57.1%, which reflects the short equity positions alongside the long book.
Major shareholders
FEML has a significant institutional presence on its share register.
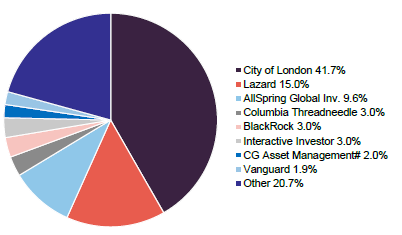
Figure 20 illustrates that FEML has a significant institutional element within its share register.
Figure 20: Major shareholders as at 31 December 2025
Source: Bloomberg, Marten & Co.
Unlimited life with a five-yearly continuation vote
FEML has no fixed life. As part of the change of management arrangements in 2021, the company committed to providing shareholders with a continuation vote in 2026 and every five years thereafter. This is scheduled to take place at the AGM in December.
There is due to be a conditional tender offer in September 2026. This will allow for a tender of up to 25% of shares if the fund has underperformed over the preceding five years. The calculation date is at end September. If the NAV total return for the five years ending 30 September 2026 does not exceed the benchmark index, the company will make a tender offer for up to 25% of the shares in issue (excluding shares held in treasury) at that time. As at end December 2025, the fund was more than 8% ahead of the benchmark over the tender period to date in GBP terms.
Financial calendar
FEML’s financial year-end is 30 June. The annual results are usually released in October (interims in March) and its AGMs are usually held in December of each year, with this year’s scheduled for 1 December. As previously noted, FEML pays one final dividend a year in December after its approval at the AGM.
Fees and costs
Under the management agreement, the investment manager is entitled to receive a management fee of 0.6% of net asset value. The management fee is calculated and charged daily and payable monthly in arrears.
Management team
Nick Price (portfolio manager)
Nick set up Fidelity’s Emerging EMEA group in 2005.
Nick Price established Fidelity’s Emerging EMEA group in 2005 and developed the investment process that has since been used in Fidelity’s emerging markets equity strategies. This process was implemented globally in 2009. In 2011, Nick launched the FAST (Fidelity Active STrategy)-Emerging Markets strategy, which he continues to lead. This strategy is structured to mirror FEML and provides a longer-term track record.
Nick joined Fidelity in 1998 as a research analyst covering pan-European sectors before becoming assistant portfolio manager of the European Growth Fund in 2004. Earlier in his career he worked in London with SBC Warburg, Daiwa Europe Bank and JP Morgan, having started as an auditor with Price Waterhouse in Johannesburg. He holds a Bachelor of Commerce and Diploma in Accounting from the University of Natal, is a member of the South African Institute of Chartered Accountants, and is a CFA charterholder.
Chris Tennant (co-portfolio manager)
Chris has spent his entire career at Fidelity, joining in 2011 as an equity analyst covering European transportation. He moved to the London-based emerging markets team in 2012 to focus on EMEA and Latin American metals and mining. In 2015, he took on a newly created role as EM shorting analyst, working with Nick to develop the short book, which was initially concentrated on EMEA and Latin America.
Chris was appointed assistant portfolio manager on the FAST-Emerging Markets strategy in 2019 and became co-portfolio manager in 2021. He serves on the Emerging EMEA and Latin America equities portfolio management teams. Chris holds a Master’s degree in engineering from Imperial College.
Board
FEML’s board currently comprises five directors, all of whom are non-executive and considered to be independent of the investment manager. FEML’s articles of association require that newly appointed directors offer themselves for election at the next AGM. It is board policy that all directors retire and offer themselves for re-election at each AGM.
Figure 21: Board member length of service and shareholdings
| Director | Position | Date of appointment | Length of service (years) | Annual fee (GBP) 1 | Shareholding2 | Years of fee invested3 |
|---|---|---|---|---|---|---|
| Heather Manners | Chairman | 5 May 2022 | 3.6 | 52,000 | 10,000 | 1.9 |
| Mark Little | Chair of the audit committee | 17 January 2024 | 1.9 | 39,500 | 3,869 | 1.0 |
| Torsten Koster | Senior independent director | 1 July 2020 | 5.4 | 39,500 | 15,000 | 3.8 |
| Dr Simon Colson | Director | 1 July 2019 | 6.4 | 37,500 | 4,416 | 1.2 |
| Katherine Tsang | Director | 19 July 2017 | 8.4 | 37,500 | 8,000 | 2.1 |
| Average (service length, annual fee, shareholding, years of fee invested) | n/a | n/a | 5.1 | 41,200 | 8,257 | 2.0 |
The average length of service is 5.1 years, with Katherine Tsang, the longest serving, having 8.4 years of service. Other than FEML’s board, its directors do not have any other shared directorships. The company’s articles of association limit the aggregate fees payable to the directors to a total of US$400,000 per annum. The average fee rates for the individual director positions for the current financial year have increased by 3.9% over FY24.
Recent share purchase and disposal activity by directors
All of FEML’s directors have personal investments in the fund.
Since the middle of 2024, there have been three purchases by FEML directors of the company’s shares – all of which were by directors who did not previously have a stake. Mark Little purchased 2,850 shares at £7.01 per share on 14 October 2024 and 1,019 shares at £9.82 on 8 October. Katherine Tsang purchased 8,000 shares at £6.80 per share on 6 November 2024. There have been no sales of shares by directors in the same period. As illustrated in Figure 21, all of FEML’s directors now have personal investments in the fund. The average interest is equivalent to 1.9 years of their fees.
Heather Manners (chairman)
Heather joined FEML’s board in May 2022 and became chairman in December 2022. She has 34 years’ experience of investment in Asia, and for the past 15 years has been the co-founder, CEO and CIO of Prusik Investment Management. Heather began her career at Henderson Global Investors Limited where she was head of Asia and emerging markets. Heather is also a non-executive director of Montanaro Asset Management and Collidr Asset Management. She was previously a non-executive director of Aberdeen New Dawn Investment Trust Plc.
Mark Little (chairman of the audit committee)
Mark is a chartered accountant with experience in financial services, including fund management, research and private banking. Mark began his career as a fund manager with Scottish Widows Investment Management after qualifying as a chartered accountant with Price Waterhouse in 1991. He subsequently worked as global head of automotive research for Deutsche Bank and joined Barclays Wealth in 2005, where he became Managing Director of Barclays Wealth (Scotland and Northern Ireland).
Mark is a non-executive director and chairman of the audit committees of BlackRock Smaller Companies Trust Plc, Majedie Investments Plc and Abrdn Equity Income Trust Plc. Previously, he has been a non-executive director and chair of the audit and risk committee of STS Global Income & Growth Trust Plc, managing director, Scotland & Northern Ireland at Barclays Wealth (formerly Gerrard) and global head of automotive research at Deutsche Bank. Mark is an Accountancy and Economics graduate from Aberdeen University.
Torsten Koster (senior independent director)
Torsten has over 30 years’ experience working for large multi-national companies. He spent two periods at Nestle SA – between 1991 and 1997 and then from 2003 to 2016 – and, during his second term, held the positions of chief financial officer Nestle Russia & Eurasia between 2007-2011 and chief financial officer Nestle Nespresso SA from 2011 to 2016.
Torsten was chief financial officer at Lukoil SA between 1998 and 2000 and subsequently at ELCA Informatique SA between 2000-2003. In 2016, he founded his own consultancy business, Baussan Concept SA, which provided due diligence and portfolio services to European and US based private equity firms.
Torsten has held a number of Board positions, including being a director of SodaStream International from 2016-2018 and vice chairman of Natra SA, Spain from 2019-2022. He is currently chairman of the Board of Banque Heritage SA and director of ECOM Agroindustrial SA, both of which are unlisted companies. Torsten holds a Master’s degree from HEC Lausanne and is a resident of Switzerland.
Dr Simon Colson (director)
Based in the UK, Simon has over 30 years’ experience in financial markets, working in investment banking, investment management and financial consulting. From 1995-2001, he was managing director at Deutsche Bank AG London, with responsibility for closed-end fund origination and distribution. In previous roles, Simon was responsible for the launch, restructuring and repurposing of a number of investment companies and, from 2002-2005, was a non-executive director of The Association of Investment Companies.
In 2002, Simon started an FCA regulated consulting and distribution business which raised assets for emerging managers across a range of traditional and alternative asset classes, including closed-end funds. Since 2017, he has focused on unregulated advisory and non-executive work and is currently a non-executive director of the Children’s Liver Disease Foundation. Simon is a qualified medical doctor and holds an MBA in Finance & Investment from Bayes Business School (City St George’s, University of London).
Katherine Tsang (director)
Prior to her retirement in 2014, Katherine spent 22 years with Standard Chartered Bank, most recently in the role of Chairperson of Greater China. Following her retirement, Katherine founded Max Giant, which operates in different markets and makes direct investments in Asia.
Katherine is based in Hong Kong and is currently an independent non-executive director on the Board of China CITIC Bank International Limited and Budweiser Brewing Company APAC Limited. She also serves as a member of the Advisory Council for China of the City of London, and is an honorary Board member of Shanghai Jiao Tong University. Katherine has previously served as an independent non-executive director of Gap Inc., and Baoshan Iron & Steel Co. Limited, a member of the World Economic Forum’s Global Agenda Council on China, and a member of Sotheby’s Advisory Board.
IMPORTANT INFORMATION
Marten & Co (which is authorised and regulated by the Financial Conduct Authority) was paid to produce this note on Fidelity Emerging Markets Limited.
This note is for information purposes only and is not intended to encourage the reader to deal in the security or securities mentioned within it. Marten & Co is not authorised to give advice to retail clients. The research does not have regard to the specific investment objectives financial situation and needs of any specific person who may receive it.
The analysts who prepared this note are not constrained from dealing ahead of it but, in practice, and in accordance with our internal code of good conduct, will refrain from doing so for the period from which they first obtained the information necessary to prepare the note until one month after the note’s publication. Nevertheless, they may have an interest in any of the securities mentioned within this note.
This note has been compiled from publicly available information. This note is not directed at any person in any jurisdiction where (by reason of that person’s nationality, residence or otherwise) the publication or availability of this note is prohibited.
Accuracy of Content: Whilst Marten & Co uses reasonable efforts to obtain information from sources which we believe to be reliable and to ensure that the information in this note is up to date and accurate, we make no representation or warranty that the information contained in this note is accurate, reliable or complete. The information contained in this note is provided by Marten & Co for personal use and information purposes generally. You are solely liable for any use you may make of this information. The information is inherently subject to change without notice and may become outdated. You, therefore, should verify any information obtained from this note before you use it.
No Advice: Nothing contained in this note constitutes or should be construed to constitute investment, legal, tax or other advice.
No Representation or Warranty: No representation, warranty or guarantee of any kind, express or implied is given by Marten & Co in respect of any information contained on this note.
Exclusion of Liability: To the fullest extent allowed by law, Marten & Co shall not be liable for any direct or indirect losses, damages, costs or expenses incurred or suffered by you arising out or in connection with the access to, use of or reliance on any information contained on this note. In no circumstance shall Marten & Co and its employees have any liability for consequential or special damages.
Governing Law and Jurisdiction: These terms and conditions and all matters connected with them, are governed by the laws of England and Wales and shall be subject to the exclusive jurisdiction of the English courts. If you access this note from outside the UK, you are responsible for ensuring compliance with any local laws relating to access.
No information contained in this note shall form the basis of, or be relied upon in connection with, any offer or commitment whatsoever in any jurisdiction.
Investment Performance Information: Please remember that past performance is not necessarily a guide to the future and that the value of shares and the income from them can go down as well as up. Exchange rates may also cause the value of underlying overseas investments to go down as well as up. Marten & Co may write on companies that use gearing in a number of forms that can increase volatility and, in some cases, to a complete loss of an investment.