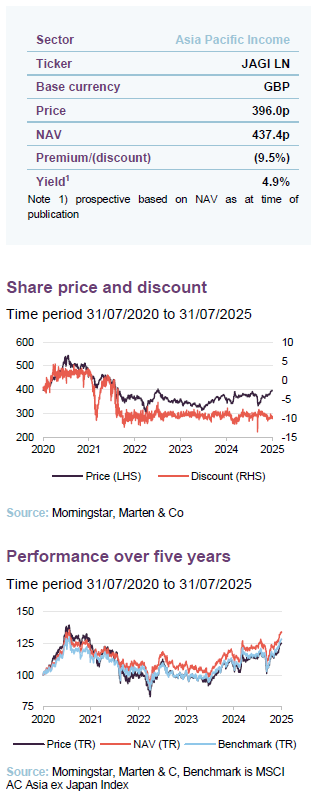
Asian income without compromising on growth
JPMorgan Asia Growth and Income (JAGI) has a solid long-term track record of outperformance of its benchmark, helped by its focus on maximising long-term total returns. In February 2025, the trust introduced an even greater enhanced dividend policy, that delivers an attractive level of income without compromising on the manager’s ability to pick the best stocks for the portfolio.
Considerable effort is being made to moderate discount volatility with the use of share buybacks, and that appears to be working well. We see scope for increased demand for the trust and potentially a narrowing of the discount as investors come to appreciate the new dividend. The region could also benefit as investors consider reallocating funds from the US to other, faster growing regions.
High income from Asian equities
JAGI invests in a diversified portfolio of equities quoted on the stock markets of Asia, excluding Japan, with the aim of maximising total returns for shareholders. An enhanced dividend policy targets regular quarterly dividends of 1.5% of quarter-end NAV (approximately 6% per annum).
| Year ended | Share price total return (%) | NAV total return (%) | MSCI AC Asia ex Japan TR (%) |
|---|---|---|---|
| 31/07/2021 | 21.6 | 17.3 | 13.1 |
| 31/07/2022 | (17.9) | (9.0) | (9.1) |
| 31/07/2023 | 3.3 | 3.5 | 0.4 |
| 31/07/2024 | 5.7 | 4.3 | 6.4 |
| 31/07/2025 | 14.8 | 15.9 | 16.4 |
| Domicile | England & Wales |
|---|---|
| Inception date | 12 September 1997 |
| Managers | Robert Lloyd Pauline Ng |
| Market cap | 303.4m |
| Shares outstanding (exc. treasury shares) | 69,207,849 |
| Daily vol. (1-yr. avg.) | 208,538 shares |
| Net gearing | 5.5% |
Fund profile
More information is available at the company’s website: www.jpmorganasiagrowthandincome.co.uk
JAGI was launched in September 1997 as JPMorgan Asian Investment Trust, a rollover vehicle for shareholders in The Fleming Far Eastern Investment Trust Plc. JAGI adopted its present name in February 2020.
JAGI’s co-portfolio managers are Robert Lloyd, who is based in Hong Kong, and Pauline Ng, who is based in Singapore (see page 22). The two managers have almost 50 years of combined industry experience. They can tap into the expertise of over 30 career analysts working on emerging markets and Asia (EMAP), as well as country specialists, global and regional portfolio managers located in nine locations around the world.
With the aim of maximising JAGI’s total returns, the trust has adopted an active, conviction-led approach to investing. The trust’s enhanced dividend policy – discussed on page 19 – enables investors to receive an attractive level of income without compromising the managers’ focus on maximising total returns.
Why JAGI?
Core Asian exposure with an attractive dividend yield
We believe that JAGI could be viewed as a ‘core’ Asian equity holding that comes with the added bonus of an attractive dividend yield. The total return focus allows the portfolio to have a greater exposure to fast growing companies than might be the case for a conventional high-income strategy.
Looking at all trusts in the AIC Asia Pacific equity sectors and IA Asia Pacific ex Japan sectors, JAGI’s newly enhanced yield places it within the top decile of income funds ranked by yield. On Morningstar’s proprietary style classification, it is the only high yielding fund to offer exposure to a quality growth portfolio.
Market update
Tariffs and trade
“Liberation Day” tariffs caused serious upset in markets and, after a hiatus, have now been reinstated
Trump’s tariffs have generated a lot of headlines with regards to Asian markets. Initially, the president promised to impose significant levies on imports from several Asian countries based entirely on their trade surplus in goods with the US. “Liberation Day” triggered a savage selloff in equity markets. However, Trump’s backtracking since and signs that some trade agreements are being reached have encouraged a recovery in markets in recent months.
On May 12, China agreed to reduce levies on US imports to 10% in return for US reducing its tariff rate on Chinese imports to 30%. That was a temporary deal supposed to last for 90 days (i.e. around 10 August). Japan agreed to 15% tariffs on its exports to the US, Indonesia and the Philippines settled on 19%, and Vietnam agreed to a 20% rate.
For those countries that have not yet reached an agreement, the deadline to reinstate the original 90-day pause on tariffs was 9 July, now extended to 1 August.
While there are outliers, much of Asia’s economy is not reliant on US exports
In the short-term, a surge in exports to the US and a stockpiling and then unwinding of inventory is likely to distort trade balances and GDP growth figures over coming months. Nevertheless, as Figure 1 suggests, despite exports’ sizeable contribution to GDP, many Asian economies earn only a small (sub-10%) share of it from trade with the US. India is a notable example of this. Its fast-growing economy is very much domestically focused.
Rising domestic consumption could help offset the slack from falling US demand. In China, the economy has been held back by the bursting of a property bubble, which has dented consumer confidence. However, the managers observe that the government is trying to tackle the overhang of excess supply of properties and may aim to accelerate that process.
Companies may also be better prepared this time around, and already aware of the need to diversify supply chains after Trump’s previous tenure.
Figure 1: Exports as a percentage of nominal GDP

Source: JPMorgan, data as of 2023
Figure 2: Performance of USD against Asian currencies over 2025

Source: Bloomberg
Currencies
A weaker dollar is usually seen as a good sign for Asian markets
The US dollar has been weakening against most currencies (this is one of Trump’s aims). That makes imports more expensive, which piles more pressure on top of the tariff impact. However, it also has the advantage of reducing inflationary pressures in Asia. As a result, it opens the door to more supportive monetary and fiscal policy across Asia, further fuelling domestic consumption growth. China, for instance, recently cut its interest rates and lowered banks’ reserve requirements.
Technology
US policies are spurring technological progress in Asia
Another concern of the Trump regime has been preserving the US technological lead over rivals. To that end, he has sought to restrict exports of cutting-edge chips, for example. However, in many areas Asian firms are catching up or even perhaps surpassing US rivals.
Asia is home to global tech giants like Taiwan Semiconductor and Samsung. China has rapidly become a major player in AI, with companies such as DeepSeek surprising markets earlier this year. China is also fast becoming the leading player in the electric vehicle market, and its relentless pursuit of clean energy means that it dominates in areas such as the production of solar panels.
Valuations
Figure 3: Asia P/E versus global markets

Source: Bloomberg. Data s of 31/05/205
Figure 4: Asia EPS versus global markets

Source: Bloomberg. Data s of 31/05/205
Asian equities are reasonably valued
However, despite boasting faster earnings growth than western peers, Asian equities tend to trade on cheaper valuations, as shown in Figure 3. With investors beginning to question the attraction of US equities, there must be an increasing chance of a reallocation of capital to the region.
The managers observe that Chinese companies are exhibiting a greater focus on shareholder returns. The emphasis is shifting from share issuance to buybacks and dividends are climbing.
Valuations of Indian companies are higher than those of most other Asian markets. However, the managers feel that the structural long term growth outlook remains attractive. It may also be that Japan, which does not form part of JAGI’s remit but nevertheless is a key market in Asia, becomes more of an engine for growth in the region as governance reforms help make its companies more dynamic.
Investment approach
The managers observe that Asia-Pacific is a diverse region of many markets seeing rapid change. They believe that finding the best income and growth opportunities demands exceptional resources and insight – on the ground and around the world.
J.P. Morgan Asset Management (JPMAM) describes itself as a leading specialist in Asia-Pacific equities. The co-managers of JPMorgan Asia Growth & Income are based in Hong Kong and Singapore. They are supported by approximately 80 members of the wider (EMAP) team, comprising global and regional portfolio managers, country specialists and analysts located in nine locations around the world.
Bottom-up, stock picking approach
From a pool of about 800 stocks under coverage, the aim is to build a portfolio of around 50–80 investments. The portfolio is built ‘bottom up’, with the managers picking stocks rather than allocating between countries and sectors. The investment process is designed to focus on the long-term prospects of each investment, rather than being distracted by short-term noise.
Restrictions on portfolio weights
Returns are benchmarked against the MSCI All Countries Asia ex Japan Index. Relative to an open-ended fund with a similar remit, JAGI’s closed-end structure is suited to holding more illiquid positions. Following a review of the approach in 2024, the board encouraged the manager to increase the active share of the portfolio, invest in off-benchmark positions, and mid- and small-cap opportunities.
The managers are permitted to have a maximum active under- or overweight exposure to each country in the benchmark of 15%. The company will not invest materially more than 10% of the portfolio into a single stock or materially exceed a 3% under- or overweight exposure to a single stock.
At the end of June 2025, the largest stock in the benchmark was Taiwan Semiconductor Manufacturing (TSMC), with a weight of 11.6%. The next-largest was Tencent at 5.3%.
On that date, China represented 32% of the benchmark, India 21%, Taiwan 21%, South Korea 12%, and Hong Kong just under 5%. We show JAGI’s largest under- and overweight exposures relative to the benchmark on page 11.
Gearing is used within a range of 10% net cash to 20% geared (in normal market conditions).
Stock analysis
The analyst team seeks to assign each stock under research coverage a strategic classification based on an assessment of
- Business economics (answering the question: does the business create value for shareholders?). The analysis aims to consider all of the factors that influence the amount of capital needed to run a business, the profits it makes by employing this capital, and the amount of capital that can be re-invested. These factors can be external to the company (macro and industry), or specific to it (company and management).
- Duration (the extent to which these returns can be sustained). JPMAM believes that a company’s ability to sustain returns depends on a wide variety of factors: to have confidence in a company’s duration, it needs to consider the potential impact on the business of several risk factors, including macro, industry and company factors, as well as management choices.
- Governance. How will governance impact shareholder value? JPMAM examines this in two ways:
- by source (macro/industry/company/management) and
- by cause (competence and motives).
Following this analysis, the analyst assigns one of four strategic classifications to a company.
- Premium: Companies that have a sustainable advantage that allows for durable growth and sustained excess financial returns. These are best-in-class companies on an absolute basis.
- Quality: Companies where JPMAM assesses that intrinsic value can be created at a rate above a suitable cost of capital with acceptable risks, and that is unlikely to change within the forecast horizon.
- Standard: Companies that are not challenged, but where JPMAM’s confidence in their long-term value creation is lower than for quality or premium companies.
- Challenged: Companies where the economics are below the cost of capital and unlikely to recover on a sustainable basis, or where there are significant concerns around duration and/or governance.
Proprietary quality and risk assessment
The second part of the process is for analysts to complete a standardised 98-question risk profile assessment for each stock. Any question to which the answer is ‘yes’ is counted as a red flag. Stocks with the most red flags are typically the most challenged. The managers say that this provides a ‘sanity check’ for their investment decisions and encourages risk awareness.
An assessment of aspects of ESG is integral to the investment approach. The managers stress the importance of understanding the potential for ESG factors to present potential challenges or opportunities that could significantly affect a company’s share price. Roughly two-thirds of the risk profile questions are governance-related – does the company issue excessive amounts of stock, for example.
Analysts calculate a financial materiality score for each stock. This focuses on industry-specific ESG issues (based on a classification of the universe that breaks it down into around 50 sub-sectors).
At the end of the process, there should be a 20–30 page document on each stock.
As examples, steel companies – operating in cyclical markets, faced with ESG issues, and often struggling to cover their cost of capital, tend to score lowly and have a lot of red flags. Pinduoduo, owner of Temu, does not score well, for example.
By contrast, TSMC with its high returns on capital, free cash flow, and unparalleled R&D budget, is rated as a premium stock. Tencent’s strong balance sheet (net cash) tips it towards the quality end of the spectrum.
The ratings tend to inform position sizes. However, the managers are free to back their conviction in a stock if they choose. They say that the best investments are not always the highest quality stocks. Sometimes, identifying a company that is likely to be upgraded from Standard to Quality or Quality to Premium can provide an exciting investment opportunity.
Valuations based on normalised earnings potential
The last, but by no means the least part of the investment approach is a determination of the valuation upside of a stock. Valuations are based on the analysts’ views on the normalised earnings potential of a company, factoring the trend of earnings growth, and an assessment of what market would pay for such a company. This calculation gives the expected upside/downside in each stock.
The managers use the example of Telstra – leading mobile provider in Australia and a top 10 position in the portfolio. They believe that it offers a potential 10% return per annum for five years, factoring in its dividend yield and earnings growth forecasts.
The expected returns analysis provides a basis for comparing stocks on a like-for-like basis across different countries.
The managers apply a sense check over the shape of the portfolio to ensure that relative to the benchmark its holdings are not too exposed to individual factor bets.
Asset allocation
Figure 5: JAGI asset allocation by country as at 30 June 2025

Source: JPMorgan Asset Management
Figure 6: JAGI asset allocation by sector as at 30 June 2025

Source: JPMorgan Asset Management
Figure 7: JAGI asset allocation by country relative to benchmark at 30 June 2025

Source: JPMorgan Asset Management
Figure 8: JAGI asset allocation by sector relative to benchmark as at 30 June 2025

Source: JPMorgan Asset Management
As Figures 7 and 8 show, JAGI’s country and sector asset allocation is not materially different from that of the benchmark.
Figure 9: JAGI portfolio characteristics as at 30 June 2025
| JAGI | Benchmark | |
|---|---|---|
| 12-month forward price/earnings | 13.7x | 13.6x |
| Price/book | 2.0x | 1.9x |
| Dividend yield | 2.2% | 2.2% |
| Return on equity | 12.1% | 11.8% |
| Net debt to equity | 31.9% | 17.7% |
| Five-year forecast earnings growth | 10.9% | 10.5% |
| Average number of ‘red flags’ | 13.5 | 14.7 |
| MSCI carbon intensity | 134.7 | 265.9 |
| Number of issuers | 71 | 956 |
| Active share | 64.9% |
The data shows that, on average, the stocks in JAGI’s portfolio are more expensive than those in the benchmark. That reflects their higher return on equity and earnings growth.
Based on JPMAM’s analysis, the portfolio has a lower number of red flags than the benchmark. It also has a lower carbon intensity, which likely is a consequence of the bias away from cyclical heavy industrial businesses.
JAGI’s active share could be higher
At 64.9%, JAGI’s active share is marginally higher than its level of 62.0% at end September 2024 (when the board was asking for it to be increased) but lower than it was at end September 2023 (68.7%). There is work to be done here (the goal is to get it to 70% over time), but we acknowledge that the concentration of stocks in the benchmark and the in-built constraints around deviating too far from the index have an impact here.
At 30 June 2025, 60.0% of JAGI’s portfolio was classified as ‘premium’ or ‘quality’ versus 40.7% for the benchmark. In addition, relative to the benchmark, the portfolio had an overweight exposure to very large ($30bn+ market cap) companies and small (sub $5bn) companies.
Given that the board has raised the issue of the portfolio’s active positioning relative to the benchmark, in the next section we have included the top 10 holdings as usual. TSMC, Alibaba, Tencent, Samsung Electronics, and HDFC Bank are the five-largest constituents of the benchmark and constitute five of JAGI’s six-largest positions.
We felt it would be more informative to discuss JAGI’s largest over- and underweight positions relative to the benchmark index.
Top 10 holdings and largest over- and underweights
Figure 10: 10 largest holdings as at 30 June 2025
| Country | Sector | % at 30/06/25 | % at 30/09/24 | Change (%) | |
|---|---|---|---|---|---|
| TSMC | Taiwan | Information technology | 14.6 | 11.1 | 3.5 |
| Tencent | China | Communication services | 6.7 | 7.6 | 1.1 |
| Alibaba | China | Consumer discretionary | 5.8 | 4.4 | 1.4 |
| HDFC Bank | India | Financials | 3.8 | 2.5 | 1.3 |
| Hong Kong Exchanges & Clearing | China | Financials | 3.6 | 2.7 | 0.9 |
| NetEase | China | Communication services | 2.7 | 0.9 | 1.8 |
| Shinhan Bank | South Korea | Financials | 2.6 | 1.2 | 1.4 |
| SK Hynix | South Korea | Information technology | 2.2 | 2.9 | (0.7) |
| DBS | Singapore | Financials | 2.1 | 1.5 | 0.6 |
| Telstra | Australia | Communication services | 2.0 | 1.4 | 0.6 |
| Total | 46.1 |
Figure 11: Largest overweight positions as at 30 June 2025
| JAGI weight (%) | Overweight (%) | |
|---|---|---|
| TSMC | 14.51 | 2.94 |
| Hong Kong Exchanges and Clearing | 3.55 | 2.72 |
| Alibaba | 5.79 | 2.67 |
| Shinhan Financial Group | 2.61 | 2.35 |
| HDFC Bank | 3.81 | 2.10 |
Figure 12: HKEX (HKD)

Source: Bloomberg
Hong Kong Exchanges and Clearing
Hong Kong Exchanges and Clearing (HKEX) (hkexgroup.com) is a global exchange provider, operating multiple different markets across equities, commodities, fixed income, derivatives, and currencies though is subsidiaries: The Stock Exchange of Hong Kong Limited (SEHK), Hong Kong Futures Exchange Limited and London Metal Exchange. Its pedigree is squarely rooted in Hong Kong, with the Hong Kong government being its largest shareholder.
While the JAGI team acknowledges the ongoing debate around the quality of the Chinese equity market, there remain structural trends that are driving increased trading volumes – which directly translates in greater earnings potential for their exchanges.
Alibaba (which secured a primary listing in Hong Kong in August 2024) and Tencent (the second largest listing on the SEHK) have been buying back their stock rather than buying businesses, this is helping to boost trading volumes.
There has been an increase in high profile listings (17 IPOs in Q1 2025, and 120 on the books as at end March 2025). MSost recently, May 2025 saw the IPO of CATL (Contemporary Amperex Technology), which raised $5.3bn (the largest IPO globally in 2025 to date).
The burgeoning Chinese EV sector is raising more equity; Xiaomi, which the managers think is already well capitalised, has been issuing stock in Hong Kong.
More Chinese companies are choosing to forgo a New York listing and instead are choosing Hong Kong.
Volumes on the China (Shanghai and Shenzen) Connect have been climbing, with Goldman Sachs predicting $110bn of southbound investor flows.
The impact of these factors can already be seen in HKEX’s recent Q1 2025 results. The first three months of 2025 saw HKEX report record trading volumes, quarterly revenues, and profits. Revenues from its core businesses came in at HK$6.6bn, up 32% YoY, with profits of HK$4.1bn, up 37% YoY.
Figure 13: Alibaba (HKD)

Source: Bloomberg
Alibaba
Alibaba (alibaba.com) is one of China’s technology giants. While best known for its e-commerce services (principally Taobao, Tmall, AliExpress), it also offers digital media and entertainment (Youku and Damai), logistics, and cloud-computing services.
Market sentiment around Alibaba has become increasingly positive over 2025 – driven by a combination of improved shareholder alignment, solid results from its core businesses, and the tailwinds from its cloud and AI solutions. Alibaba currently has a share buyback scheme in place (running until March 2027); it repurchased $11.9bn worth of shares (5.1% of shares outstanding) over its financial year ended 31 March 2025.
For FY25, Alibaba delivered revenue growth of 6% and 5% earnings per share growth.
AI is an important focus for the company and on this front, Alibaba released its proprietary LLM Qwen2.5-Max in January this year. This is integrated into Alibaba’s Quark AI assistant. Alibaba plans to invest at least RMB380bn (£39bn) on AI and cloud computing over the next three years. While investors will look for a clear monetisation strategy for this investment, it is already having a positive impact on Alibaba’s revenues, as its Quanzhantui digital marketing tools make heavy use of AI. Management believes that the revenue growth of its cloud intelligence group (up 69% for FY25) will only accelerate thanks to the growth of AI.
Figure 14: Shinhan Financial Group (KRW)

Source: Bloomberg
Shinhan Financial Group
Shinhan Financial Group (shinhangroup.com) is a South Korean holding company whose subsidiaries provide a range of financial services including commercial banking, insurance, asset management, and investment banking.
Shinhan’s shares have rallied since April 2025 – thanks in part to the wider rally of South Korean equities following the election of Korea’s new business-friendly president. Shinhan has also posted positive results over the first two quarters of 2025. For the first quarter, Shinhan’s profits were up 13% YoY (in line with market expectations), thanks to resilient fee income and stable interest income. However, its Q2 results came in ahead of expectations, with reported record profits of $2.5bn – thanks to a resilient interest income margin and a further growth in its non-interest incomes (e.g. income generated by fees and non-banking services). Shinhan also surprised shareholders by announcing a larger than expected share buyback of KRW800bn to be completed by Q1 2026.
TSMC
Figure 15: TSMC (TWD)

Source: Bloomberg
TSMC (tsmc.com) is the world’s largest contract chip manufacturer, and by far the largest component of JAGI’s benchmark. TSMC is a critical component of the global technology sector, as it is responsible for 67% of the world’s semiconductor foundry output – raising to c.90% in the manufacturing of advanced chips. Notably, it has experienced strong growth in demand for NVIDIA chips.
TSMC has been a major beneficiary of the growth of AI as the significant processing power needed directly contributes to increased demand for semiconductors. This is evident in its recent results. YoY revenue growth for Q1 2025 was 42%, EPS growth was running at 60%.
TSMC maintains its dominant position with the aid of a vast R&D budget. In March 2025, it said it was planning to invest $165bn in the US to help meet the AI-related growth in demand for its chips (and curry favour with the US regime).
The company is guiding towards 20% CAGR of revenue and gross margins of at least 53% over 2024–2029. It believes it can earn an ROE of 25% through the cycle.
HDFC
Figure 16: HDFC (INR)

Source: Bloomberg
HDFC Bank (HDFC.com) is India’s largest private sector bank by assets. JAGI’s managers generally prefer India’s private-sector banks to its public sector ones, favouring those which have good governance and strong deposit franchises – such as HDFC, KMB, and Bank of Central Asia. The managers say that these banks are trusted by their customers and have a reputation for looking after the interests of minority investors.
HDFC’s shares have enjoyed a strong run over 2025, more than recouping their December 2024 losses and pushing on to new highs. The rally reflects improving fundamentals, with the bank reporting stronger interest margins, robust loan growth, and rising deposit inflows. Profits were further lifted by a one-off gain of INR 91bn from the sale of its non-banking financial services arm. A more supportive regulatory backdrop also helped, with India’s central bank cutting reserve requirements during the year.
Figure 17: Largest underweight positions as at 30 June 2025
| JAGI weight (%) | Underweight (%) | |
|---|---|---|
| Samsung Electronics | 1.31 | (1.79) |
| Xiaomi | Nil | (1.69) |
| AIA Group | Nil | (1.24) |
| ICICI Bank | Nil | (1.15) |
| Pinduoduo | Nil | (0.94) |
Figure 18: Xiaomi (HKD)

Source: Bloomberg
Xiaomi
The JAGI team acknowledges that having no exposure to Xiaomi has been unhelpful recently. Xiaomi has done well to diversify its revenue, often following a model of entering a market with a low-end offering, taking market share, and then improving product quality. Xiaomi did this in the mobile handset market, and then repeated the process in home appliances (building a strong presence in the ‘internet of things’ (IOT).
More recently, Xiaomi has been targeting the electric vehicle (EV) sector. JAGI’s managers are cautious on this move, given the strength of the competition in China (40 car companies are competing for share if you include western firms) and a switch of strategy by entering the market at the premium end.
It has been observed that Xiaomi’s models bear a close resemblance to those of western competitors. Xiaomi’s SU7 closely resembles the Porsche Taycan, for example, and its new YU7 model looks a lot like Ferrari’s SUV.
A lot of capital is being dedicated to this area in China, and JAGI’s managers feel that Toyota is a potential aggressive competitor. The apparent ease of Xiaomi’s entry to the market might suggest that barriers to entry are low. Nevertheless, the team is keeping a close eye on Xiaomi and other leading players in the sector. There is a feeling that companies in the supply chain may be interesting too.
The clear danger here is one of overcapacity, which is a problem in other parts of Chinese industry.
Others
China Construction Bank is part state-owned. Again, it has had a good run of share price performance in recent years (up about 30% over the past 12 months). However, the managers are wary that, at times, minority investors’ best interests may not be looked after. The JAGI team does like ICICI Bank, but KMB has been a better investment recently. Pinduoduo was discussed previously. It is particularly sensitive to the impact of tariffs.
Performance
As Figure 19 shows, over the last five years JAGI has been able to deliver a NAV return that has exceeded its benchmark, albeit that – on a relative basis – it has retrenched from highs achieved in January 2023.
Figure 19: JAGI NAV total return relative to MSCI AC Asia ex Japan over five years ended 31 July 2025

Source: Morningstar, Marten & Co
Figure 20: Cumulative total returns over periods ending 31 July 2025
| 3 months(%) | 6 months(%) | 1 year(%) | 3 years(%) | 5 years(%) | |
|---|---|---|---|---|---|
| JAGI share price | 14.4 | 8.2 | 14.8 | 28.5 | 25.1 |
| JAGI NAV | 14.8 | 8.1 | 15.9 | 27.8 | 33.5 |
| MSCI AC Asia ex Japan | 15.6 | 9.5 | 16.4 | 26.4 | 28.0 |
Contributors and detractors
The top five absolute contributors and detractors to JAGI performance over the 12 months ending 31 May 2025 are shown in Figure 21. Of the top five contributors, Hong Kong Exchanges & Clearing, Alibaba, and Telstra are covered on pages 7 to 9.
Figure 21: JAGI top contributors and detractors over 12 months ended 31 May 2025
| Top contributors | Return over period % | % contribution | Top detractors | Return over period % | % contribution | |
|---|---|---|---|---|---|---|
| Tencent Holdings | 31.6 | 1.74 | Reliance Industries | (17.5) | (0.59) | |
| Hong Kong Exchanges & Clearing | 46.5 | 1.31 | Colgate-Palmolive India | (31.1) | (0.49) | |
| Alibaba Group Holding | 44.0 | 1.31 | Kanzhun | (32.2) | (0.38) | |
| Telstra Group | 31.8 | 0.58 | Soulbrain | (53.6) | (0.37) | |
| NetEase | 35.3 | 0.55 | Parade Technologies | (19.5) | (0.28) |
Figure 22: Tencent (HKD)

Source: Bloomberg
Tencent
Tencent (tencent.com), the Chinese technology conglomerate, has delivered good share price returns over the past year, thanks to a combination of increased share buybacks and improving earnings (particularly for its gaming division). Tencent gaming revenues increased by 24% YoY in its most recent earnings update (for Q1 2025) and this remains the largest contributor to the firm’s revenue, driven in part by the successful launch of its mobile game Delta Force, which has become one of the world’s most popular mobile games. Tencent has increased its spending on AI, launching an AI chatbot within its WeChat platform. Tencent’s management feels that AI integration can help improve marketing revenues, improving click-through rates, for example.
NetEase
Figure 23: NetEase (HKD)

Source: Bloomberg
NetEase (www.netease.com) is a Chinese software company best known for its online and mobile games, though it also offers other services such as e-commerce, advertising, and emails. NetEase’s recent returns reflects the strong performance of its gaming arm, particularly some of its newer games, like Marvel Rivals and Where Winds Meet, as well as the stronger-than-expected performance from some of its legacy titles. In its most recent earning update (for Q1 2025), NetEase reported a 7% YoY increase in revenues, with its gaming arm reporting a 12% YoY increase in revenues (now making up 83% of total revenue). NetEase also reported improving profitability, up 8.6% YoY, thanks in part to lower operating expenses, which were down 14.4% YoY due to more innovative marketing efforts. Analysts are expecting the two aforementioned titles to support revenue growth over the year, with two new game releases (Marvel Mystic Mayhem and Destiny Rising) also earmarked as potential sources for further revenue growth.
Reliance Industries
Figure 24: Reliance Industries (INR)

Source: Bloomberg
Reliance Industries (ril.com) is an Indian conglomerate, and the country’s largest employer. Its business ranges from energy, gas, and oil, to media, telecoms, and retail. Reliance Industries shares have been under pressure due to weaker earnings from its commodities arms between its 2023 and 2025 financial years, as well as lower margins from its refining and petrochemical arm. And while its consumer businesses, such as its telecoms and retails services, have generated positive earnings growth over FY25 year, it has been insufficient to offset weakness elsewhere in the business. The market had previously reduced its expectations for FY25. However, the market appears increasingly bullish for the FY26 outlook, believing that past margin pressures are behind it.
Colgate-Palmolive India
Figure 25: Colgate-Palmolive India (INR)

Source: Bloomberg
Colgate-Palmolive India (colgatepalmolive.co.in) is an Indian consumer goods company, primarily making personal care products such as toothpaste and skin care. Colgate-Palmolive’s share price performance reflects the selloff from its October 2024 all-time-high. The catalyst for this was its weak Q2 results (for FY25), specifically below-expectations EBIDTA due in part to higher advertising and promotional expenditure. Its management also indicated that near-term demand would remain subdued, something that has been reflected in its subsequent results and share price.
Kanzhun
Figure 26: Kanzhun (HKD)

Source: Bloomberg
Kanzhun (ir.zhipin.com) is a Chinese human resources company that focuses on app-based online recruitment services. Since its IPO in December 2023, Kanzhun’s share price has been volatile. Given the inherent sensitivity of hiring to economic activity, Kanzhun’s share price may reflect the general uncertainty around China’s economic outlook over the past 12 months. We note that these headwinds have impacted sentiment rather than operational performance, as Kanzhun reported a 23% increase in revenue over its 2024 financial year and a 43% increase in net income – growth which has continued into the first quarter of 2025.
Peer group
Up to date information on JAGI and its peer group is available on the QuotedData website
There are five trusts within the AIC’s Asia Pacific Income sector. JAGI is the smallest of these, although with a c.£300m market cap we believe that its size is not a material impediment to the demand for its shares. JAGI’s discount is close to the sector median.
The new dividend policy (see page 19) may not yet be reflected in Morningstar’s numbers, but JAGI’s dividend yield will be competitive. While two of JAGI’s peers, Aberdeen Asia Income and Henderson Far East Income, will still offer a higher yield, both of these strategies have a stronger bias to value stocks than JAGI.
JAGI can boast the lowest ongoing charges ratio of its peer group, which is made more impressive given the fact that it is also the smallest trust and thus lacks the same scale-advantages of its peers. This reflects the trust’s management fee structure, which is described on page 22.
Figure 27: Asia Pacific Income peer group stats as at 31 July 2025
| Market cap(£m) | Discount(%) | Dividend yield(%) | Ongoing charge(%) | |
|---|---|---|---|---|
| JAGI | 273 | (9.5) | 5.8 | 0.78 |
| Aberdeen Asian Income Fund | 337 | (9.5) | 6.7 | 0.85 |
| Henderson Far East Income | 414 | 3.4 | 10.8 | 1.08 |
| Invesco Asia Dragon | 826 | (8.6) | 4.2 | 1.03 |
| Schroder Oriental Income | 853 | (4.1) | 4.0 | 0.88 |
| Peer group median | 416 | (9.2) | 4.5 | 0.88 |
| JAGI rank | 5/5 | 4/5 | 3/5 | 1/5 |
Despite its outperformance of its benchmark, JAGI’s three and five-year returns are below those of the peer group median. Some peers adopt more extreme asset allocation bets, but the five-year figures are also distorted by the effects of the COVID-related selloff. This also helps to explain why JAGI’s track record is more competitive over a three-year time period, which is not affected by this.
Figure 28: Asia Pacific Income peer group NAV total return performance over periods ending 31 July 2025
| 3 months(%) | 6 months(%) | 1 year(%) | 3 years(%) | 5 years(%) | |
|---|---|---|---|---|---|
| JAGI | 14.4 | 8.2 | 14.8 | 28.5 | 25.1 |
| Aberdeen Asian Income Fund | 18.8 | 7.1 | 18.4 | 32.1 | 68.9 |
| Henderson Far East Income | 15.1 | 4.6 | 12.1 | 14.3 | 16.1 |
| Invesco Asia Dragon | 17.9 | 11.7 | 21.5 | 33.1 | 70.9 |
| Schroder Oriental Income | 17.8 | 10.2 | 13.4 | 37.1 | 71.7 |
| Peer group median | 17.8 | 8.2 | 14.8 | 32.1 | 68.9 |
| JAGI rank | 5/5 | 3/5 | 3/5 | 4/5 | 4/5 |
Dividend
In December 2024, JAGI revised its dividend policy, from approximately 4% of NAV per annum to approximately 6% of NAV per annum. The change was intended to reflect an environment of higher interest rates (and hence more competition from cash and bond investments for income investors’ attention).
With effect from its 2025 financial year, JAGI now pays regular quarterly dividends of 1.5% of quarter-end NAV. Any shortfall on the revenue account is made up through distributions of capital.
Following the payment of the fourth quarterly dividend for FY2024, JAGI’s distributable reserves stood at £160.325m.
Figure 29: JAGI five-year dividend record, financial years ended 30 September

Source: JPMorgan Asia Growth and Income
Figure 29 illustrates the dramatic increase in dividend income since the policy change. We have included a notional 6.3p dividend for October to give the full-year picture. If we annualise that, the yield on the current share price would be 6.4%.
Premium/(discount)
Over the 12-month period ending 31 July 2025, JAGI’s discount moved within a range of 7.3% to 13.6% and averaged 9.4%. At 31 July 2025, JAGI’s shares were trading on a 9.5% discount to NAV.
Share buybacks are used with the aim of ensuring that JAGI’s shares trade no wider than an 8%–10% discount to NAV. Shareholders have given JAGI’s board the authority to repurchase 14.99% of the issued share capital, and issue up to 10%. These permissions are renewed at each AGM. If, as happened last year, the directors feel that it is necessary, they will convene a meeting to secure additional share buyback permissions.
Over 2020 and 2021, JAGI’s shares traded at a premium – reflecting the wider demand for higher growth strategies during the COVID pandemic period which was characterised by lower interest rates.
Discounts across the whole investment company sector widened as interest rates rose in 2022 and JAGI was no exception to this.
The discount control mechanism has done a good job of moderating discount volatility since then.
Figure 30: JAGI premium/(discount) over five years ended 31 July 2025

Source: Morningstar, Marten & Co
Figure 31: JAGI share repurchases by month

Source: JPMorgan Asia Growth and Income
Over the past 12 months the company has repurchased 12.1m shares, equal to 14.8% of the shares in issue.
Structure
Capital structure
At 31 June 2025, JAGI had 97,796,993 ordinary shares in issue of which 28,789,002 were held in treasury. The number of shares with voting rights was 69,007,991.
Gearing
JAGI does not have a conventional borrowing facility. However, it is able to gear by using contracts for difference. This a low cost and flexible way of seeking to enhance returns. JAGI uses this modestly. As at 30 June 2025, gearing was 4.9%.
Key dates
JAGI’s financial year end is 30 September. Full-year results are announced in December and interims in May. The AGM is held in February.
There is a continuation vote scheduled for the AGM in 2026 and every three years thereafter.
Fees and costs
JAGI charges a flat management fee of 0.60% per annum, based on the average of the preceding three-month end capitalisations. We feel that the use of market capitalisation to calculate management fees rather than NAV is a better outcome for shareholders, as it incentivises JAGI’s manager to help narrow its discount. There is no performance fee.
JAGI’s articles of association stipulate that the aggregate fees incurred by the board’s renumeration must not exceed £250,000 per annum, and any increase in this maximum requires both board and shareholder approval.
For the year ended 30 September 2024, JAGI had an ongoing charges ratio of 0.78%, the same figure reported for the previous 12 months. JAGI’s 2024 ongoing charges ratio reflected management fees of £1.7m, and administration fees of £0.8m.
Management team
Robert Lloyd
Robert Lloyd, managing director, is a portfolio manager for the Asia Pacific Core Strategy and a member of the Japan team within the Emerging Markets and Asia Pacific (EMAP) Equities team. Based in Hong Kong, he joined the firm in Tokyo in 2005 and transferred to Hong Kong in 2009. Prior to this, Robert spent three years with UBS Asset Management in Tokyo as an investment analyst, initially for risk management and latterly for Japanese equities. He began his career as a collateral analyst in the credit group of Deutsche Bank, Tokyo. Robert obtained a B.A. in Literature and Linguistics from the University of Montana, U.S.
Pauline Ng
Pauline Ng, managing director, is a country specialist for ASEAN equities and head of the ASEAN team within the Emerging Markets and Asia Pacific (EMAP) Equities team based in Singapore. Pauline joined the firm in 2005 from AllianzDresdner Asset Management where she was first an Asia ex-Japan telecommunications analyst and latterly as a fund manager responsible for Malaysia and emerging Asia. Pauline obtained a Bachelors degree in Accounting from Nanyang Technological University in Singapore. She is a CFA Charterholder and a Certified Public Accountant.
Board
JAGI has five directors, all of whom are non-executive and independent of the manager.
Diana Choyleva will step down on 4 August 2025 due to the pressure of her other commitments. Peter Moon will retire at the AGM in February 2026, following the completion of his nine-year tenure as a director. Recruitment for their replacements is underway.
Figure 32: Board member – length of service and shareholdings
| Director | Position | Date of appointment | Length of service (years) | Annual fee (GBP) | Shareholding (30/9) |
|---|---|---|---|---|---|
| Sir Richard Stagg | Chairman | Jul 2018 | 6.9 | 46,000 | 8,000 |
| Diana Choyleva | Director | Mar 2023 | 2.3 | 31,000 | – |
| Peter Moon | Senior independent director | Aug 2016 | 8.9 | 34,500 | 10,000 |
| June Aitken | Chair of the audit and remuneration committees | Jul 2018 | 6.9 | 38,000 | 11,505 |
| Kathryn Matthews | Director | Jun 2023 | 2.0 | 31,000 | 2,800 |
Sir Richard Stagg
Richard is a former member of the British Diplomatic Service. His last two roles were ambassador to Afghanistan between 2012 and 2015 and high commissioner to India between 2007 and 2011. Richard’s previous positions included chief operating officer, private secretary to the Foreign Secretary and ambassador to Bulgaria. He also chaired the board of FCO Services between 2007 and 2017 (a government-owned company delivering security services to the UK and foreign governments).
He is currently warden of Winchester College. He is also a non-executive director of Max Financial Services, an Indian listed company; a trustee of the Turquoise Mountain Foundation (which works in Afghanistan, the Middle East and Myanmar). He was previously chairman of Rothschild & Co (India).
Diana Choyleva
Diana is a leading expert on China’s economy and politics and is chief economist and holds the position of a director at Enodo Economics Ltd, an independent macroeconomic and political forecasting company. She is also a non-resident senior fellow on the Chinese economy at the Asia Society Policy Institute’s Center for China Analysis in New York. Previously she worked at Lombard Street Research, most recently as their chief economist and head of research.
Peter Moon
Peter was chief investment officer of the Universities Superannuation Scheme. He is chairman of Bell Potter (UK) Limited and is a director of First Property Plc. He is the former chairman of The Scottish American Investment Company Plc, a former director of MBNA Europe, and a former member of the National Association of Pension Funds Investment Committee.
June Aitken
June is currently the chair of CC Japan Income & Growth Trust Plc, and non-executive director of Schroder Income Growth Fund Plc and BBGI Global Infrastructure SA. She was also previously on the board of HSBC Bank Japan, Aquarius Fund, an Asian fixed income fund, Australian Securities Exchange listed Emerging Markets Masters Fund and the Asian Masters Fund Limited, Erudine Holdings Ltd, a financial software consultancy firm and the Shepherds Bush Housing Group. June was a founding partner and investor of Osmosis Investment Management LLP.
Kathryn Matthews
Kathryn was the chief investment officer for Asia ex Japan equities at Fidelity International. Prior to that she held senior management roles with AXA Investment Managers and Baring Asset Management.
Kathryn has been on the board of a number of investment trusts including Fidelity Asian Values Plc and JPMorgan Chinese and is currently a non-executive director of the Vietnamese Opportunities Fund Plc.
She is also the chairman of Barclays Investment Solutions Ltd and is a non-executive director of British International Investment Ltd.
SWOT/Bull-bear
| Strengths | Weaknesses |
|---|---|
| Attractive dividend from an investment style usually unavailable to income investors | Enhanced dividend can eat into NAV in falling markets |
| Offers a ‘core’ exposure to Asian equities with a process supported by JPM’s considerable resources | High correlation to the wider market (0.97 over five years) |
| Competitive, shareholder-aligned, fee structure | More sensitive to interest rates than some of the more ‘typical’ value-biased income portfolios |
| Opportunities | Threats |
| Alleviation of market risk and inflationary pressures may be a tailwind for JAGI’s relative returns | Ongoing trade war may hit investor sentiment around export-heavy Asian economies. |
| JAGI’s discount reflects past sell pressure, and may re-rate during a market recovery | High concentration risk (e.g. TSMC) may increase its exposure to stock-specific issues. |
| Asian equites (and many of JAGI’s holdings) are directly benefiting from the proliferation of AI | Any reversal of recent dollar weakness could be a headwind to Asian equites |
| Source: Marten & Co |
| Aspect | Bull case | Bear case |
|---|---|---|
| Performance | Good track record of outperformance of benchmark | Low active share and strong correlation may leave JAGI trailing higher conviction approaches |
| Dividends | Attractive prospective dividend yield, ranks third of Asian trusts | If we see a market rout nominal dividend will fall as a result. |
| Outlook | Asian equites are attractively valued and supported by improving exchange rates | Trump tariffs may weigh on demand for the sector |
| Discount | Current discount is a possible ‘floor’ given strong track record of discount control | Selling pressure shrinks the trust |
| IMPORTANT INFORMATION | ||
|---|---|---|
| This marketing communication has been prepared for JPMorgan Asia Growth and Income Plc by Marten & Co (which is authorised and regulated by the Financial Conduct Authority) and is non-independent research as defined under Article 36 of the Commission Delegated Regulation (EU) 2017/565 of 25 April 2016 supplementing the Markets in Financial Instruments Directive (MIFID). It is intended for use by investment professionals as defined in article 19 (5) of the Financial Services Act 2000 (Financial Promotion) Order 2005. Marten & Co is not authorised to give advice to retail clients and, if you are not a professional investor, or in | any other way are prohibited or restricted from receiving this information, you should disregard it. The note does not have regard to the specific investment objectives, financial situation and needs of any specific person who may receive it.The note has not been prepared in accordance with legal requirements designed to promote the independence of investment research and as such is considered to be a marketing communication. The analysts who prepared this note are not constrained from dealing ahead of it, but in practice, and in | accordance with our internal code of good conduct, will refrain from doing so for the period from which they first obtained the information necessary to prepare the note until one month after the note’s publication. Nevertheless, they may have an interest in any of the securities mentioned within this note.This note has been compiled from publicly available information. This note is not directed at any person in any jurisdiction where (by reason of that person’s nationality, residence or otherwise) the publication or availability of this note is prohibited. |
Accuracy of Content: Whilst Marten & Co uses reasonable efforts to obtain information from sources which we believe to be reliable and to ensure that the information in this note is up to date and accurate, we make no representation or warranty that the information contained in this note is accurate, reliable or complete. The information contained in this note is provided by Marten & Co for personal use and information purposes generally. You are solely liable for any use you may make of this information. The information is inherently subject to change without notice and may become outdated. You, therefore, should verify any information obtained from this note before you use it.
No Advice: Nothing contained in this note constitutes or should be construed to constitute investment, legal, tax or other advice.
No Representation or Warranty: No representation, warranty or guarantee of any kind, express or implied is given by Marten & Co in respect of any information contained on this note.
Exclusion of Liability: To the fullest extent allowed by law, Marten & Co shall not be liable for any direct or indirect losses, damages, costs or expenses incurred or suffered by you arising out or in connection with the access to, use of or reliance on any information contained on this note. In no circumstance shall Marten & Co and its employees have any liability for consequential or special damages.
Governing Law and Jurisdiction: These terms and conditions and all matters connected with them, are governed by the laws of England and Wales and shall be subject to the exclusive jurisdiction of the English courts. If you access this note from outside the UK, you are responsible for ensuring compliance with any local laws relating to access.
No information contained in this note shall form the basis of, or be relied upon in connection with, any offer or commitment whatsoever in any jurisdiction.
Investment Performance Information: Please remember that past performance is not necessarily a guide to the future and that the value of shares and the income from them can go down as well as up. Exchange rates may also cause the value of underlying overseas investments to go down as well as up. Marten & Co may write on companies that use gearing in a number of forms that can increase volatility and, in some cases, to a complete loss of an investment.
| Authorised and regulated by the Financial Conduct Authority 50 Gresham Street, London EC2V 7AY 0203 691 9430 www.QuotedData.com www.martenandco.com Registered in England & Wales number 07981621 2nd Floor Heathmans House, 19 Heathmans Road, London SW6 4TJ |
|---|