
The elastic band stretches further
Montanaro UK Smaller Companies (MTU) invests in three areas currently out of favour with investors: the UK, small caps, and high-quality companies. Its portfolio companies continue to deliver decent revenue and earnings growth, but this progress is not being reflected in their valuations, which is weighing on MTU’s performance. The trust’s manager is convinced that patient investors will be well rewarded in time. In the meantime, shareholders in MTU benefit from its attractive dividend yield, which we believe is a factor in MTU’s relatively narrow discount.
The sheer volume of money that has been withdrawn from the UK equity market, and from the small-cap end of it in particular, has overwhelmed fundamentally-driven investors. Like an elastic band stretched almost to breaking point, when sentiment recovers and common sense prevails, the rebound could be spectacular.
Access to some of the UK’s best small companies, and a high yield
MTU aims to achieve capital appreciation through investing in small quoted companies listed on the London Stock Exchange or traded on AIM, and to outperform its benchmark, the Deutsche Numis Smaller Companies Index (excluding investment companies). MTU also provides shareholders with an attractive yield of approximately 6% of NAV.
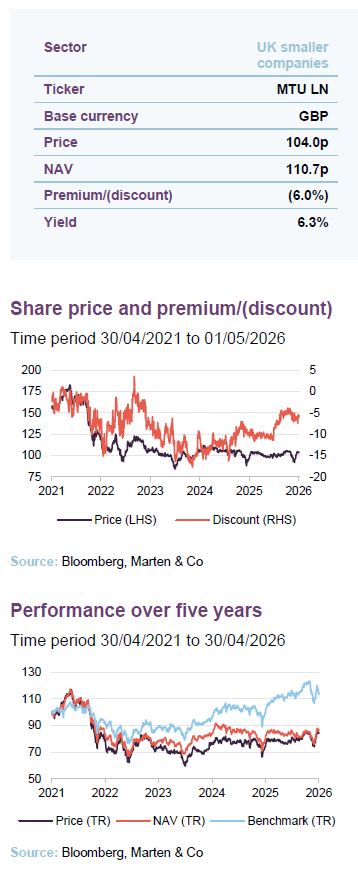
| 12 months ended | Share price total return (%) | NAV total return (%) | Deutsche Numis SC ex IC TR (%) | MSCI UK TR (%) |
|---|---|---|---|---|
| 30/04/2022 | (20.4) | (16.4) | (7.4) | 15.6 |
| 30/04/2023 | (7.9) | (5.6) | (3.0) | 8.3 |
| 30/04/2024 | 4.8 | 6.3 | 7.2 | 7.7 |
| 30/04/2025 | (2.9) | (3.6) | 4.0 | 8.1 |
| 30/04/2026 | 13.5 | 7.3 | 15.0 | 26.6 |
Fund profile – a strengthened investment process
More information is available at the manager’s website www.montanaro.co.uk/muscit
MTU aims to make long-term investments in the highest-quality UK smaller companies. It seeks capital growth while offering shareholders an attractive dividend yield of 1.5% of NAV each quarter, or approximately 6% of NAV per annum, funded by a combination of revenue and capital profits.
Montanaro Asset Management Limited (MAML) is the trust’s AIFM. Charles Montanaro established the firm 35 years ago, and MTU was launched in March 1995 with Charles as its lead manager. His son Adam is MTU’s back-up manager.
MAML has over £2bn of AUM, no debt, no outside shareholders, and a “blue chip” client base. This strong platform allows it to take a long-term approach, including investing in its team through market downturns, for example.
One of the largest teams in Europe focused on researching and investing in quoted small- and mid-cap companies
MAML has one of the largest teams in Europe focused on researching and investing in quoted small- and mid-cap companies. Three new recruits (two experienced analysts and a quantitative researcher) will soon join its existing multi-lingual and multi-national team of 14 analysts and portfolio managers, and 21 support staff. Members of the team own around 35% of MAML, contributing towards what Charles describes as a family culture within the business (half the team has been at MAML for over a decade). Members of the team are encouraged to invest alongside their clients, creating an alignment of interest.
We provided a detailed description of MAML’s stock selection approach in our last note. While the underlying philosophy and disciplined process has not and will not change, the manager is always striving to improve outcomes for investors.
A more diversified portfolio, with a broader definition of “quality growth”, making good use of technology
In the face of what has clearly been a challenging macroeconomic environment, since we last published, MAML has broadened and diversified MTU’s portfolio, raising the target number of stocks to 50–60. As part of that, the manager decided to broaden its definition of quality growth to include companies exhibiting both structural and cyclical growth.
MAML has also continued to invest in its systems, including in its new proprietary data insights platform. The team has access to a broad range of AI tools that operate within a secure environment. These assist the analysts and portfolio managers in areas such as identifying emerging investment themes, performing due diligence on new investment ideas (with a goal of speeding up that process), incorporating real-time company trading data into the investment process, looking for accounting red flags, and analysing/summarising insights from third-party firms such as Third Bridge, Guidepoint, and AlphaSense. Time previously spent on processing data manually is being redirected into higher-value thinking and discussion.
An analysis of sustainability remains integral to MAML’s investment approach. The firm has managed an “impact” strategy for over a decade and became a “B Corp” in 2019.
The trust is benchmarked against the Deutsche Numis Smaller Companies (excluding investment companies) Index, and we have also used the MSCI UK Index in this report. However, the benchmark plays no part in determining which stocks are selected for the portfolio, or how large positions are as a percentage of net assets.
UK, quality, and small-cap are all out of favour
UK stocks are cheap relative to peers – 12.3x current year earnings versus 19.9x for MSCI World
As Figure 1 shows, UK stocks have been underperforming peers for over a decade now, although perhaps we could argue that things have stopped getting worse more recently. The causes have long been debated, but Brexit looms large and the parlous state of the UK’s finances and our high energy costs are also frequently cited.
The UK’s large-cap stocks also tend to be biased towards value sectors. Investors’ strong preference for “growth” over “value” during the long period following 2008’s financial crisis, when interest rates and inflation were unusually low, was also a headwind. That period came to an end towards the end of 2021, and this marks the start of the small uptick in the UK’s relative performance.
Figure 1: MSCI UK versus MSCI ACWI
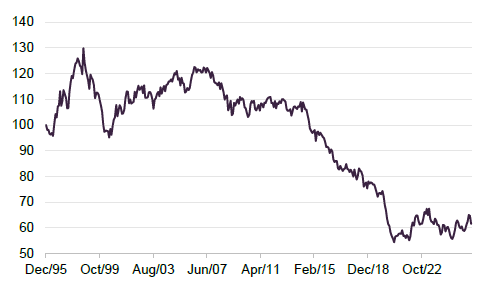
Figure 2: MSCI ACWI Quality versus MSCI ACWI
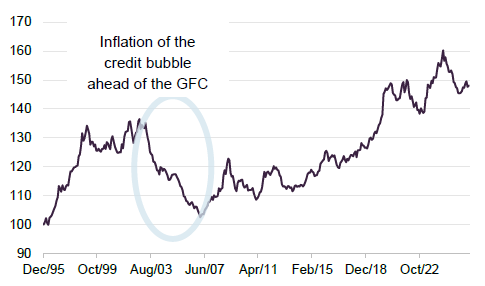
UK stocks classified as “quality” and “growth” have been amongst the worst-performing, especially over the past 12 months
The underperformance of “quality” is a more recent phenomenon following a long period where a bias to quality has been rewarded. The chart shows the global picture, while the table in Figure 3 shows some performance numbers for the UK market. The dispersion in the one-year returns is particularly marked.
Figure 3: Returns of MSCI UK style factor indices for periods ending 30 April 2026
| 5 years annualised (%) | 3 years annualised (%) | 1 year (%) | YTD (%) | |
|---|---|---|---|---|
| MSCI UK | 13.0 | 13.8 | 26.6 | 6.2 |
| Growth | 7.6 | 7.1 | 10.9 | 1.4 |
| Value | 16.4 | 18.2 | 38.2 | 9.6 |
| Quality | 5.7 | 6.6 | 4.8 | (0.9) |
| Momentum | 12.4 | 18.2 | 22.2 | 3.4 |
The reason most often cited for the underperformance of quality style investments is that they became too expensive, particularly around the COVID period. More recently, concerns about the impact of AI on the business models of several software and data companies previously seen as quality businesses have also weighed on share prices.
The underperformance of small cap versus large cap may be coming to an end
The underperformance of small caps versus large caps is also a longstanding global trend. However, in many countries there are signs that may be coming to an end.
Figure 4 shows a sharp sell-off in UK small caps relative to large caps that began in August 2021, as expectations of interest rate rises increased. However, zooming out, the brief but spectacular period of outperformance by small caps that began in March 2020 – as COVID hit and interest rates were slashed – looks like a blip in an otherwise downward trajectory that began in 2018.
Figure 4: Deutsche Numis Small Cap ex Investment Companies versus MSCI UK
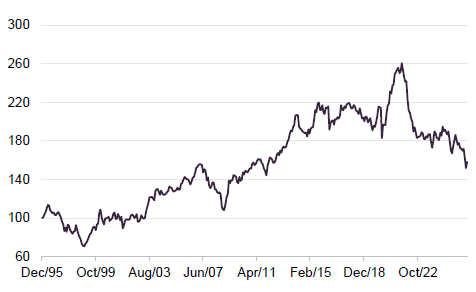
Figure 5: Deutsche Numis Small Cap ex Investment Companies versus Deutsche Numis Large Cap
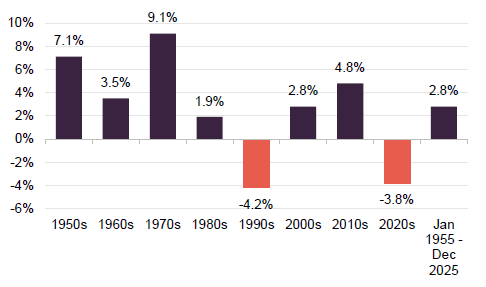
Figure 5, which uses data supplied by MAML, demonstrates that over the long term, small caps tend to outperform large caps (2.8% outperformance per annum for 70 years equates to returns for small caps that are almost six times higher than the return on large caps). There are good reasons for this; it is easier to grow from a smaller base, small caps can be nimble, and a relative lack of research means there is greater propensity for them to be mispriced, for example.
Prolonged periods of small-cap underperformance have happened before, but do not last forever
The 1990s were an anomaly, marked by repeated crises of confidence – the oil price spike associated with the First Gulf War, the bursting of Japan’s asset bubble, the Asian financial crisis, the collapse of LTCM, the Russian financial crisis, and the rise of the dotcom bubble. There are clear parallels with today’s environment. The key message, though, is that this period passed and small caps eventually returned to form.
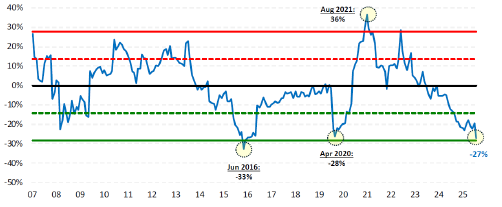
MAML did see signs of improvement in MTU’s relative returns in Q1 2026, noting that it ranked in the first quartile of UK small-cap funds over that period according to Morningstar. There was a modest improvement in the relative performance of small-cap growth relative versus small-cap value, while for the first time since 2020, AIM stocks outperformed main market small-cap stocks. However, any recovery has potentially a long way to go, as is reflected in the low valuations of UK small caps shown in Figure 6 and relative to UK large-cap stocks in Figure 7.
Figure 6: UK small-cap 12m forward P/E
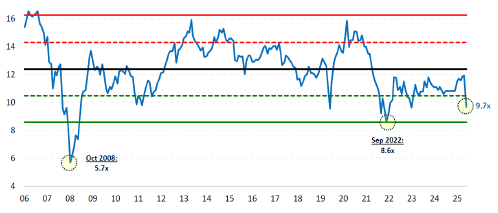
Figure 7: UK small- versus large-cap P/E
Valuations are cheap which suggests upside to come
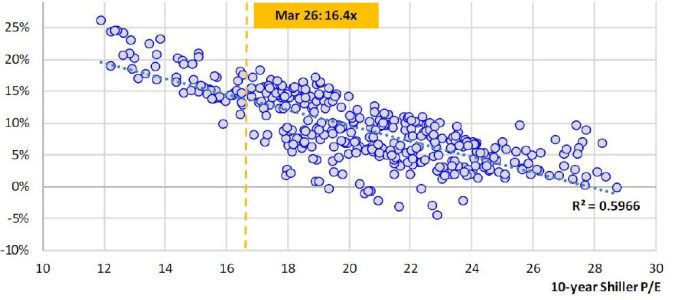
Figure 8 plots annualised five-year total returns on the Numis Smaller Companies Index over periods starting in December 1978 (the blue circles). The vertical axis shows the subsequent five-year return, and the horizontal axis represents the cyclically-adjusted (Shiller) P/E at the beginning of the five-year period. The analysis suggests that a starting P/E of 16.4x at the end of March 2026 might lead to returns of between 10% and 20% per annum over the next five years.
Figure 8: UK small- cap annualised five-year return versus starting 10-year Shiller P/E
The catalyst for a change in sentiment is hard to predict, but the mechanism for a re-rating of UK small caps is easier to imagine. Money has been flowing out of UK small-cap funds on an unprecedented scale over the past four years – £4.9bn of net outflows according to the Investment Association. When the tide turns, improving small-cap returns should attract fresh interest, potentially creating a self-reinforcing virtuous circle.
Asset allocation
As of 31 March 2026, MTU held 59 portfolio companies, a considerable increase from the 40 holdings it had one year earlier, reflecting the enhancements to the investment process we discussed on page 3.
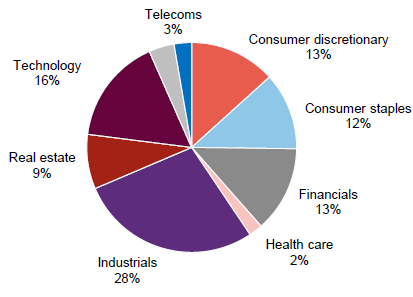
Looking at the breakdown of the portfolio by sector, the main changes over the past year have been an increase in exposure to basic materials (+6pp) and a reduction in exposure to technology (-9pp).
Figure 9: MTU sector split at 31 March 2026
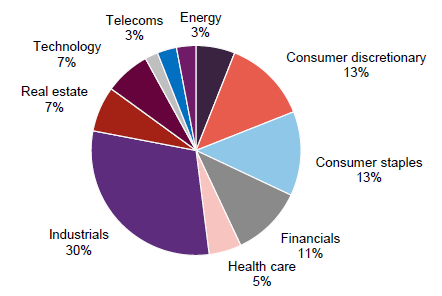
Figure 10: MTU sector split at 31 March 2025
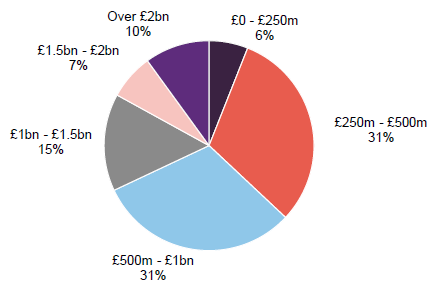
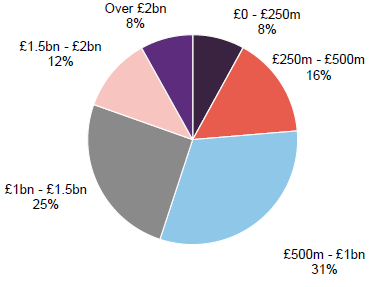
The shift in the portfolio’s market cap distribution towards slightly smaller companies, particularly those in the £250m–£500m range, reflects the opportunities that the manager identified in this part of the market.
Figure 11: MTU split by market cap at 31 March 2026
Source: MAML, Marten & Co
Figure 12: MTU split by market cap at 31 March 2025
Overall, the portfolio has a fairly high (81.8%) active share relative to its benchmark and is slightly less volatile, with a beta of 0.88 and three-year standard deviation of 14.2%, which compares to the index’s 14.8%.
Reflecting the valuation opportunity in UK small caps, the portfolio was valued on just 13.6x 2026 earnings or 10.3x EV/EBITDA at the end of March 2026. This is despite offering prospective annual earnings growth of 12.8% and an ROE of 14.4%. The strength of balance sheets in the portfolio shows up as average net debt/equity of just 0.4%.
An analysis of revenue by geography for the portfolio shows about half (52%) of revenues come from the UK, with about 19% from North America, 12% from Western Europe, and 8% from Asia.
Top 10 holdings
Since our last note, which used 31 March 2025 data, there have been six new entrants to MTU’s top 10: IntegraFin Holdings, Bloomsbury Publishing, Cranswick, MP Evans, Luceco, and XP Power.
These replaced Telecom Plus (whose shares fell on the back of weak profit figures in its interim results), Baltic Classifieds (which sold off after a broker downgraded its forecasts to reflect the impact of a new vehicle tax in Estonia, and has since been perceived as threatened by agentic AI), Porvair (which is still in the top 20), 4Imprint (which was perceived as being particularly threatened by the imposition of tariffs, but actually managed to deliver flat revenue and profits for 2025 over 2024), Bytes Technology Group, and JTC.
Bytes Technology and JTC were exits during Q1 2026. JTC was taken over by Permira at a 50% premium. Bytes Technology performed poorly after posting some disappointing figures, coupled with a poorly handled internal reorganisation.
Figure 13: MTU top 10 equity holdings at 31 March 2026
| Business | % as at 31 March 2026 | % as at 31 March 2025 | Change (%) | |
|---|---|---|---|---|
| IntegraFin Holdings | Software and computer services | 3.8 | 2.4 | 1.4 |
| discoverIE | Electronic and electrical equipment | 3.8 | 5.2 | (1.4) |
| Bloomsbury Publishing | Media | 3.8 | 2.8 | 1.0 |
| Cranswick | Food producer | 3.3 | 3.1 | 0.2 |
| XPS Pensions | Pension provider | 3.0 | 4.8 | (1.8) |
| MP Evans | Food producer | 2.9 | 3.2 | (0.3) |
| Luceco | Electronic and electrical equipment | 2.9 | 1.7 | 1.2 |
| XP Power | Electronic and electrical equipment | 2.8 | 1.9 | 1.0 |
| Hilton Food | Food producer | 2.8 | 4.4 | (1.6) |
| Big Yellow | Self-storage | 2.6 | 4.7 | (2.0) |
| Total of top 10 | 31.7 | 40.9 |
Looking at the new entrants in more detail:
IntegraFin Holdings
Figure 14: IntegraFin Holdings
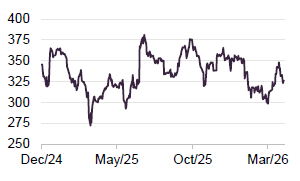
IntegraFin (integrafin.co.uk) describes itself as the UK’s leading adviser platform built on proprietary technology. It operates the Transact investment platform, which had £77.8bn of assets under direction at the end of March 2026 (up 18% on the prior year). The number of clients has grown too, although more modestly, from 241k to 255k.
The company is forecasting 11% revenue growth for H1 2026 and – thanks to a number of cost management initiatives – just 3% growth in administrative expenses in both 2026 and 2027, which should help drive decent earnings growth.
Investor platforms were seen as potential casualties of the advances in agentic AI, but solid Q1 2026 results appear to have calmed nerves.
Bloomsbury Publishing
Figure 15: Bloomsbury Publishing
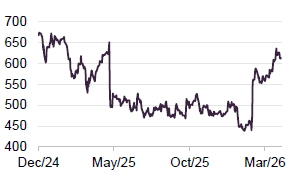
Bloomsbury Publishing (bloomsbury-ir.co.uk) experienced a sharp selloff in May 2025 following the back of the publication of its annual results in which profits came in below expectations. However, a trading update released at the beginning of March 2026 revitalised interest in the stock. MAML says that Bloomsbury should benefit when the new Harry Potter TV series launches later this year. The manager also notes that two new novels from Sarah J Maas are due in late 2026/early 2027. She was the best-selling author in the United States in 2024 and the No.1 bestselling Fantasy author in the UK in 2025. The company says its academic publishing business is doing well too. We will find out more when the company publishes its annual results later in May.
Cranswick
Figure 16: Cranswick
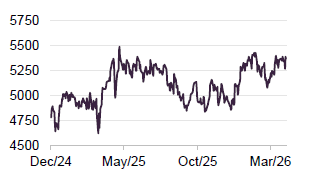
UK premium, fresh and added-value food products business Cranswick (cranswick.plc.uk) has been held in MTU’s portfolio for 12 years and has generated a 6.3x return over that time. Its last trading statement covered the Christmas 2025 period and the message was upbeat, saying full-year adjusted profit before tax would be towards the upper end of current market expectations.
Cranswick has been growing organically and through small bolt-on acquisitions, adding feed mills and genetics production to its pig business last year, for example, as well as investing in its branded and own-label convenience food range.
MP Evans
Figure 17: MP Evans
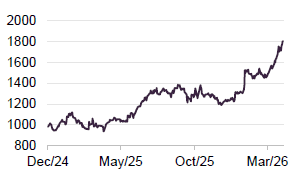
MP Evans (mpevans.co.uk) owns sustainable oil palm plantations in Indonesia and a stake in a Malaysian property company. Palm oil is used in a wide variety of products including shampoos, cosmetics, ice cream, biscuits, chocolate, and cereals, and demand has grown steadily for decades. Palm oil that has been certified as sustainable makes up about 20% of global supply. MP Evans has over 70,000ha under its management.
The total harvest for 2025 was 1.3m tonnes, up 7% year-on-year, and prices for MP Evans’s palm oil rose from an average of $823 per tonne to $866 per tonne. That underpinned revenue and profit growth, with EPS up 24%. The company has been increasing its dividend well ahead of inflation in recent years, up 14% for 2025 over 2024. The company is acquiring additional land, which will help deliver future growth.
Luceco
Figure 18: Luceco
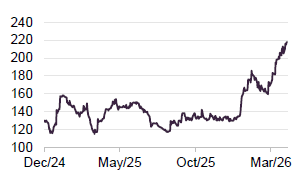
Luceco (lucecoplc.com) is a lighting and electricals business with a wide product range spanning wiring accessories, LED lighting, and portable power (including EV chargers).
Full-year figures released in March 2026 were very encouraging, showing 12% revenue growth in 2025, and higher margins, which fed through into 17% higher adjusted operating profits and 20% EPS growth. The dividend was increased by 20% and the company guided towards higher profits for 2026. Strong cash generation means Luceco has the balance sheet strength to support acquisitions.
MAML highlights the success of Luceco’s EV charging products. Luceco is predicting 17% CAGR in charger installations through to 2030, but with considerable room for that to be upgraded (it says that a mature EV charging market would be six times the 2025 installed base). This is just part of the opportunity presented by the increasing electrification of the UK economy.
XP Power
Figure 19: XP Power
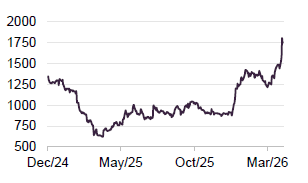
XP Power (corporate.xppower.com) makes AC-DC power supplies, DC-DC converters, high voltage AC-DC and DC-DC equipment, radio frequency (RF) power, three-phase power supplies, and filters for electromagnetic interference. Its products are used in a wide range of settings including healthcare, industrials, and semiconductor manufacturing.
US export restrictions hit its Chinese semiconductor business in 2025 and there was an element of customer destocking following tariff disruption. However, now MAML says XP Power is seeing growing demand across all of its business segments. Its 2025 results support that view with a 28% increase in orders and the company guiding towards an acceleration of revenue recovery in H2 2026.
New investments
The evolution of the portfolio, and the emphasis on increased diversification, over the past year is reflected in the long list of new positions. These are listed below, grouped by theme and category, with commentary from MAML.
High growth strategic themes
Electrification, energy transition, and grid upgrade
- Hill & Smith (HILS) – UK-headquartered manufacturer of infrastructure products including road safety barriers, galvanising services and electrical grid components.
- Volex (VLX) – Global manufacturer of power products, cable assemblies and complex wiring systems for electric vehicles, data centres and industrial applications.
- Volution Group (FAN) – Manufacturer and supplier of ventilation products and solutions for residential and commercial buildings across the UK and Europe.
Nuclear
- Avingtrans (AVG) – Buy-and-build acquirer of specialist engineering businesses serving the aerospace, energy and medical sectors.
- Goodwin (GDWN) – Family-controlled UK engineer producing high-integrity castings and refractory products for the energy, defence and petrochemical industries.
Defence, security, and space
- Cohort (CHRT) – A UK group of specialist defence technology companies providing electronic systems, sensors and cyber capabilities to military and government customers.
- Filtronic (FTC) – Designer and manufacturer of radio frequency and microwave electronics for defence, space and telecommunications applications, with notable supply links to SpaceX.
- SRT Marine Systems (SRT) – Developer of maritime vessel tracking and coastal surveillance technology based on AIS, supplying coast guards and navies globally.
Indirect/enabling exposure
Resources nationalism, critical minerals, energy security
- Amaroq (AMRQ) – Gold developer and explorer focused on advancing its large-scale Nalunaq gold project in Greenland.
- Capital Ltd (CAPD) – Diversified mining services company providing drilling, blast-hole and geotechnical services predominantly across Sub-Saharan Africa.
- Ecora Royalties (ECOR) – London-listed royalty and streaming company holding a diversified portfolio of royalties over mining assets including copper, cobalt and other critical minerals.
Infrastructure upgrade/environment
- Renew Holdings (RNWH) – Specialist engineering services provider focused on the maintenance and renewal of UK critical infrastructure including rail, nuclear and water.
- Restore (RST) – Data/storage compliance, demand driven by regulation.
Digitalisation, SaaS, data
- Craneware (CRW) – Provider of SaaS-based financial intelligence and analytics software to US hospital and healthcare systems.
- Elixirr International (ELIX) – Challenger management consulting firm offering strategy, digital transformation and innovation services to blue-chip and high-growth clients globally.
- Pinewood Technologies Group (PINE) – Provider of cloud-based dealer management system (DMS) software to automotive retailers across the UK and international markets.
Domestic/consumer
- A.G. Barr (BAG) – Scottish soft drinks manufacturer best known for the iconic IRN-BRU brand, also producing Rubicon, Funkin and other beverages.
- Angling Direct (ANG) – UK’s largest specialist fishing tackle retailer, but currently the smallest company in MTU’s portfolio, operating stores and an e-commerce platform serving anglers across the UK and Europe.
- Hollywood Bowl Group (BOWL) – Operator of the UK’s largest ten-pin bowling and mini-golf estate, with a growing presence in Canada through its Splitsville brand.
- The Beauty Tech Group (TBTG) – Provider of technology-enabled beauty devices and connected personal care products sold under multiple consumer brands.
Financials and real estate
- Derwent London (DLN) – London-focused office REIT specialising in the creative regeneration of commercial property in the West End and Tech Belt areas.
- FRP Advisory Group (FRP) – Specialist advisory firm focused on restructuring, insolvency, debt and corporate finance across the UK mid-market.
- Mortgage Advice Bureau (MAB1) – UK’s largest directly authorised mortgage broker network, connecting consumers with mortgage advisers across the country.
- Rathbones Group (RAT) – UK-based wealth management firm offering discretionary investment management and financial planning services to private clients and charities.
- Savills (SVS) – Global real estate services firm offering transaction advisory, property management and consultancy across residential and commercial markets worldwide.
Performance
The chart in Figure 20 reflects the factors that we laid out in pages 4–6, where MTU’s three core attributes – UK, quality, and small-cap – have all been out of favour with investors and have contributed to MTU’s NAV decline since 2021.
Figure 20: MTU NAV relative to Deutsche Numis Smaller Companies ex Investment Companies Index in total return terms over five years to 30 April 2026
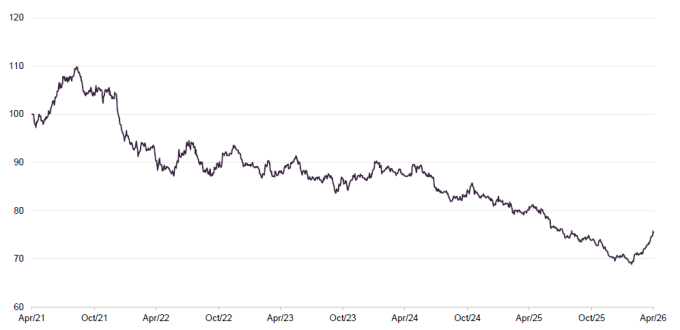
Figure 21: Total return performance over periods ending 30 April 2026
| 3 months (%) | 6 months (%) | 1 year (%) | 3 years (%) | 5 years (%) | |
|---|---|---|---|---|---|
| MTU share price | 0.0 | 5.6 | 13.5 | 15.5 | (15.4) |
| MTU NAV | 0.8 | 2.3 | 7.3 | 10.0 | (13.2) |
| Deutsche Numis Smaller Companies ex IC | (5.1) | 0.3 | 15.0 | 28.3 | 15.1 |
| Peer group median NAV1 | (4.0) | 1.3 | 10.0 | 11.8 | (14.6) |
| Peer group share price median | (4.8) | 1.5 | 13.7 | 16.1 | (15.9) |
Three months is too short a period to draw firm conclusions from, but – relatively, at least – the three-month numbers in Figures 20 and 21 do show an improvement. In fact, as we discuss in the peer group section on page 15, MTU ranked second of eight trusts in our peer group over that period. The Iran war has delayed the UK small-cap recovery but has made the valuation opportunity all the more attractive.
Performance attribution
Figures 22 and 23 provide insight into which stocks had the greatest impact on MTU’s returns relative to its Deutsche Numis ex investment companies Index benchmark over the 12 months ended 31 March 2026.
Contributors
Figure 22: Relative performance positive attribution, 12 months to 31 March 2026
| Contribution to return in MTU’s portfolio (%) | Contribution to benchmark return (%) | Contribution to relative return (%) | |
|---|---|---|---|
| XP Power | 1.33 | 0.06 | 1.25 |
| JTC | 1.56 | 0.41 | 0.85 |
| Alpha Group International | 1.24 | 0.48 | 0.81 |
| MP Evans | 0.84 | – | 0.69 |
| Hays | – | (0.46) | 0.59 |
| Total | 4.19 |
XP Power (which we discussed on page 10) made the greatest contribution to returns. Fund administrator JTC and foreign exchange-and payments business Alpha Group International were both taken over. MP Evans was discussed on page 9.
Detractors
Figure 23: Relative performance negative attribution, 12 months to 31 March 2026
| Contribution to return in MTU’s portfolio (%) | Contribution to benchmark return (%) | Contribution to relative return (%) | |
|---|---|---|---|
| Hilton Food | (1.13) | (0.17) | (1.46) |
| Bytes Technology | (1.24) | (0.29) | (1.45) |
| Indivior Pharmaceuticals | – | 1.51 | (1.43) |
| XPS Pensions | (0.81) | (0.10) | (1.37) |
| Baltic Classifieds | (1.07) | (0.30) | (1.19) |
| Total | (6.90) |
Hilton Food
Figure 24: Hilton Food
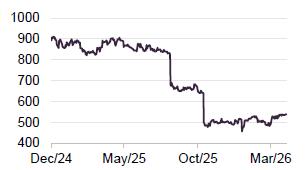
Hilton Food (hiltonfoods.com) is a food processing and packaging company specialising in meat, seafood, and vegetarian products. It was discussed in our last note. The company was hit by a series of profit warnings, with 2025 EPS coming in 8% lower than for 2024. The business faced significant inflation in its raw materials costs, which affected its Seachill white fish business. In addition, Hilton’s Foppen smoked salmon operations were disrupted as manufacturing was shifted from Greece to the Netherlands in response to restrictions placed on imports by the US Food and Drug Administration (FDA). The FDA said that unsanitary conditions in Greece were causing issues with Listeria contamination.
Peer group comparison
For the purposes of this report, we have used a subset of investment companies in the AIC’s UK smaller companies subsector as a peer group. Very small trusts have been excluded, those with unusual capital structures, those focused on an activist approach, and those investing in very small (micro-cap) companies. This leaves a peer group of eight.
Figure 25: Listed UK smaller companies peer group NAV total return performance over periods ending 30 April 2026
| 3 months (%) | 6 months (%) | 1 year (%) | 3 years (%) | 5 years (%) | |
|---|---|---|---|---|---|
| MTU | 0.8 | 2.3 | 7.3 | 10.0 | (13.2) |
| Aberdeen UK Smaller Companies Growth | (5.1) | (4.9) | 2.5 | 13.0 | (18.0) |
| Aberforth Smaller Companies | (2.9) | 2.9 | 18.0 | 30.4 | 24.7 |
| Artemis UK Future Leaders | (7.8) | (7.3) | 0.2 | (10.6) | (27.8) |
| BlackRock Smaller Companies | (5.0) | (0.2) | 8.6 | 5.8 | (16.4) |
| Henderson Smaller Companies | (5.0) | 0.4 | 13.9 | 10.5 | (16.0) |
| JPMorgan UK Small Cap Growth & Income | (2.9) | 2.2 | 11.4 | 30.0 | 1.0 |
| Rights & Issues | (3.0) | 2.3 | 14.4 | 16.5 | 4.9 |
| Peer group median | (4.0) | 1.3 | 10.0 | 11.8 | (14.6) |
| MTU rank | 1/8 | 2/8 | 6/8 | 6/8 | 4/8 |
As discussed, MTU’s quality-focus has held back returns relative to comparative indices and that has pushed it towards the lower end of the peer group rankings over most time periods. However, performance appears to be improving in 2026. Aberforth Smaller Companies follows a value style, which – as we discussed on page 4 – has been more successful over the past few years. Before 2025, Artemis Future Leaders was Invesco Perpetual UK Smaller Companies, but the 1-year figures shown in the table represent its performance under its current managers.
MTU’s efforts to control its discount have reduced the trust’s size, leaving it towards the smaller end of this peer group (although we excluded a number of even-smaller trusts from this group, as explained above).
MTU trades on the tightest discount of its peers, which we think reflects the attractive dividend yield (the highest of this group) and the share buyback activity. This could be beneficial when sentiment towards this area improves; we could even see MTU trading at a premium and reissuing stock.
This peer group has good control over running costs – every investment company that was excluded from this group has higher ongoing expenses. We think MTU is doing a good job of controlling its overheads, helped by a very competitive management fee of just 0.50% on net assets.
Figure 26: Listed UK smaller companies funds, comparison as at 1 May 2026
| Market cap(£m) | Discount(%) | Dividend yield(%) | Ongoing charge(%) | |
|---|---|---|---|---|
| MTU | 118 | (6.0) | 6.3 | 0.91 |
| Aberdeen UK Smaller Companies Growth | 231 | (8.4) | 2.7 | 0.85 |
| Aberforth Smaller Companies | 1,204 | (11.7) | 3.0 | 0.80 |
| Artemis UK Future Leaders | 102 | (13.5) | 4.5 | 1.00 |
| BlackRock Smaller Companies | 637 | (12.7) | 3.5 | 0.80 |
| Henderson Smaller Companies | 488 | (9.3) | 3.2 | 0.45 |
| JPMorgan UK Small Cap Growth & Income | 400 | (10.3) | 4.5 | 0.76 |
| Rights & Issues | 100 | (19.6) | 2.2 | 1.00 |
| Peer group median | 316 | (11.0) | 3.4 | 0.83 |
| MTU rank | 6/8 | 1/8 | 1/8 | 6/8 |
Enhanced dividend – c.6% yield on NAV
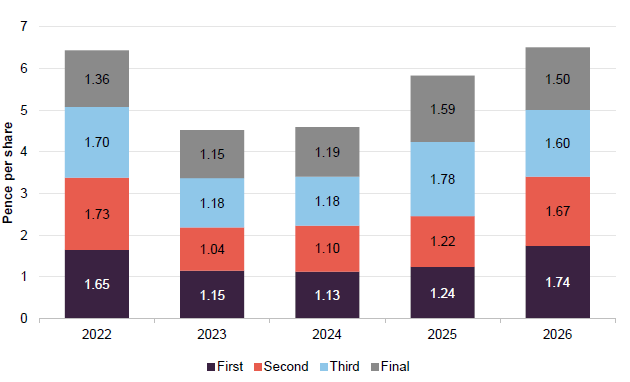
MTU declares and pays dividends quarterly. From December 2024 onwards, each dividend represents 1.5% of the previous quarter end NAV (up from 1% of NAV previously). For the financial year ended 31 March 2025, MTU earned a net revenue return of 3.3p per share (FY24 3.2p) and declared dividends totalling 5.83p. For the financial year ended 31 March 2026, MTU has declared dividends totalling 6.51p.
At the end of March 2026, the yield on the portfolio was 3.1% and dividends were forecast to grow at 5.6%. The shortfall of revenue from the income account is topped up from distributable capital reserves. At the time of the adoption of the enhanced dividend policy in December 2024, the board estimated that MTU had sufficient distributable reserves to maintain its new dividend policy for 28 years, even if there was no capital or income growth in the underlying portfolio.
Figure 27: MTU ordinary dividends (pence per share)
Premium/(discount)
Figure 28: MTU premium/(discount) over five years ending 30 April 2026
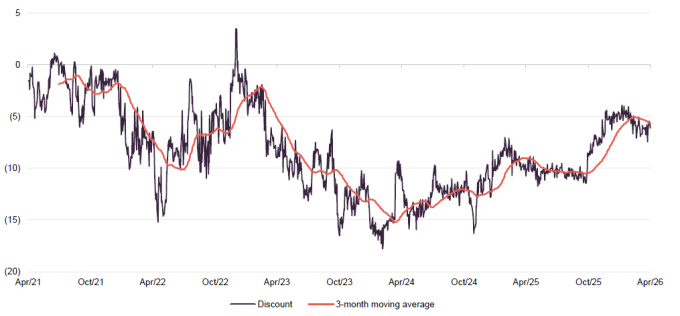
Over the year ending 30 April 2026, MTU’s shares traded within a discount range of 11.7% to 3.9%, with an average discount of 8.2%. As of 5 May 2026, MTU’s shares were trading at a discount of 6.0%.
Over 2026, MTU’s discount appears to have settled in the mid-single digits, which – as we discussed on page 16 – is the narrowest in its peer group. The adoption of the enhanced dividend strategy in December 2024 has likely contributed to MTU’s narrower discount as has its buyback programme.
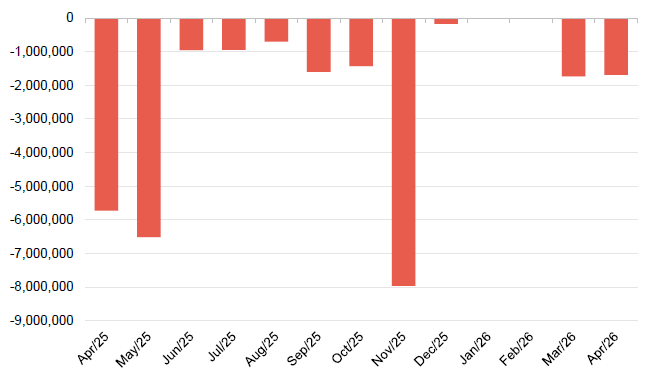
MTU buys back its shares when the opportunity arises, and since the start of 2025 it has bought back over 30% of its shares. Last November, Saba Capital Management LP sold its entire stake in the company. The pace of share buybacks has slowed materially since then. However, MTU has just published a circular to convene a meeting on 20 May 2026, at which it will ask shareholders to renew its share buyback authority.
At 1 May 2026, MTU had 167,379,790 shares in issue, 54,348,650 of which were held in treasury, leaving 113,031,140 shares with voting rights.
Figure 29: MTU share buybacks by month over the past year
SWOT analysis
Figure 30: SWOT analysis for MTU
| Strengths | Weaknesses |
|---|---|
| Well-regarded manager and considerable depth of resource | Long-term track record looks weak relative to peers and the trust’s benchmark |
| MAML continually strives to improve its investment process – reducing the concentration of the portfolio to reflect a more challenging environment, for example | |
| Quality bias should make MTU’s investments more resilient to economic shocks | |
| Opportunities | Threats |
| Low valuation of UK, quality, growth and small caps suggests upside when sentiment improves | Higher energy costs from Iran war are impacting on the UK economy and are likely to keep interest rates higher for longer |
| Switch in sentiment could drive self-reinforcing re-rating | Aggressive activists are stalking UK small-cap trusts |
| MAML expecting double-digit earnings growth in 2026 and 2027 |
Bull vs. bear case
Figure 31: Bull vs. bear case for MTU
| Aspect | Bull case | Bear case |
|---|---|---|
| Performance | Attractively valued, high-quality portfolio poised to re-rate when sentiment improves | This period of underperformance of small caps is one of the longest on record, but some years off that of the 1990s and macroeconomics remain unhelpful |
| Dividends | Attention-grabbing dividend yield differentiates MTU from peers | Dividend based on NAV and so would fall if NAV falls |
| Outlook | Stocks in MTU’s portfolio have good track record of delivering revenue and earnings growth | Worsening energy crisis could drive higher inflation, weighing on sentiment |
| Discount | MTU discount under control helped by buybacks and dividend yield | Further shrinkage of the trust could make it less attractive to wealth managers, reducing appetite for the shares |
Previous publications
Readers interested in further information about MTU may wish to read our previous notes listed below. You can read them by clicking on the links or by visiting the QuotedData website.
Figure 32: QuotedData’s previously published notes on MTU
IMPORTANT INFORMATION
This marketing communication has been prepared for Montanaro UK Smaller Companies Investment Trust Plc by Marten & Co (which is authorised and regulated by the Financial Conduct Authority) and is non-independent research as defined under Article 36 of the Commission Delegated Regulation (EU) 2017/565 of 25 April 2016 supplementing the Markets in Financial Instruments Directive (MIFID). It is intended for use by investment professionals as defined in article 19 (5) of the Financial Services Act 2000 (Financial Promotion) Order 2005. Marten & Co is not authorised to give advice to retail clients and, if you are not a professional investor, or in any other way are prohibited or restricted from receiving this information, you should disregard it. The note does not have regard to the specific investment objectives, financial situation and needs of any specific person who may receive it.
The note has not been prepared in accordance with legal requirements designed to promote the independence of investment research and as such is considered to be a marketing communication. The analysts who prepared this note are not constrained from dealing ahead of it, but in practice, and in accordance with our internal code of good conduct, will refrain from doing so for the period from which they first obtained the information necessary to prepare the note until one month after the note’s publication. Nevertheless, they may have an interest in any of the securities mentioned within this note.
This note has been compiled from publicly available information. This note is not directed at any person in any jurisdiction where (by reason of that person’s nationality, residence or otherwise) the publication or availability of this note is prohibited.
Accuracy of Content: Whilst Marten & Co uses reasonable efforts to obtain information from sources which we believe to be reliable and to ensure that the information in this note is up to date and accurate, we make no representation or warranty that the information contained in this note is accurate, reliable or complete. The information contained in this note is provided by Marten & Co for personal use and information purposes generally. You are solely liable for any use you may make of this information. The information is inherently subject to change without notice and may become outdated. You, therefore, should verify any information obtained from this note before you use it.
No Advice: Nothing contained in this note constitutes or should be construed to constitute investment, legal, tax or other advice.
No Representation or Warranty: No representation, warranty or guarantee of any kind, express or implied is given by Marten & Co in respect of any information contained on this note.
Exclusion of Liability: To the fullest extent allowed by law, Marten & Co shall not be liable for any direct or indirect losses, damages, costs or expenses incurred or suffered by you arising out or in connection with the access to, use of or reliance on any information contained on this note. In no circumstance shall Marten & Co and its employees have any liability for consequential or special damages.
Governing Law and Jurisdiction: These terms and conditions and all matters connected with them, are governed by the laws of England and Wales and shall be subject to the exclusive jurisdiction of the English courts. If you access this note from outside the UK, you are responsible for ensuring compliance with any local laws relating to access.
No information contained in this note shall form the basis of, or be relied upon in connection with, any offer or commitment whatsoever in any jurisdiction.
Investment Performance Information: Please remember that past performance is not necessarily a guide to the future and that the value of shares and the income from them can go down as well as up. Exchange rates may also cause the value of underlying overseas investments to go down as well as up. Marten & Co may write on companies that use gearing in a number of forms that can increase volatility and, in some cases, to a complete loss of an investment.