
25 years and going strong?
Private equity has been operating through a challenging period, which appears to have been extended by conflict in the Middle East and ongoing debate around the impact of artificial intelligence on software valuations. This environment has been associated with slower M&A activity and delayed exits. During this period, Patria Private Equity Trust (PPET) has delivered NAV total returns that have exceeded those of its peer group over the past 12 months (see the performance section), supported by exits (see asset allocation section) as it marks its 25th anniversary.
PPET’s manager states that, despite these challenges, the outlook remains constructive, emphasising that the underlying performance of portfolio companies appears strong, with revenue and earnings growth continuing across much of the portfolio. The manager also believes that the current period of uncertainty has created investment opportunities by reducing entry valuations and considers the last two to three years as potentially strong private equity vintages. The company has continued to deploy capital through the cycle, and the manager believes PPET may benefit when exit activity and valuation confidence return to previous levels.
Private equity fund of funds with a European bias
PPET aims to achieve long-term total returns through a diversified portfolio of private equity funds and direct investments, the majority of which will have a mid-market European focus.
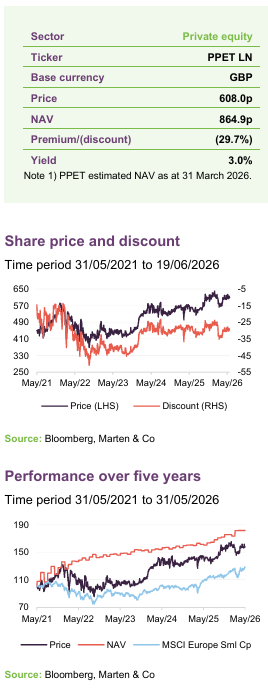
| Year ended | Share price total return (%) | NAV total return (%) | MSCI Europe Small Cap TR (%) | LPX Europe total return (%) |
|---|---|---|---|---|
| 31/05/2022 | 10.8 | 38.7 | (7.9) | (11.8) |
| 31/05/2023 | (7.6) | 6.9 | (4.8) | (10.6) |
| 31/05/2024 | 38.4 | 5.6 | 16.3 | 18.6 |
| 31/05/2025 | 0.8 | 3.0 | 6.9 | (4.3) |
| 31/05/2026 | 10.5 | 12.5 | 18.3 | (3.8) |
Source: Bloomberg, Marten & Co
Fund profile
Read more about the trust on its website: patriaprivateequitytrust.com
PPET invests in private equity funds and private companies in Europe. It makes primary commitments to and secondary purchases of private equity funds (mostly limited partnership vehicles, LPs), and it also makes “direct” investments into private companies via co-investments and single-asset secondaries.
The private equity sector has a long-term track record, as does PPET. Most investors may not be able to access the asset class directly. Listed private equity vehicles such as PPET provide exposure to private equity through a liquid listed vehicle that can be bought and sold on a daily basis.
According to the manager, the underlying companies that PPET backs tend to be growing, cash generative businesses in the mid-market range (companies with an EV of €100m–€1bn), which the manager states is under-serviced by the private equity industry when compared to the large- and mega-cap space. The manager believes that there is less competition for these companies, and that they may have greater opportunity for value creation and less reliance on IPO as an exit route. The manager also states that PPET may benefit from its longstanding relationships with Europe’s mid-market-focused managers.
Patria states that the returns on mid-market deals tend to exceed market averages. It cites a Preqin report that found small- and mid-market funds outperformed larger buyout funds by a median 266bps on a net IRR basis and a +0.1x net TVPI. Patria also notes that there appears to be a deeper pool of potential investments than in the large cap segment, entry prices tend to be lower, there may be more opportunities to create value, and there could be greater optionality around exits for firms of this size.
The trust marks its 25th anniversary this year, having been launched in 2001 as Standard Life European Private Equity (later Standard Life Private Equity and then abrdn Private Equity Opportunities). In April 2024, Aberdeen Group Plc sold its European private equity business to Patria Investments, and the company changed its name again. The senior team managing the portfolio, led by Alan Gauld, remained in place. The company now has access to the resources of Patria Investments, which has AUM of about $60bn.
Market update
Concerns over AI disruption of software businesses has hit valuations
Concerns around AI disruption of software businesses appear to have increased this year after Anthropic launched a range of productivity tools that compete with existing software programmes. This appears to have contributed to a broad sell-off of software stocks and may have impacted the valuation of private companies in this sector and, in turn, private equity trusts with exposure to them. This includes PPET, which has around a fifth of its portfolio exposed to software companies.
Figure 1: MSCI Europe and MSCI Europe Small Cap total return
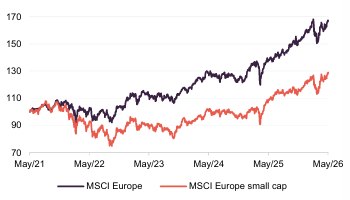
Source: Bloomberg, Marten & Co
Figure 2: MSCI Europe Software Index
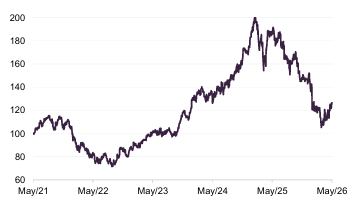
Source: Bloomberg, Martenberg, Marten & Co
PPET’s manager believes that the sell-off has been too broad-brush, with the whole software sector treated as one and the finer detail ignored. For example, the manager states that the type of software, the customer it serves, and the data set it uses all determine how exposed any given business may be.
Broad brush software sell-off ignores nuances across the sector, according to manager
The manager feels that disruption potential appears to be real in application software – the tools that run day-to-day workflows, serve customers and manage operations – citing contact centres where AI conversation agents have already replaced a significant number of human agents and adoption is expected to accelerate. However, the manager believes that others in the software sphere may be well protected.
The manager believes that a meaningful barrier to disruption is provided by proprietary and regulated data, which large language models alone cannot easily replicate. In “high-stakes” business processes – such as those in financial services, healthcare and legal sectors – the manager states that certainty, auditability and regulatory compliance have created a competitive advantage and may make them less vulnerable to disruption from general-purpose AI models. This, according to the manager, has reinforced their competitive advantages.
There appears to be significant uncertainty in software valuations at present. Until it becomes clearer which companies will benefit from AI adoption and which may be disrupted by it, valuations could remain volatile. While this may slow transaction activity in the near-term, PPET’s manager believes that businesses that successfully integrate AI into trusted software platforms are likely to strengthen their competitive positions and create significant value in the long-term.
Software buyouts at lowest level since Covid
Deal activity in the sector has decreased. Buyouts in the software sector have fallen to their lowest levels since Covid, with $50bn recorded in the first five months of 2026, compared to $88bn in the same period last year, according to PitchBook. As Figure 3 shows, deal activity has shifted from software to industrials.
Figure 3: Deal activity by sector (deal count)
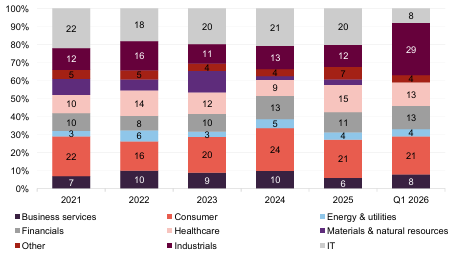
Source: Preqin
Despite software valuations having contracted, PPET has continued to commit capital to specialist technology investors, including software-focused private equity managers such as Hg and Expedition, stating that a compelling investment thesis is forming. PPET believes that opportunities remain available across the sector and that these private equity firms have demonstrated skills in identifying businesses that may be capable of embedding AI within existing workflows and delivering productivity improvements to customers.
Around a fifth of PPET’s portfolio is exposed to software companies, which may reduce the likelihood of exit opportunities in the near term. For example, uncertainty appears to have contributed to the cancellation of the planned London IPO of Norwegian software company Visma this year, which was PPET’s third-largest underlying company at the end of 2025.
Exit opportunities scarce
War in the Middle East is the latest global event that appears to have impacted the private equity exit landscape, with the market also contending with inflation, higher interest rates, war in Ukraine, and tariff uncertainty in recent years. Pricing appears to have softened during the past few years, with the implied cash yield for global buyout funds averaging 14.2% between 2022 and 2025, compared to 26.5% between 2013 and 2021, according to Preqin.
Lower entry valuations and less competitive deal environments may improve future return profile
PPET’s manager states that the prolonged period of uncertainty that has impacted market liquidity and valuation confidence has not yet affected business fundamentals, with PPET portfolio companies continuing to report revenue and earnings growth. Among its top 100 underlying portfolio companies, the average revenue growth over the 12 months to 30 September 2025 was 12.4% and the average EBITDA growth over the same period was 13.1%.
Although geopolitical events may delay exits and reduce short-term liquidity, the manager states that periods of uncertainty may improve future investment opportunities by creating lower entry valuations and less-competitive deal environments, while giving investors more time to conduct detailed due diligence. According to the company, some of the strongest private equity vintages may be created during periods when market sentiment is weak and transaction activity is subdued.
PPET has continued to invest during this period (see page 13 for details of recent transactions), balanced with other capital allocation objectives including share buybacks.
Investment process
PPET’s board oversees strategy, provides guidance to the manager, and challenges the investment approach at least annually, while day-to-day management is delegated to Patria Capital Partners.
PPET’s portfolio construction committee drives the top-down element of the investment process
The investment process combines top-down and bottom-up analysis. A semi-annual Portfolio Construction Committee (PCC) assesses the European macroeconomic environment, shaping long-term asset allocation and geographic focus. Although allocation changes gradually, the PCC develops country-level convictions on where opportunities may exist.
PPET’s European remit includes the UK. The manager estimates its universe contains around 1,500 European private equity funds, of which roughly 800 are considered “institutional grade” and theoretically suitable. Through origination efforts and regional specialists, PPET tracks these funds closely. Since European private equity firms typically raise capital every three to five years, around 150 funds are reviewed annually, though only a small number pass the screening process.
PPET identifies around five to 10 preferred funds in each market, with selected candidates forming the investment pipeline. The strategy has a bias toward northern Europe, where private equity markets are more developed. Detailed due diligence generally lasts around three months for primary fund investments, and one month for secondaries and direct investments.
PPET looks for “operational alpha”
A key selection principle is “operational alpha” — the value that managers may create by actively improving portfolio companies rather than acting as passive financial investors. According to PPET, preferred managers typically possess substantial in-house industrial expertise that can support portfolio businesses. PPET also evaluates whether managers have differentiated strategies or sourcing capabilities, as well as experienced investment teams. Sector specialists with consistent strategies are preferred, while any strategic or size drift may trigger a review. The manager also seeks to avoid excessive concentration risk within fund portfolios.
PPET looks for motivated and stable underlying managers
Team stability and alignment are considered important. PPET states a preference for motivated managers with strong succession planning and generally avoids firms operating an “investment bank” model, where staff turnover is often higher. While the manager reviews a broad range of fund sizes and managers, its focus is on companies with enterprise values between €100m and €1bn.
Historical performance is analysed, though it is recognised as backward looking and comprises only around 20% of a manager’s score. A high proportion of loss-making investments is viewed negatively, though the manager acknowledges that some losses are likely in private equity and prefers managers that demonstrate learning and improvement over time.
Long-term bias towards Europe
Although PPET is not exclusively focused on Europe, it maintains a long-term preference for European companies. The manager states that there is a deep pool of family and founder-owned businesses in Europe that private equity firms can help to further grow. The team believes Europe’s fragmented landscape — including differences in language, culture, and regulation — creates barriers to entry that may favour established firms with a local presence over competitors using a “fly-in” model. The team suggests that this can reduce competition in the European mid-market and may allow acquisitions at more attractive entry valuations. According to the manager, Europe is also viewed as a leader in ESG, with European private equity firms generally at the forefront of industry practices.
Fees on the underlying funds
PPET focuses on potential returns, net of fees
PPET devotes attention to analysing fund structures, reviewing whether fees are market-standard, managers are appropriately incentivised, and interests are aligned with investors. However, investment decisions are based on risk-adjusted net returns after fees, rather than the lowest headline costs.
PPET does not charge a performance fee in addition to the fees paid to underlying managers. More detail on PPET’s fee structure can be found on page 19.
Managing commitment levels
PPET aims to carefully manage over-commitments to minimise cash drag. Total outstanding commitments were £836.0m at the end of March 2026
Patria manages the portfolio to maintain a diversified maturity profile, using cash flow modelling to forecast drawdowns and distributions. The manager does not hedge currency exposure, stating that the cost outweighs the potential benefit. Uninvested cash is held in euros, sterling, or US dollars to reflect underlying exposures. The fund’s borrowing facilities are discussed on page 20.
PPET has followed an over-commitment strategy since inception in 2001. As of 31 March 2026, outstanding commitments totalled £836.0m, although approximately £82.3m is considered unlikely to be drawn.
Portfolio construction
PPET targets returns of 1.7x cost/15% IRR
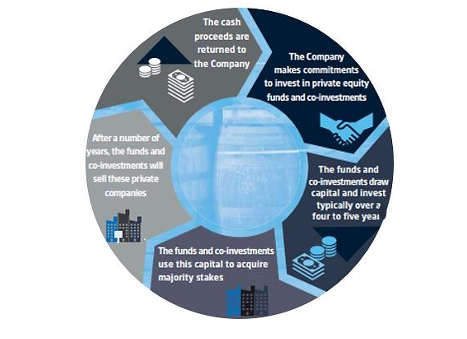
The investment process typically results in six to eight new primary fund commitments annually, each around €30m. Target net returns are stated as at least 1.7x invested cost over the investment life and a 15% IRR.
Figure 4: PPET’s investment cycle
Source: Patria
Secondaries and direct investments
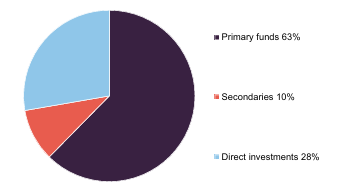
Secondaries were previously a growing component of the portfolio, but their weighting has declined in recent years as PPET appears to have increased its focus on direct investments. In these transactions, PPET invests directly alongside underlying private equity firms rather than solely through LP fund commitments. At the end of December 2025, direct investments made up 28% of the portfolio.
Direct investments and secondaries may provide certain characteristics, such as greater control over deployment timing, the ability to invest later once a company’s progress is clearer, more targeted exposure to specific sectors or deals, and potentially lower look-through ongoing charges, as these investments typically involve lower or no management fees.
The portfolio is monitored on an ongoing basis. PPET team members often sit on fund advisory boards, providing strategic oversight without participating in day-to-day management, and meet underlying managers quarterly. The manager states that it receives a high level of transparency into underlying portfolios, although not all company-level information can be disclosed publicly. Instead, PPET publishes aggregate metrics such as earnings growth and leverage levels.
PPET generally holds investments to maturity but may sell positions in the secondary market if expected returns appear to fall below target levels or if it believes maximum value has already been realised.
Asset allocation
PPET’s portfolio was valued at £1,412m at the end of December 2025, providing exposure to more than 700 underlying companies, with a continued focus on midmarket investments.
As of the end of 2025, 63% of the fund’s NAV was invested in LPs managed by 17 core European private equity managers, which comprise the primaries component of the portfolio. The weighting towards direct investments has steadily increased over the last few years to 28% across 37 companies at the end of 2025. The manager states that direct investments provide a more concentrated exposure to the team’s highest-conviction portfolio companies while lowering fee drag, because co-investments typically come with no fee or carried interest attached. The manager intends to continue increasing its exposure to direct investments, and argues that, if executed well, they should perform better than primary fund investments.
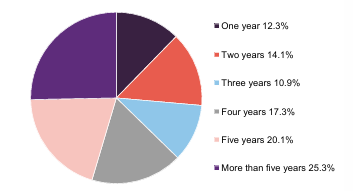
Figure 5: NAV split by holding period at 31 December 2025
Source: PPET
Figure 6: NAV split by investment type at 31 December 2025
Source: PPET. Note: Does not sum to 100 due to rounding.
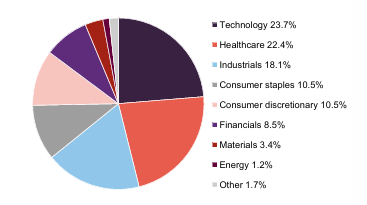
Figure 7: Sectoral exposure (%), 31 December 2025
Source: PPET
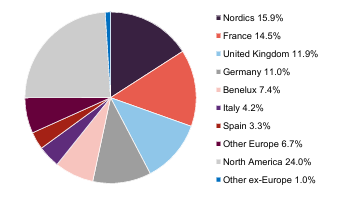
Figure 8: Geographic exposure (%), 31 December 2025
Source: PPET
The portfolio remains diversified by vintage, with around 62% of the underlying portfolio (including 22 direct investments) held for four years or more, and around a quarter held for more than five years. This represents approximately £885m of portfolio value that may be considered for exit when market conditions improve.
The portfolio is diversified across region and sector, with a notable allocation to northern Europe and to less-cyclical businesses such as those in healthcare, technology, consumer staples, and industrials.
At the end of September 2025, the 100 largest underlying companies accounted for 60.3% of PPET’s portfolio. The median valuation multiple (EV/EBITDA) of these companies was 13.7x. The median leverage multiple (debt/EBITDA) was 3.9x. The average revenue growth over the last 12 months was 12.4% and the average EBITDA growth over the same period was 13.1%.
Figure 9: PPET portfolio over the 12 months to 30 September 2025
| Top companies | Portfolio allocation (%) | Median valuation multiple (P/EBITDA) | Median leverage multiple | Average revenue growth (%) | Average EBITDA growth (%) |
|---|---|---|---|---|---|
| 10 | 15.8 | 14.8x | 3.2x | 15.8 | 20.3 |
| 30 | 33.0 | 14.6x | 3.6x | 13.2 | 13.7 |
| 50 | 43.0 | 13.8x | 3.6x | 11.6 | 12.5 |
| 100 | 60.3 | 13.7x | 3.9x | 12.4 | 13.1 |
Source: Patria
Top 10 fund exposures
Changes to fund allocations appear to be influenced by realisations, the pace of reinvestment, and the frequency of revaluation by the underlying managers. There are two new names in the top 10 since the last note: Investindustrial VII and Nordic Capital Evolution Fund.
The €3.8bn Investindustrial VII fund launched in 2019 and at the end of September 2025 held 13 companies. It targets mid-market companies within the industrial manufacturing, healthcare and services, and consumer sectors, with a particular focus on Southern Europe. Its largest portfolio companies include crane manufacturer Fassi Group, and Italian food and retail chain Eataly. PPET had an outstanding commitment of £7.1m to the fund at the end of September.
Nordic Capital Evolution Fund raised €1.2bn in 2021 with a focus on mid-market growth companies across northern Europe in sectors such as technology, healthcare, and financial services. At the end of September, it held 11 companies including Swedish multidisciplinary installation group Hjo Installation and fintech Qred. PPET had an outstanding commitment of £4.1m to the fund at the end of September.
Figure 10: 10 largest private equity funds, as at 30 September 2025
| Fund name and vintage | Strategy | Geography | Value 30/09/25£m* | Value 31/03/25£m* | % of NAV 30/09/25 | % of NAV 31/03/25 | NAV change (%) | Net mult.130/09/25 | Net mult.131/03/25 |
|---|---|---|---|---|---|---|---|---|---|
| Altor Fund V (2019) | Nordic Middle Market | Northern Europe | 38.7 | 30.7 | 3.1 | 2.6 | 0.5 | 1.5x | 1.4x |
| Nordic Capital Fund IX (2018) | Complex buyouts global healthcare | Northern Europe | 34.4 | 36.2 | 2.7 | 3.0 | (0.3) | 1.8x | 1.7x |
| Structured Solutions IV Primary Holdings (2021) | Various | Europe & North America | 33.2 | 34.0 | 2.6 | 2.8 | (0.2) | 1.3x | 1.3x |
| Altor Fund IV (2014) | Nordic Middle Market | Northern Europe | 31.8 | 31.2 | 2.5 | 2.6 | (0.1) | 1.7x | 1.7x |
| Triton Fund V (2019) | Mid-market buyouts | Northern & Western Europe | 27.6 | 29.0 | 2.2 | 2.4 | (0.2) | 1.7x | 1.5x |
| PAI Europe VII (2019) | Upper mid-market buyouts | Western Europe | 27.4 | 29.8 | 2.2 | 2.5 | (0.3) | 1.5x | 1.5x |
| American Industrial Partners VII (2019) | Industrials buyout | North America | 26.9 | 25.8 | 2.1 | 2.2 | (0.1) | 1.8x | 1.7x |
| Investindustrial VII (2020) | Industrial buyouts | Southern Europe | 26.9 | 23.5 | 2.1 | 2.0 | 0.1 | 1.6x | 1.6x |
| IK Fund IX (2020) | Mid-market buyouts | Northern Europe | 26.6 | 25.2 | 2.1 | 2.1 | – | 1.3x | 1.2x |
| Nordic Capital Evolution Fund (2021) | Mid-market buyouts | Northern Europe | 26.1 | 21.9 | 2.1 | 1.8 | 0.3 | 1.2x | 1.2x |
| Total of top 10 | 23.7 |
Source: PPET
New fund commitments
Over the six months to end March 2026, PPET made three new fund commitments for a total commitment of €84m, comprising:
- A €25m primary investment into Triton Smaller Mid-Cap III – a Pan-European lower mid-market fund focused on majority buyouts in business services, industrial tech, and healthcare sectors.
- A €42m commitment to Patria Co-Investment Partnership Fund I – a fund focused on European mid-market co-investments and managed by PPET’s manager Patria. Commitments to the fund are excluded from the calculation of PPET’s management fee to avoid double charging.
- A €17m primary fund commitment to One Peak Growth IV, a Pan-European fund focused on the technology sector.
Other commitments
PPET made a second tranche payment of £7m for the secondary transaction of Project Captain, a portfolio consisting of 13 fund interests and one direct investment.
Underlying holdings
Figure 11 shows PPET’s 10 largest underlying holdings at the end of 2025. Since then, PPET has made the partial sale of its direct investment in Action, generating proceeds of £19.1m, reducing its exposure to the discount retailer by approximately half. PPET’s manager states that it took advantage of a liquidity window (as it also did in 2023) to adjust the size of the investment within its portfolio, rather than selling based on company fundamentals.
The manager states that Action’s growth prospects remain strong, despite recent softness in France and Germany and uncertainty over its expansion into the US, and has therefore maintained a sizable exposure to participate in potential future upside. The realisation was achieved at 100% of the 31 December 2025 valuation.
PPET’s underlying holding in another food retailer, Spanish grocer Uvesco, was fully exited through the sale to a Spanish consortium in February.
Figure 11: 10 largest underlying holdings, at 31 December 2025
| Company | Business | Fund | % of NAV 31 Dec 25 | % of NAV31 Mar 25 | % change |
|---|---|---|---|---|---|
| Action | Consumer staples – non-food discount retailer | Co-investment | 3.0 | 2.5 | 0.5 |
| Wundex | Healthcare – home-based treatments | Direct | 2.3 | 1.9 | 0.4 |
| Visma | Technology – enterprise resource planning | Direct | 2.2 | 2.1 | 0.1 |
| Vitrea | Healthcare – rehabilitation | Direct | 1.5 | ||
| Uvesco | Consumer staples – Spanish food retailer | Direct | 1.4 | 1.6 | (0.2) |
| NAMSA | Healthcare – medical device provider | Direct | 1.4 | 1.6 | (0.2) |
| NOBA | Financial – digital consumer bank | Direct | 1.4 | ||
| Trioworld | Industrials – polyethylene film manufacturer | Direct | 1.3 | ||
| CFC Underwriting | Industrials/B2B Services – Insurance software and underwriting | Direct | 1.3 | 1.4 | (0.1) |
| Groupe NGE | Industrials – public works construction | Direct | 1.3 | ||
| Total of top 10 | 17.1 |
Source: PPET
Between the publication of the previous note (which used data as at the end of March 2025) and the end of 2025, there were four new entrants into PPET’s top 10 underlying holdings: Vitrea, NOBA, Trioworld and Groupe NGE. These replaced European Camping Group, Froneri, CDL Nuclear Technologies and access.
Vitrea is a pan-European rehabilitation provider, serving more than 100,000 patients per year through 75 facilities across Germany, Austria, Switzerland and the Czech Republic.
NOBA is a digital consumer bank operating across the Nordics and parts of Europe. The company provides consumer lending, savings products, mortgages, credit cards, and SME financing, with an emphasis on flexible, customer-focused financial services.
Trioworld is a manufacturer of polyethylene film with 18 factories across Sweden, Denmark, France, the UK, the Netherlands, Germany and Canada, as well as three recycling sites in Sweden, Denmark and France. Operations are organised into five reporting divisions: Stretch Film, Industrial Film, Consumer Packaging, Health Care Film, and Carrier Bags.
Groupe NGE is a French construction and civil engineering group specialising in infrastructure projects. It works across transportation, rail, utilities, energy, telecommunications, and urban development, delivering public works projects throughout France and internationally.
New direct investments
Over the six months ended 31 March 2026, PPET made three new direct investments and one follow-on direct investment.
Figure 12: PPET co-investments over the six months to 31 March 2026
| Co-investment name | Investment | Company description |
|---|---|---|
| Omilia | £9.2m | Provides conversational AI solutions for use in customer care settings. Investment alongside Expedition Growth Capital. |
| AlphaPet | €7.0m | German-based digital platform for premium pet food in Europe. Investment alongside Capiton. |
| Bluu Unit | €5.0m | German heating, ventilation and air conditioning (HVAC) business that installs and maintains commercial HVAC systems. Investment alongside Triton Partners. |
| Boost.AI (follow-on investment) | £0.3m | Specialist in conversational AI solutions for an array of different sectors. Investment alongside Nordic Capital. |
Source: PPET
Omilia is a conversational AI and customer experience (CX) technology company that specialises in voice AI, chat automation, and intelligent customer service platforms. Its platform is designed to help large enterprises automate contact centre interactions using natural language understanding, speech recognition, and voice biometrics, and is used in sectors such as banking, insurance, telecom, healthcare, and quick-service restaurants. Clients include Capital One, Taco Bell, Nissan, and Vodafone. Taco Bell uses Omilia’s technology to automate drive-thru ordering. According to the company, this has sped up the process during busy times and enabled upselling during quieter periods. The technology has been deployed to around 900 stores in the US, with 90% of orders at top-performing locations reportedly completed without human intervention. The average order value is reported to have increased by 5-10% through AI upselling.
Drawdowns and distributions
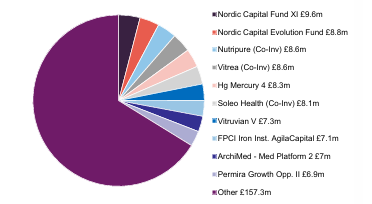
Figure 13: Drawdowns by source, 12 months to 30 September 2025
Source: PPET
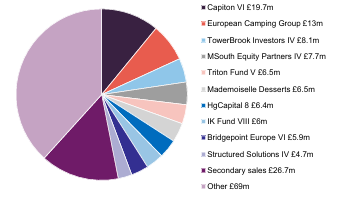
Figure 14: Distributions and secondary sales, 12 months to 30 September 2025
Source: PPET
Drawdowns since September 2025
Figures 13 and 14 show the drawdowns and distributions for PPET over the 12 months to end September 2025, as detailed in its annual report. In the six months to the end of March 2026, PPET received £107.6m in distributions and had drawdowns totalling £96.3m.
Realisations over the six months included exits of:
- GTreasury, a provider of treasury management solutions, by Hg Mercury 4;
- Froneri, an ice cream manufacturer, by PAI Strategic Partnerships; and
- Ahlsell, a Nordic distributor of installation products, tools and supplies, by CVC Capital Partners VII.
Notable drawdowns in the period included:
- Nordic Capital XI, to fund a follow-on investment into TradingHUB, a provider of trade surveillance technology that enables financial institutions to detect market abuse and manipulation;
- Investindustrial Growth III, to fund a new investment in Virospack, a manufacturer of cosmetics droppers, serving major global brands in the cosmetics industry;
- Investindustrial VIII, to fund investment into Piovan, a company involved in the design, manufacture and installation of systems that automate the storage, transport and processing of polymers, plastic powders, and food ingredients; and
- Archimed III, to fund an investment in Dermapharm, a Danish producer of hypoallergenic, environmentally focused skincare and haircare products sold under its own brands and as private label solutions for third parties.
Commitment levels
As is illustrated in Figure 15, as of 31 March 2026, PPET had total outstanding commitments of £836.0m (although Patria estimates that £82.3m of this may never be drawn down). Balanced against that, PPET had short-term resources (cash balances, deferred consideration, and undrawn credit facilities) of £277.6m at the end of March 2026. PPET was using £140.2m of its £400m RCF at the end of March 2026, and had cash of £17.8m.
This equates to an over-commitment ratio of 44.0% (this being the value of PPET’s outstanding commitments that were in excess of its liquid assets, as a percentage of net assets). This figure has increased over time, but remains within the manager’s stated target range of 30% to 65%.
Figure 15: PPET outstanding commitments
| Date | Outstanding commitments (£m) | Outstanding commitments in excess of undrawn loan facility and resources available for investment as a % of NAV |
|---|---|---|
| September 2023 | 650.0 | 35.3 |
| September 2024 | 665.0 | 37.7 |
| September 2025 | 761.0 | 38.2 |
| March 2026 | 836.0 | 44.0 |
Source: Patria
Performance
PPET’s estimated NAV per share was 864.9p and total NAV of £1,269.5m as at 31 March 2026. According to the company, earnings growth of the underlying companies in the portfolio, both organic and inorganic, is the primary driver of PPET’s long-term NAV returns.
PPET’s five-year NAV performance appears to be ahead of the MSCI Europe Small Cap and LPX Europe indices (the LPX Europe is an index of listed private equity companies in Europe, and its returns reflect the share price returns of those companies, rather than returns based on their NAVs).
Management believes this reflects the strength of PPET’s investment process and manager selection. More than 70% of its underlying primary funds fall within the top or second quartile by TVPI and IRR. The average exit uplift across PPET’s portfolio was 41% in 2021, 20% in 2022, 18% in 2023, 26% in 2024 and 12% in 2025 compared to 12%, 3%, 2%, 1% and 2% respectively for global buyout deals.
Figure 16: Cumulative total return performance over periods ending 31 May 20261
| 3 months (%) | 6 months (%) | 1 year (%) | 3 years (%) | 5 years (%) | |
|---|---|---|---|---|---|
| PPET NAV | 4.8 | 5.5 | 12.5 | 22.4 | 68.5 |
| MSCI Europe Small Cap | 1.7 | 10.5 | 18.3 | 47.1 | 28.9 |
| PPET price | 1.0 | 1.7 | 10.5 | 54.1 | 57.9 |
| LPX Europe | (1.6) | (6.5) | (3.8) | 9.2 | (14.0) |
Source: Bloomberg, Marten & Co. Note: 1) All returns in sterling equivalent terms
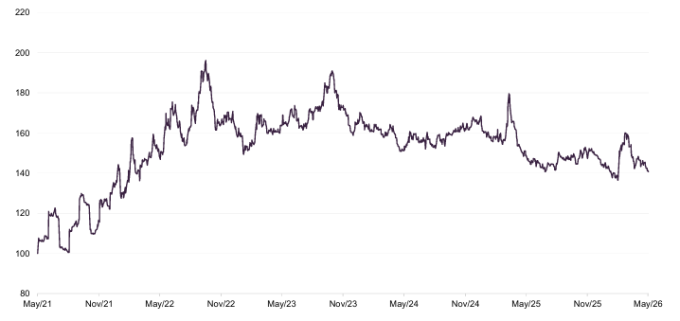
As shown in Figure 16, PPET’s NAV returns have lagged the MSCI Europe Small Cap Index over the three years to 31 May 2026. PPET’s share price increased by 54.1% over the same period, which may reflect the rebound in listed European equities following a low point after the selloff in listed equities in 2022. PPET’s NAV returns were not impacted by the selloff and therefore did not experience a similar rebound.
Figure 17: PPET NAV relative to the MSCI Europe Small Cap over five years to 31 May 2026
Source: Bloomberg, Marten & Co
Peer group
PPET is a member of the AIC’s private equity sector, which comprises 17 members. For the purpose of this analysis, the peer group has been narrowed down to the 10 companies illustrated in Figure 18.
3i Group is among those excluded, as it considers itself to be an asset manager and has investment interests extending beyond private equity. EPE Special Opportunities, JPEL Private Equity, JZ Capital Partners, and LMS Capital and Seed Innovations Limited on size grounds, making them less-relevant comparators. In addition, JPEL Private Equity and Symphony International Holdings are in wind-down mode.
PPET’s NAV total returns over the past 12 months are the highest in the peer group, following some exits (as mentioned earlier). Longer-term performance has also remained above the average, as per Figure 18, which may reflect the outcomes of its diversified approach to private equity investing.
PPET has one of the highest dividend yields in the sector and the lowest ongoing charges ratio.
Figure 18: AIC private equity sector comparison table, as at 19 June 2026
| Market cap (£m) | Premium/ (discount) (%) | Dividend yield (%) | Ongoing charge (%) | NAV TR1-year (%) | NAV TR 3-years (%) | NAV TR5-years (%) | NAV TR 10-years(%) | |
|---|---|---|---|---|---|---|---|---|
| PPET | 889 | (29.1) | 3.0 | 1.08 | 13.3 | 7.6 | 11.3 | 13.8 |
| CT Private Equity | 353 | (28.8) | 5.7 | 1.20 | 5.1 | 4.0 | 12.0 | 13.1 |
| HarbourVest Global PE | 2,357 | (23.1) | 0.0 | 2.17 | 6.7 | 4.6 | 10.2 | 14.0 |
| HgCapital | 1,810 | (25.9) | 1.3 | 1.50 | 1.1 | 5.3 | 10.8 | 16.2 |
| ICG Enterprise | 849 | (31.9) | 2.8 | 1.39 | 3.6 | 4.2 | 9.8 | 12.8 |
| Literacy Capital | 183 | (36.6) | 0.0 | 2.21 | (4.1) | 1.7 | 25.5 | – |
| NB Private Equity | 612 | (27.7) | 5.0 | 1.88 | 4.3 | 1.5 | 5.8 | 10.8 |
| Oakley Capital | 805 | (32.0) | 0.9 | 3.13 | 7.9 | 5.0 | 14.3 | 15.5 |
| Pantheon International | 1,587 | (22.5) | 0.0 | 1.35 | 3.1 | 4.2 | 8.2 | 11.4 |
| Partners Group Private Equity | 500 | (27.8) | 8.2 | 1.81 | (7.4) | (0.8) | 0.8 | 8.0 |
| Sector median | 849 | (28.8) | 1.3 | 1.50 | 4.3 | 4.2 | 10.8 | 13.5 |
| PPET rank | 4/10 | 7/10 | 4/10 | 1/10 | 1/10 | 1/10 | 4/10 | 4/9 |
Source: QuotedData webiste
Dividend
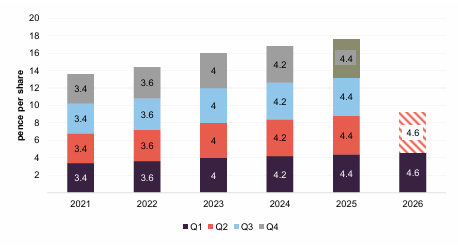
Dividend of 4.6p per quarter represents a 4.5% increase in the quarterly dividend rate year-on-year
PPET paid a total dividend of 17.6p per share for the year to 30 September 2025, which represented a 4.8% increase on the previous financial year. The trust has stated that the expected dividend for FY27 is 18.4p, which is being paid in quarterly amounts of 4.6p. The shaded bar in Figure 19 represents the likely Q2 payment which would be made in July 2026.
PPET is included in the AIC’s “next generation dividend heroes” list, as it has increased its dividend every year for more than 10 consecutive years.
Figure 19: PPET’s dividend history over financial years ending 30 September
Source: PPET
Premium/(discount)
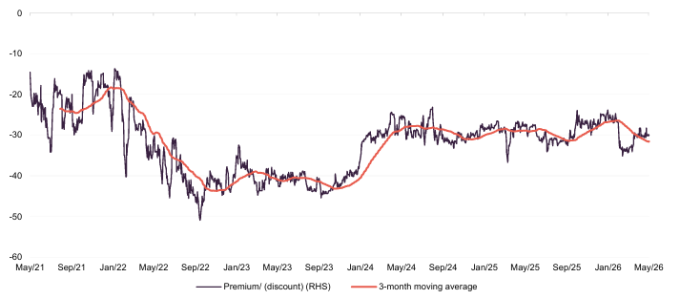
PPET’s discount has averaged 29.4% over 12 months
Over the 12 months ended 31 May 2026, PPET’s discount moved within a range of 23.8% to 35.1% and averaged 29.4%. As at 19 June 2026, the discount was 29.7%.
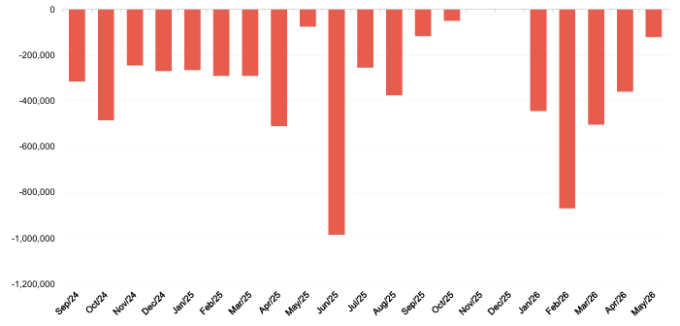
PPET’s discount appears to have stabilised since Q1 2024. In part, this may reflect the trust’s share buyback activity, which is shown in Figure 21. The discount remains wide. When the exit market picks up and NAVs rise, PPET and the rest of the sector may be re-rated.
Figure 20: PPET premium/(discount) over five years ended 31 May 2026
Source: Bloomberg, Marten & Co
Figure 21: PPET share buybacks by month
Source: PPET
Fees and costs
PPET’s investment management agreement does not include a performance fee
Under the terms of its investment management agreement with Patria, PPET pays a base management fee of 0.95% per annum of its total net assets. The investment management agreement does not include a performance-fee element and is terminable on 12 months’ notice from either side.
The total investment management fee for the year ended 30 September 2025 was £11.1m (2024: £11.4m), and the ongoing charges ratio (OCR) was 1.08%, which was slightly above the previous year.
GPMS Corporate Secretary Limited, a subsidiary of Patria, provides company secretarial services to PPET, while IQ EQ Administration Services (UK) Ltd provides administrative services. The fees for both are adjusted annually in line with the retail price index. The secretarial agreement and administrative agreement can be terminated by either side on six months’ and three months’ notice respectively.
Capital structure and life
Simple capital structure with one class of ordinary shares
PPET has a simple capital structure with one class of ordinary share in issue. Its ordinary shares have a premium main market listing on the London Stock Exchange and, as of 19 June 2026, there were 146,255,166 shares in issue with 7,491,128 held in treasury.
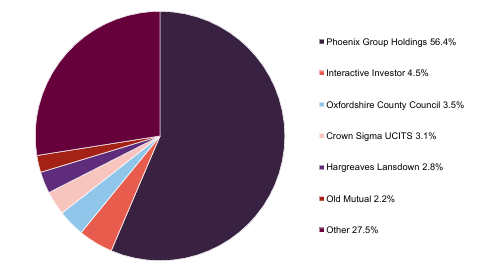
One shareholder, Phoenix Group Holdings, owns over 50% of PPET’s shares. However, under an agreement between it and the trust, it has agreed not to seek to exercise its vote, nor take actions that would prevent PPET from carrying on an independent business. The agreement is intended to protect the interests of minority shareholders.
Unlimited life
PPET has been established with an indefinite life and there is no specific mechanism, such as a regular continuation vote, to wind up the company. This structure may reflect the longer-term nature of its underlying investments.
Major shareholders
Figure 22: Major shareholders as at 19 June 2026
Source: Bloomberg, Marten & Co
Gearing
The loan facility has been increased to £400m
PPET operates with a multicurrency syndicated revolving credit facility worth up to £400m, expiring in February 2028 (with options to extend for up to a further two years). The interest rate on the facility is calculated as the defined reference rate of the currency drawn plus 2.6% and the commitment fee payable on non-utilisation is 0.8% or 0.9% per annum, depending on utilisation. An annual fee of 0.35% is also payable.
PPET has credit available to fund future investments
The facility is provided by RBS International, Societe Generale, State Street Bank International, State Street Bank & Trust Company and Banco Santander. PPET’s articles of association permit it to borrow up to 100% of net assets, although the board has stated that it does not expect bank borrowings to exceed 30% of net assets.
PPET had £259.8m remaining undrawn on its £400m revolving credit facility as at 31 March 2026, along with £17.8m in cash. As of 31 December 2025, PPET had a net gearing level of 9.6%.
PPET’s board has stated that the over-commitment ratio (outstanding commitments less resources available for investment and available debt facility/NAV) should remain within the range of 30% to 65% over the long term. PPET had an over-commitment ratio of 44.0% as of 31 March 2026.
Financial calendar
PPET’s financial year-end is 30 September. The most recent annual results were released in January, while interim results are typically released in June. The most recent AGM was held on 25 March 2026. PPET usually pays dividends in January, April, July, and October of each year.
Management
The lead manager, Alan Gauld, is a senior investment director in the private equity team at Patria. Alan is supported by Patrick Knechtli (head of secondary investments), Mark Nicolson (head of primary investments), Simon Tyszko (senior portfolio director), and Ramone Moody (investment manager). Backup is provided by the rest of Patria’s private equity team, which includes more than 30 private equity investment professionals.
Alan has a network and experience with private equity funds, particularly pan-European and French, Nordic, and Iberian GPs. He is involved in sourcing, appraising, and executing investments as well as portfolio monitoring. Alan is a qualified chartered accountant and holds a BSc (Hons) in Genetics from the University of Edinburgh.
Board
PPET’s board comprises five directors, all of whom are non-executive and are considered to be independent of the investment manager (details of their individual experience are provided below).
Duncan Budge was appointed chair of the board at PPET’s AGM in March this year, taking over from Alan Devine, who retired from the board after almost 12 years of service.
Figure 23: Board member – length of service and shareholdings
| Director | Position | Date of appointment | Length of service (years) | Annual fee (GBP) | Shareholding1 | Years of fee invested2 |
|---|---|---|---|---|---|---|
| Duncan Budge | Chair | 1 February 2025 | 1.3 | 84,460 | 15,041 | 1.1 |
| Calum Thomas | Audit committee chair and senior independent director | 30 November 2017 | 8.4 | 60,770 | 13,700 | 1.4 |
| Dugald Agble | Director | 1 September 2021 | 4.8 | 53,560 | 17,221 | 2.0 |
| Diane Seymour-Williams | Director | 7 June 2017 | 8.9 | 53,560 | 31,500 | 3.6 |
| Yvonne Stillhart | Director | 1 September 2021 | 4.8 | 53,560 | 13,718 | 1.6 |
| Average (service length, annual fee, shareholding, years of fee invested) | 5.6 | 61,182 | 18,236 | 1.9 |
Source: Patria, Marten & Co. Note 1) shareholdings as per most recent company announcements as at 29 April 2026. 2) Years of fee invested based on PPET’s ordinary share price of 608.00p as at 19 June 2026.
Duncan Budge (chair)
Duncan was an executive director and chief operating officer of RIT Capital Partners Plc between 1995 and his retirement in 2011. He has board experience and is currently a non-executive director of Lowland Investment Company Plc, Biopharma Credit Plc and Asset Value Investors Ltd. He was until recently chair of Artemis Alpha Trust Plc and Dunedin Enterprise Investment Trust Plc.
Calum Thomson (senior independent director and chair of the audit committee)
Calum is a qualified accountant with over 25 years of experience in the financial services industry. He was with Deloitte LLP since October 1988, and for 21 of those years prior to his retirement, he served as a senior audit partner in the firm. Calum is a non-executive director and the audit committee chair of the Diverse Income Trust, the AVI Global Trust Plc and Baring Emerging EMEA Opportunities Plc. He is also a non-executive director and audit committee chair of BLME Holdings Limited and Bank of London and The Middle East Plc.
Dugald Agble (independent director)
Dugald was appointed on 1 September 2021. He holds a PhD in Chemical Engineering from Imperial College London and has over 20 years’ direct investment experience in private equity. He started his career at Nomura Principal Finance Group, which later became Terra Firma Capital Partners. More recently, Dugald has been involved in investing in emerging and frontier markets at Helios Investment Partners and 8 Miles. He is a supervisory board member at FMO, the Dutch finance institution.
Diane Seymour-Williams (independent director)
Diane worked for Deutsche Asset Management Group (previously Morgan Grenfell) for 23 years from 1981 until 2005, during which time she held various senior positions, including CIO of Asian Equities, CEO of the Asian asset management business, head of European client relationships and head of global equity product. Diane then spent nine years from 2007-16 at LGM Investments, a specialist global emerging markets manager, where she was global head of relationship management at an emerging markets manager. She is a non-executive director of Baillie Gifford China Growth Trust Plc and Brooks Macdonald Group Plc, where she has chaired the remuneration committee since 2012. Diane is also a pro-bono member of the investment committees of Newnham College, Cambridge and the Canal & River Trust.
Yvonne Stillhart (independent director)
Yvonne was appointed on 1 September 2021. She was a co-founding senior partner and member of the Investment Committee of Akina AG, a Swiss-based specialised private equity manager which merged in 2017 with Unigestion S.A. Yvonne has over 30 years’ senior executive experience in business building, leadership, private equity and infrastructure investment, finance, banking and risk and investment management across a range of industries and geographical regions.
Yvonne is a non-executive director and member of the Audit and Risk committee at UBS Asset Management Switzerland Ltd., and is chairperson and member of the Social and Ethics committee of the South African EPE Capital Ltd. She holds a Director Certificate from Harvard Business School and the ESG Competent Boards Certificate. She speaks German, English, Spanish and French.
Previous publications
QuotedData has published a number of notes on PPET. These can be accessed by clicking the links in the table below or by visiting the website.
Figure 24: QuotedData’s previously published notes on PPET
| Title | Note type | Date |
|---|---|---|
| Sitting in a sweet spot | Initiation | 10 May 2016 |
| Reinvestment phase underway | Update | 14 September 2016 |
| Dividend doubled to 4.0% | Update | 22 February 2017 |
| Loading the portfolio | Update | 3 July 2017 |
| A good year; more to come? | Update | 8 December 2017 |
| Putting capital to work | Annual overview | 17 July 2018 |
| Now with direct investments | Update | 29 May 2019 |
| Share price out of sync? | Update | 15 July 2020 |
| Proving its mettle | Annual overview | 16 September 2021 |
| Laying the foundations for future returns | Update | 8 September 2022 |
| Unrecognised success | Annual overview | 8 September 2023 |
| On the way to greener pastures | Update | 10 April 2024 |
| Long-term success – near-term opportunity | Annual overview | 24 February 2025 |
| Difficult conditions make for better vintages | Update | 24 October 2025 |
Source: Marten & Co
IMPORTANT INFORMATION
Marten & Co (which is authorised and regulated by the Financial Conduct Authority) was paid to produce this note on Patria Private Equity Trust Plc.
This note is for information purposes only and is not intended to encourage the reader to deal in the security or securities mentioned within it.
Marten & Co is not authorised to give advice to retail clients. The research does not have regard to the specific investment objectives financial situation and needs of any specific person who may receive it.
The analysts who prepared this note are not constrained from dealing ahead of it but, in practice, and in accordance with our internal code of good conduct, will refrain from doing so for the period from which they first obtained the information necessary to prepare the note until one month after the note’s publication. Nevertheless, they may have an interest in any of the securities mentioned within this note.
This note has been compiled from publicly available information. This note is not directed at any person in any jurisdiction where (by reason of that person’s nationality, residence or otherwise) the publication or availability of this note is prohibited.
Accuracy of Content: Whilst Marten & Co uses reasonable efforts to obtain information from sources which we believe to be reliable and to ensure that the information in this note is up to date and accurate, we make no representation or warranty that the information contained in this note is accurate, reliable or complete. The information contained in this note is provided by Marten & Co for personal use and information purposes generally. You are solely liable for any use you may make of this information. The information is inherently subject to change without notice and may become outdated. You, therefore, should verify any information obtained from this note before you use it.
No Advice: Nothing contained in this note constitutes or should be construed to constitute investment, legal, tax or other advice.
No Representation or Warranty: No representation, warranty or guarantee of any kind, express or implied is given by Marten & Co in respect of any information contained on this note.
Exclusion of Liability: To the fullest extent allowed by law, Marten & Co shall not be liable for any direct or indirect losses, damages, costs or expenses incurred or suffered by you arising out or in connection with the access to, use of or reliance on any information contained on this note. In no circumstance shall Marten & Co and its employees have any liability for consequential or special damages.
Governing Law and Jurisdiction: These terms and conditions and all matters connected with them, are governed by the laws of England and Wales and shall be subject to the exclusive jurisdiction of the English courts. If you access this note from outside the UK, you are responsible for ensuring compliance with any local laws relating to access.
No information contained in this note shall form the basis of, or be relied upon in connection with, any offer or commitment whatsoever in any jurisdiction.
Investment Performance Information: Please remember that past performance is not necessarily a guide to the future and that the value of shares and the income from them can go down as well as up. Exchange rates may also cause the value of underlying overseas investments to go down as well as up. Marten & Co may write on companies that use gearing in a number of forms that can increase volatility and, in some cases, to a complete loss of an investment.