January
Monthly | Investment companies
Kindly sponsored by abrdn
Winners and losers in December 2025
The US central bank, the Federal Reserve, cut interest rates by 0.25% in December but the accompanying message was that the inflation outlook for 2025 was worse than earlier estimates. Investors took that to mean that there would be fewer interest rate cuts this year, US bond yields rose, stock markets fell, and the US dollar strengthened. China said it would use lower rates and government stimulus to boost its economy in 2025.
Best performing sectors in December 2024 by total price return

| Median share price total return (%) |
Median NAV total return (%) |
Median discount 31/12/24 (%) |
Median sector market cap 31/12/24 (£m) | Number of companies in the sector | |
|---|---|---|---|---|---|
| Growth capital | 12.1 | 0.0 | (35.4) | 129.0 | 7 |
| Technology & technology innovation | 4.6 | 3.3 | (9.4) | 2,857.6 | 2 |
| Environmental | 4.0 | (4.3) | (10.1) | 119.8 | 3 |
| Hedge funds | 4.0 | 0.5 | (18.2) | 91.5 | 4 |
| Leasing | 3.9 | 0.7 | (29.4) | 174.5 | 6 |
The rise in the share prices of growth capital trusts seems at odds with the economic news but stock specific factors were at work here. In the face of heightened uncertainty, investors stuck with familiar themes such as mega cap technology stocks. As we’ll discuss below, corporate actions narrowed discounts in the environmental sector. Discounts also narrowed in the hedge fund and leasing sectors.
Worst performing sectors in December 2024 by total price return

| Median share price total return (%) |
Median NAV total return (%) |
Median discount 31/12/24 (%) |
Median sector market cap 31/12/24 (£m) | Number of companies in the sector | |
|---|---|---|---|---|---|
| North American smaller companies | (8.0) | (5.9) | (5.7) | 226.5 | 2 |
| Property – UK logistics | (6.1) | 0.0 | (34.9) | 476.3 | 3 |
| Infrastructure securities | (5.6) | (6.1) | (11.9) | 103.1 | 2 |
| Commodities & natural resources | (4.9) | (6.9) | (13.5) | 63.1 | 9 |
| Biotechnology & healthcare | (2.9) | (3.0) | (12.5) | 368.9 | 6 |
The bad news on interest rates hit US small cap stocks hard, including those in the biotech sector. There was a knock-on effect on government borrowing costs across the developed world, which hit interest rate sensitive sectors such as property and infrastructure securities. Higher interest rates could also spell slower economic growth, which hit the commodities and natural resources sector. An initial positive reaction to the Chinese stimulus news fizzled out.
Best performing investment companies
Onward Opportunities benefitted from a bid for its largest holding, Windward, at a 47% premium to the prevailing share price. River UK Micro Cap was also a holder. A few of Mobius Investment Trust’s largest holdings had a good month, including Turkish travel software business Hitit Computer Services, which saw its share price jump by over 40% on the back of some contract wins. Fidelity Japan has a stake in Osaka Soda, which rose by 37% over December on the back of its Q3 earnings release. Chinese stocks did well on the back of the stimulus package announced last month. That affected other trusts in Asia, including those exposed to Vietnam.
Best performing trusts in total NAV (LHS) and share price (RHS) terms over December 2024

| Fund | Sector | (%) | Fund | Sector | (%) |
|---|---|---|---|---|---|
| Onward Opportunities | UK smaller companies | 11.6 | Alpha Real Trust | Property – debt | 57.1 |
| Mobius Investment Trust | Global emerging markets | 5.7 | Digital 9 Infrastructure | Infrastructure | 27.4 |
| Fidelity Japan Trust | Japan | 5.3 | Menhaden Resource Efficiency | Environmental | 27.2 |
| Fidelity China Special | China / greater China | 5.0 | JPMorgan Emerg E, ME & Africa Sec Plc | Global emerging markets | 21.9 |
| Scottish Oriental Smaller Cos | Asia Pacific smaller companies | 4.7 | Harmony Energy Income Trust | Renewable energy infrastructure | 18.4 |
| Schroder AsiaPacific | Asia Pacific | 4.5 | Schroders Capital Global Innov Trust | Growth capital | 14.8 |
| Vietnam Enterprise | Country specialist | 3.9 | Schiehallion Fund | Growth capital | 14.6 |
| River UK Micro Cap | UK smaller companies | 3.8 | Livermore Investments | Flexible investment | 13.7 |
| VinaCapital Vietnam Opp | Country specialist | 3.7 | Majedie Investments | Flexible investment | 12.8 |
| VietNam Holding | Country specialist | 3.7 | Onward Opportunities | UK smaller companies | 12.7 |
Looking at the share price moves, Alpha Real Trust announced that it would delist and offer shareholders a tender offer at NAV. Digital 9 Infrastructure finally announced a disposal, albeit at a discount to the carrying value of that investment. Menhaden Resource Efficiency said it would implement a managed wind down. Harmony Energy Income made encouraging noises about the sale of its portfolio. Schroders Capital Global Innovation brought forward a continuation vote, suggesting it too is headed for the exit. Schiehallion benefitted from the soaring valuation of SpaceX, its largest holding. Majedie experienced a marked narrowing of its discount, helped by some good results.
Worst performing investment companies
Geiger Counter slipped on the back of a lower uranium price. It may be that investors fear that Trump’s love of fossil fuels and laissez faire attitude to climate change will dampen enthusiasm for new nuclear plants. Golden Prospect’s NAV ought to have risen, given that not all of its subscription shares were exercised despite the subscription price being below the prevailing share price on the day. However, its small cap positions may have been hit by the sell-off mentioned above. Generally, more economically sensitive resources stocks were weak for the reasons discussed, hitting trusts such as BlackRock World Mining and CQS Natural Resources Growth and Income. BlackRock Latin America’s woes may have been compounded by the Trump win on fears of trade wars (not to mention threats of invading Panama). Renewables stocks are out of favour for the same reason. Premier Miton Global Renewables continued its slide (portfolio weakness is amplified by the gearing provided by its zero dividend preference shares). Harmony may be closer to selling off its portfolio, but its NAV is still falling – that move ought to have showed up in November’s figures. This may be a Morningstar issue.

| Fund | Sector | (%) | Fund | Sector | (%) |
|---|---|---|---|---|---|
| Geiger Counter | Commodities & natural resources | (17.7) | Ecofin US Renewables Infrastructure | Renewable energy infrastructure | (24.5) |
| Golden Prospect Precious Metal | Commodities & natural resources | (9.4) | Geiger Counter | Commodities & natural resources | (16.2) |
| BlackRock World Mining Trust | Commodities & natural resources | (9.2) | Macau Property Opportunities | Property – rest of world | (13.5) |
| Biotech Growth | Biotechnology & healthcare | (8.7) | Biotech Growth | Biotechnology & healthcare | (11.4) |
| CQS Natural Resources G&I | Commodities & natural resources | (8.3) | Middlefield Canadian Income | North America | (10.8) |
| BlackRock Latin American | Latin America | (7.7) | Literacy Capital | Private equity | (9.7) |
| Premier Miton Glb Renewables | Infrastructure securities | (7.2) | Gresham House Energy Storage | Renewable energy infrastructure | (9.1) |
| BlackRock Energy and Resources Inc | Commodities & natural resources | (6.9) | Ecofin Global Utilities & Infra | Infrastructure securities | (9.1) |
| JPMorgan US Smaller Companies | North American smaller companies | (6.8) | HydrogenOne Capital Growth | Renewable energy infrastructure | (9.0) |
| Harmony Energy Income Trust | Renewable energy infrastructure | (6.7) | Seraphim Space Investment Trust | Growth capital | (9.0) |
Ecofin US Renewables has sold part of its portfolio but for a knock-down price, investors were understandably upset by the news. Macao Property’s share price fall probably reflects frustration with the pace of its wind up. Just as Latin America is looking nervously at Trump, so too is Canada, which has been threatened with 25% tariffs and in an insult to its sovereignty described by Trump as the 51st State.
Literacy Capital’s discount has started to widen since its management fee/charitable donation changes. There was no new news on Gresham House Energy Storage, HydrogenOne, or Seraphim Space that would account for their discount widening but it may be that shares were being sold so that they wouldn’t appear in someone’s year end portfolio – a practice commonly known as ‘window dressing’.

Moves in discounts and premiums
JPMorgan Emerging Europe Middle East and Africa features regularly in this table for no good reason. All the others have been mentioned already with the exception of Regional REIT, which may also be a casualty of year end window dressing.
| Fund | Sector | Disc/ Prem 30/11/24 (%) |
Disc/ Prem 31/12/24 (%) |
Fund | Sector | Disc/ Prem 30/11/24 (%) |
Disc/ Prem 31/12/24 (%) |
|---|---|---|---|---|---|---|---|
| JPMorgan Emerg E, ME & Africa Sec Plc | Global emerging markets | 210.5 | 266.6 | Ecofin US Renewables Infrastructure | Renewable energy infrastructure | (36.5) | (52.8) |
| Alpha Real Trust | Property – debt | (39.1) | (4.7) | Literacy Capital | Private equity | (0.4) | (10.0) |
| Menhaden Resource Efficiency | Environmental | (29.9) | (12.1) | Middlefield Canadian Income | North America | (7.1) | (13.5) |
| Harmony Energy Income Trust | Renewable energy infrastructure | (42.0) | (26.5) | Seraphim Space Investment Trust | Growth capital | (36.4) | (42.1) |
| Majedie Investments | Flexible investment | (16.7) | (7.3) | Regional REIT | Property – UK commercial | (48.6) | (53.7) |

Money raised and returned
| Fund | Sector | £m raised | Fund | Sector | £m returned |
|---|---|---|---|---|---|
| JPMorgan Global Growth & Income | Global equity income | 34.3 | Scottish Mortgage | Global | (62.7) |
| JPMorgan American | North America | 5.1 | Herald | Global smaller companies | (42.7) |
| Brunner | Global | 4.2 | Blackstone Loan Financing Limited | Debt – structured finance | (42.2) |
| Golden Prospect Precious Metal | Commodities & natural resources | 2.7 | Bellevue Healthcare | Biotechnology & healthcare | (37.9) |
| TwentyFour Select Monthly Income | Debt – loans & bonds | 2.1 | Finsbury Growth & Income | UK equity income | (37.7) |
It is good to see JPMorgan American join the list of trusts issuing stock. The only other issuer of note is Golden Prospect Precious Metals, which benefitted from the exercise of its embedded subscription rights (but not by as much as hoped – around 45% of the full amount of subscription rights were exercised).
On the other side of the equation, Herald’s repurchases were much higher than normal as it looks to fight off an attack by Saba Capital. We have written a great deal about Saba’s cynical attempt to seize control of seven UK-listed investment trusts. Herald’s vote, scheduled for 22 January 2025, will be the first test of support for these trusts. If you are a shareholder, we urge you to exercise your right to vote.
Blackstone Loan Financing compulsorily redeemed 68,004,479 ordinary shares at a rate of €0.8970 per share. Bellevue continues to buy back stock in the wake of its sizeable redemption.
During the month, we said goodbye to SLF Realisation, the former SQN Asset Finance.

Major news stories and QuotedData views over November 2024
Portfolio developments
- Double digit gain for Schroder AsiaPacific
- BlackRock Frontiers extends lead over benchmark
- Lowland says UK still cheap as it outperforms
- Montanaro UK Smaller Companies hikes dividend to 6% yield
- DORE benefits from operational performance and updated power price forecasts
- Baillie Gifford European Growth optimistic despite challenges over 2024
- Underperformance the final nail for Keystone Positive Change
- abrdn Equity Income promises 25th year of dividend growth as fee cut boosts distributable revenue
- Digital 9 Infrastructure sells subsea cable investment
- Impressive returns over 2024 for Chenavari Toro Income Fund
- A satisfying year for River UK Micro Cap
- Majedie’s three core strategies added meaningfully to its total returns
- Partners Group Private Equity’s Vishal Mega Mart IPOs in India
- JPMorgan China Growth and Income held back by growth focus
- Henderson European successfully navigates tricky markets
- Ecofin US Renewables Infrastructure agrees sale of DG portfolio
- A strong year for Polar Capital Global Healthcare
- JPMorgan Indian’s quality bias weighs on performance
- JPMorgan Asia Growth & Income ups dividend to 6% per annum
- JPMorgan Japanese returns more than double the TOPIX
- Downing Renewables & Infrastructure trust realises strong gain on wind farm sale
- Utilities shine for Ecofin Global Utilities and Infrastructure, driving banner year
Corporate news
- Bellevue Healthcare to replace annual redemption with performance related tender
- Challenges continue for Finsbury Growth & Income Trust leading to continuation vote in 2026
- Caledonia seeks to clear the way for more buybacks
- Nerves grow that FCA is backtracking on cost disclosure reforms
- Menhaden Resource Efficiency throws in the towel
- Law Debenture acquires Linklaters’ process agency business
- Win for Aquila European Renewables in “The Rock” appraisal case
- ESCT – “Saba’s claims of underperformance are inaccurate”
- Chrysalis’s sale of Featurespace completes, buybacks to ramp up
- Herald says shareholders should VOTE AGAINST Saba’s resolutions
- Ed Russell becomes manager of Ecofin US Renewables Infrastructure
- More details published on Invesco Asia / Asia Dragon combination
- Trusts acknowledge Saba requisitions – aim to see off vulture investor
- Jupiter Green headed for the exit
- Invesco Perpetual UK Smaller Cos switches manager to Artemis
- Saba Capital launches campaign “to deliver value” to shareholders of seven UK-listed investment trusts
- GCP Infrastructure restarts buybacks as it eyes more disposals
- JPMorgan Emerging EMEA Securities issues new update on Russian court order
- Harmony Energy has a preferred bidder for its assets
Property news
QuotedData views
Visit www.quoteddata.com for more on these and other stories plus in-depth analysis on some funds, the tools to compare similar funds and basic information, key documents and regulatory news announcements on every investment company quoted in London.

Interviews
Have you been listening to our weekly news round-up shows? Every Friday at 11 am, we run through the more interesting bits of the week’s news, and we usually have a special guest or two answering questions about a particular investment company.
Research
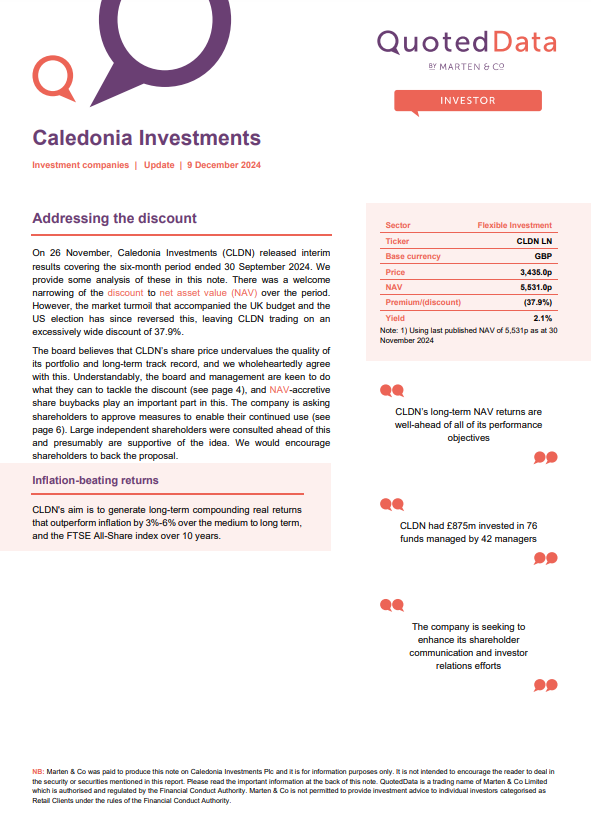
On 26 November, Caledonia Investments (CLDN) released interim results covering the six-month period ended 30 September 2024. We provide some analysis of these in this note. There was a notable narrowing of the discount over the period. However, the market turmoil that accompanied the UK budget and the US election has since reversed this, leaving CLDN trading on an excessively wide discount of 37.9%.
The board believes that CLDN’s share price undervalues the quality of its portfolio and long-term track record. The board and management are keen to do what they can to tackle the discount (see page 3) and say that NAV-accretive share buybacks play an important part in this. The company is therefore asking shareholders to approve measures to facilitate their continued use (see page 5).
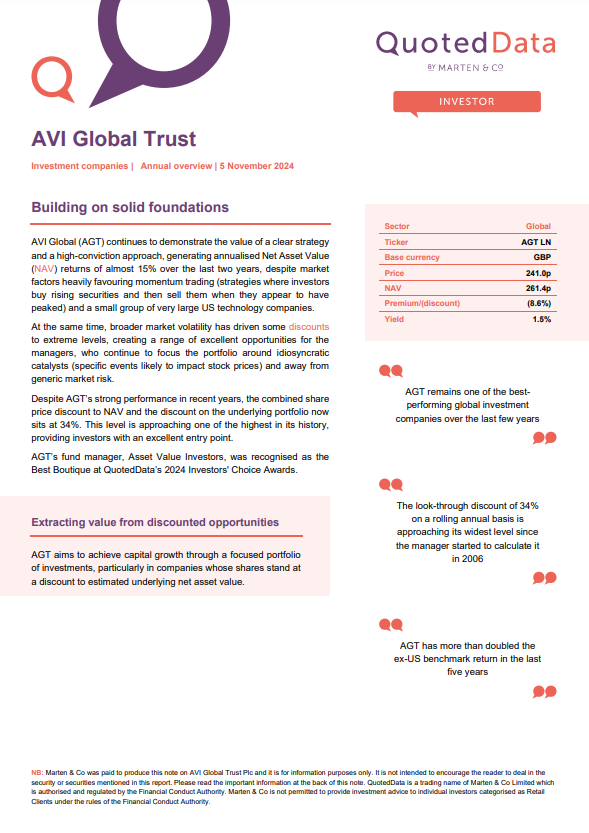
AVI Global (AGT) continues to demonstrate the value of a clear strategy and a high-conviction approach, generating annualised Net Asset Value (NAV) returns of almost 15% over the last two years, despite market factors heavily favouring momentum trading (strategies where investors buy rising securities and then sell them when they appear to have peaked) and a small group of very large US technology companies.
At the same time, broader market volatility has driven some discounts to extreme levels, creating a range of excellent opportunities for the managers, who continue to focus the portfolio around idiosyncratic catalysts (specific events likely to impact stock prices) and away from generic market risk.
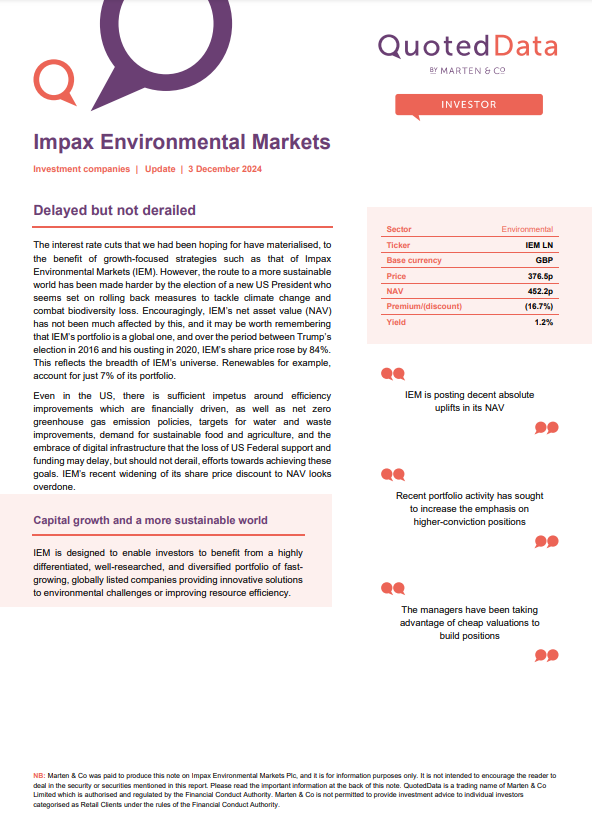
The interest rate cuts that we had been hoping for have materialised, to the benefit of growth-focused strategies such as that of Impax Environmental Markets (IEM). However, the route to a more sustainable world has been made harder by the election of a new US President who seems set on rolling back measures to tackle climate change and combat biodiversity loss. Encouragingly, IEM’s net asset value (NAV) has not been much affected by this, and it may be worth remembering that IEM’s portfolio is a global one, and over the period between Trump’s election in 2016 and his ousting in 2020, IEM’s share price rose by 84%. This reflects the breadth of IEM’s universe. Renewables for example, account for just 7% of its portfolio.
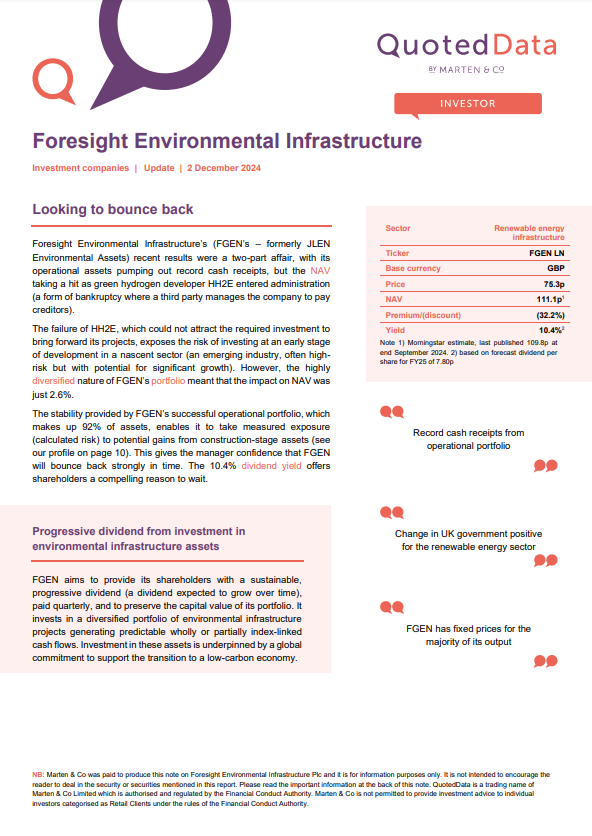
Foresight Environmental Infrastructure’s (FGEN’s – formerly JLEN Environmental Assets) recent results were a two-part affair, with its operational assets pumping out record cash receipts, but the NAV taking a hit as green hydrogen developer HH2E entered administration (a form of bankruptcy where a third party manages the company to pay creditors).
The failure of HH2E, which could not attract the required investment to bring forward its projects, exposes the risk of investing at an early stage of development in a nascent sector. However, the highly diversified nature of FGEN’s portfolio meant that the impact on NAV was just 2.6%.
The stability provided by FGEN’s successful operational portfolio, which makes up 92% of assets, enables it to take measured exposure (calculated risk) to potential gains from construction-stage assets (see our profile on page 10). This gives the manager confidence that FGEN will bounce back strongly in time.
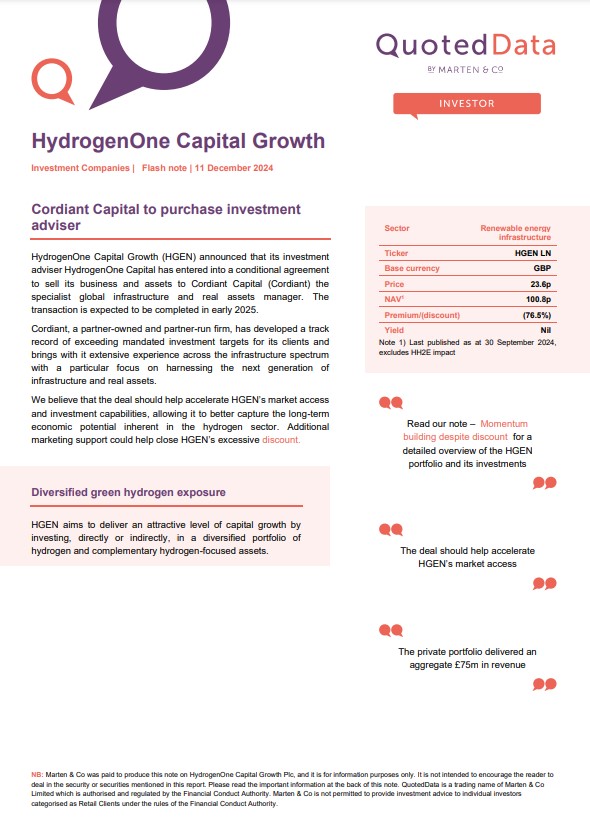
HydrogenOne Capital Growth (HGEN) announced that its investment adviser Hydr
ogenOne Capital has entered into a conditional agreement to sell its business and assets to Cordiant Capital (Cordiant) the specialist global infrastructure and real assets manager. The transaction is expected to be completed in early 2025.
Cordiant, a partner-owned and partner-run firm, has developed a track record of exceeding mandated investment targets for its clients and brings with it extensive experience across the infrastructure spectrum with a particular focus on harnessing the next generation of infrastructure and real assets.
We believe that the deal should help accelerate HGEN’s market access and investment capabilities, allowing it to better capture the long-term economic potential inherent in the hydrogen sector. Additional marketing support could help close HGEN’s excessive discount.
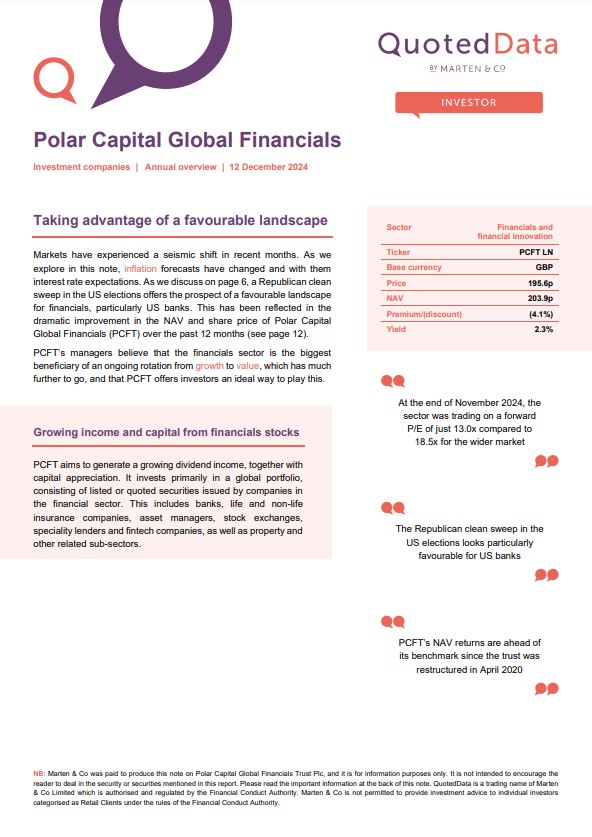
Markets have experienced a seismic shift in recent months. As we explore in this note, inflation forecasts have changed and with them interest rate expectations. As we discuss on page 6, a Republican clean sweep in the US elections offers the prospect of a favourable landscape for financials, particularly US banks. This has been reflected in the dramatic improvement in the NAV and share price of Polar Capital Global Financials (PCFT) over the past 12 months (see page 12).
PCFT’s managers believe that the financials sector is the biggest beneficiary of an ongoing rotation from growth to value, which has much further to go, and that PCFT offers investors an ideal way to play this.
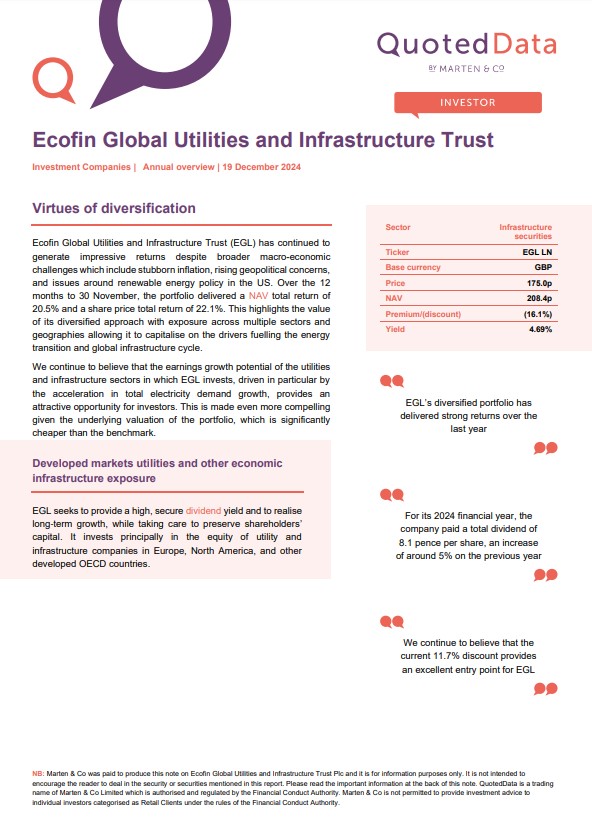
Ecofin Global Utilities and Infrastructure Trust (EGL) has continued to generate impressive returns despite broader macro-economic challenges which include stubborn inflation, rising geopolitical concerns, and issues around renewable energy policy in the US. Over the 12 months to 30 November, the portfolio delivered a NAV total return of 20.5% and a share price total return of 22.1%. This highlights the value of its diversified approach with exposure across multiple sectors and geographies allowing it to capitalise on the drivers fuelling the energy transition and global infrastructure cycle.
We continue to believe that the earnings growth potential of the utilities and infrastructure sectors in which EGL invests, driven in particular by the acceleration in total electricity demand growth, provides an attractive opportunity for investors.
This is made even more compelling given the underlying valuation of the portfolio, which is significantly cheaper than the benchmark.

Upcoming events
Here is a selection of what is coming up. Please refer to the Events section of our website for updates between now and when they are scheduled:
- Martin Currie Global Portfolio AGM 2025
- QuotedData’s weekly news show – Alexander Darwall from European Opportunities Trust
- Taylor Maritime Investments AGM 2025
- Ecofin US Renewables Infrastructure AGM 2025
- Blackstone Loan Financing AGM 2025
- Invesco Asia Trust AGM 2025
- Smithson Investment Trust AGM 2025
- JPMorgan Japanese AGM 2025
- Barings Emerging EMEA Opportunities AGM 2025
- BlackRock American Income AGM 2025
- JPMorgan China Growth & Income AGM 2025
- QuotedData’s weekly news show – Joe Bauernfreund from AVI Global Trust
- Keystone Positive Change AGM 2025
- Finsbury Growth & Income Trust AGM 2025
- Lowland Investment Company AGM 2025
- Henderson European Trust AGM 2025
- Schroder AsiaPacific Fund AGM 2025
- Scottish Mortgage Investment Trust AGM 2025
- Scottish Oriental Smaller Companies AGM 2025
- QuotedData’s weekly news show – Douglas Brodie from Edinburgh Worldwide
Guide

Our independent guide to quoted investment companies is an invaluable tool for anyone who wants to brush up on their knowledge of the investment companies’ sector. Please register on www.quoteddata.com if you would like it emailed to you directly.
Appendix 1 – median performance by sector, ranked by 2024 year to date price total return
| YTD Rank |
Sector | Share price total return YTD (%) | NAV total return YTD (%) |
Discount 30/12/24 (%) |
Discount 30/11/24 (%) |
Change in discount (%) |
Median mkt cap 30/12/24 (£m) |
|---|---|---|---|---|---|---|---|
| 1 | Growth capital | 39.0 | 0.0 | (35.4) | (32.1) | (3.3) | 129.0 |
| 2 | Technology & technology innovation | 36.2 | 35.9 | (9.4) | (10.5) | 1.1 | 2,857.6 |
| 3 | Leasing | 32.3 | 17.9 | (29.4) | (30.2) | 0.8 | 174.5 |
| 4 | Debt – structured finance | 31.2 | 10.8 | (17.6) | (14.5) | (3.1) | 175.0 |
| 5 | North America | 18.3 | 15.3 | (9.5) | (7.6) | (1.9) | 607.2 |
| 6 | Insurance & reinsurance strategies | 17.6 | 6.0 | (19.6) | (14.2) | (5.4) | 67.1 |
| 7 | India/indian subcontinent | 17.5 | 19.7 | (12.0) | (14.4) | 2.4 | 447.1 |
| 8 | Japanese smaller companies | 16.8 | 14.5 | (3.0) | (6.0) | 3.1 | 317.1 |
| 9 | Environmental | 16.4 | 0.9 | (10.1) | (16.7) | 6.7 | 119.8 |
| 10 | Debt – loans & bonds | 15.5 | 8.5 | 0.2 | (2.3) | 2.6 | 142.2 |
| 11 | Global emerging markets | 15.4 | 12.8 | (12.8) | (13.0) | 0.2 | 300.0 |
| 12 | Asia Pacific equity income | 15.3 | 12.7 | (9.3) | (8.4) | (0.9) | 330.7 |
| 13 | Global | 14.7 | 11.2 | (8.0) | (8.2) | 0.2 | 853.3 |
| 14 | Financials & financial innovation | 13.9 | 14.2 | (20.1) | (23.1) | 2.9 | 379.7 |
| 15 | North American smaller companies | 13.5 | 8.7 | (5.7) | (3.6) | (2.1) | 226.5 |
| 16 | Asia Pacific smaller companies | 13.1 | 16.8 | (15.8) | (16.3) | 0.5 | 352.8 |
| 17 | Hedge funds | 12.6 | 7.3 | (18.2) | (23.3) | 5.1 | 91.5 |
| 18 | Global smaller companies | 12.2 | 7.1 | (9.1) | (10.9) | 1.9 | 751.8 |
| 19 | Asia Pacific | 11.9 | 13.8 | (12.0) | (11.5) | (0.5) | 516.0 |
| 20 | UK all companies | 11.1 | 9.4 | (10.1) | (11.8) | 1.7 | 254.5 |
| 21 | UK equity & bond income | 10.8 | 9.2 | (7.0) | (9.0) | 2.0 | 279.7 |
| 22 | UK equity income | 10.6 | 9.2 | (6.9) | (8.4) | 1.6 | 370.3 |
| 23 | Global equity income | 9.7 | 9.1 | (8.7) | (8.5) | (0.2) | 320.4 |
| 24 | China / greater China | 8.6 | 15.4 | (12.9) | (13.8) | 0.9 | 186.8 |
| 25 | Japan | 8.4 | 13.3 | (13.1) | (12.9) | (0.2) | 295.4 |
| 26 | Debt – direct lending | 8.1 | 2.8 | (16.5) | (17.3) | 0.8 | 77.8 |
| 27 | Country specialist | 7.9 | 13.6 | (12.2) | (12.5) | 0.3 | 383.6 |
| 28 | UK smaller companies | 6.7 | 7.5 | (11.5) | (12.8) | 1.3 | 105.8 |
| 29 | Flexible investment | 6.6 | 5.4 | (20.0) | (22.7) | 2.7 | 102.5 |
| 30 | Property – debt | 6.4 | (0.1) | (11.2) | (22.8) | 11.6 | 73.7 |
| 31 | European smaller companies | 6.2 | 0.4 | (10.7) | (13.0) | 2.3 | 405.4 |
| 32 | Property – uk commercial | 5.6 | 4.1 | (22.6) | (18.4) | (4.3) | 146.0 |
| 33 | Commodities & natural resources | 3.2 | (2.4) | (13.5) | (15.1) | 1.6 | 63.1 |
| YTD Rank |
Sector | Share price total return YTD (%) | NAV total return YTD (%) |
Discount 30/11/2024 (%) |
Discount 29/11/24 (%) |
Change in discount (%) |
Median mkt cap 30/12/24 (£m) |
|---|---|---|---|---|---|---|---|
| 34 | Private equity | 2.8 | 1.4 | (31.4) | (32.8) | 1.3 | 480.4 |
| 35 | Property – UK residential | 1.3 | (0.7) | (41.9) | (40.8) | (1.1) | 171.1 |
| 36 | Property – UK healthcare | 1.1 | 10.0 | (29.6) | (29.2) | (0.5) | 428.9 |
| 37 | Infrastructure | 0.4 | 6.7 | (21.7) | (21.7) | (0.1) | 890.7 |
| 38 | Property – Europe | (0.3) | (8.4) | (38.1) | (33.4) | (4.7) | 198.9 |
| 39 | Europe | (1.3) | (0.2) | (10.0) | (12.4) | 2.4 | 512.5 |
| 40 | Biotechnology & healthcare | (1.6) | 3.2 | (12.5) | (12.9) | 0.4 | 368.9 |
| 41 | Infrastructure securities | (4.6) | (7.0) | (11.9) | (12.3) | 0.4 | 103.1 |
| 42 | Property – UK logistics | (14.1) | 3.5 | (34.9) | (30.3) | (4.6) | 476.3 |
| 43 | Renewable energy infrastructure | (17.1) | 0.6 | (34.6) | (34.0) | (0.5) | 261.2 |
| 44 | Property – rest of world | (22.6) | (15.7) | (68.1) | (68.1) | 0.0 | 15.5 |
| 45 | Latin America | (34.1) | (35.2) | (11.6) | (13.3) | 1.7 | 81.9 |
MEDIAN |
9.7 | 7.5 | (12.5) | (13.8) | 0.5 | 279.7 |
IMPORTANT INFORMATION
This note was prepared by Marten & Co (which is authorised and regulated by the Financial Conduct Authority).
This note is for information purposes only and is not intended to encourage the reader to deal in the security or securities mentioned within it. Marten & Co is not authorised to give advice to retail clients. The note does not have regard to the specific investment objectives, financial situation and needs of any specific person who may receive it.
Marten & Co may have or may be seeking a contractual relationship with any of the securities mentioned within the note for activities including the provision of sponsored research, investor access or fundraising services.
This note has been compiled from publicly available information. This note is not directed at any person in any jurisdiction where (by reason of that person’s nationality, residence or otherwise) the publication or availability of this note is prohibited.
Accuracy of Content: Whilst Marten & Co uses reasonable efforts to obtain information from sources which we believe to be reliable and to ensure that the information in this note is up to date and accurate, we make no representation or warranty that the information contained in this note is accurate, reliable or complete. The information contained in this note is provided by Marten & Co for personal use and information purposes generally. You are solely liable for any use you may make of this information. The information is inherently subject to change without notice and may become outdated. You, therefore, should verify any information obtained from this note before you use it.
No Advice: Nothing contained in this note constitutes or should be construed to constitute investment, legal, tax or other advice.
No Representation or Warranty: No representation, warranty or guarantee of any kind, express or implied is given by Marten & Co in respect of any information contained in this note.
Exclusion of Liability: To the fullest extent allowed by law, Marten & Co shall not be liable for any direct or indirect losses, damages, costs or expenses incurred or suffered by you arising out or in connection with the access to, use of or reliance on any information contained in this note. In no circumstance shall Marten & Co and its employees have any liability for consequential or special damages.
Governing Law and Jurisdiction: These terms and conditions and all matters connected with them, are governed by the laws of England and Wales and shall be subject to the exclusive jurisdiction of the English courts. If you access this note from outside the UK, you are responsible for ensuring compliance with any local laws relating to access.
No information contained in this note shall form the basis of, or be relied upon in connection with, any offer or commitment whatsoever in any jurisdiction.
Investment Performance Information: Please remember that past performance is not necessarily a guide to the future and that the value of shares and the income from them can go down as well as up. Exchange rates may also cause the value of underlying overseas investments to go down as well as up. Marten & Co may write on companies that use gearing in a number of forms that can increase volatility and, in some cases, to a complete loss of an investment.
