An entry as well as an exit opportunity
The financials sector is too big to ignore, yet too complex for most investors to cover effectively. Fortunately, Polar Capital Global Financials Trust (PCFT) makes an ideal subcontract. Its attractions are amplified by its structure, which provides shareholders with regular exit opportunities (chances for investors to redeem their shares at or close to NAV), one of which is on the table now. It is a chance for institutional investors to buy stock in size too, and we think there are good reasons to do so.
The financials sector is in good shape, having had a run of good performance (outperforming the broader market in four of the last five years). Importantly, those returns have been driven by earnings growth rather than valuation multiple expansion (generating more profit rather than just trading at higher prices), which means that the sector still looks cheap relative to history and the wider market. In addition, it looks as though that earnings growth could persist; perhaps even accelerate. PCFT has beaten its benchmark over the last five years, and we would back it to do so again over the next five years.
Growing income and capital from financials stocks
PCFT aims to generate a growing dividend income, together with capital appreciation. It invests primarily in a global portfolio, consisting of listed or quoted securities issued by companies in the financial sector. This includes banks, life and non-life insurance companies, asset managers, stock exchanges, speciality lenders, and fintech companies, as well as property and other related sub-sectors.
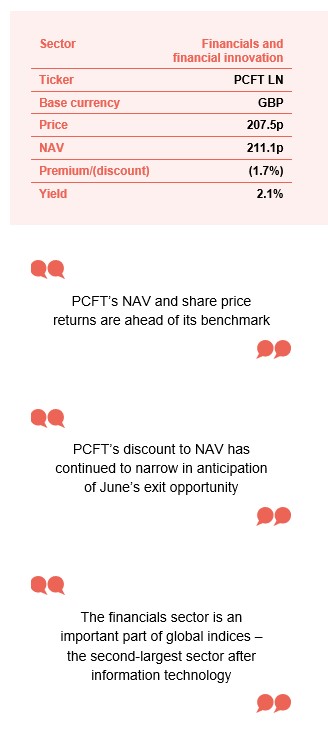
At a glance
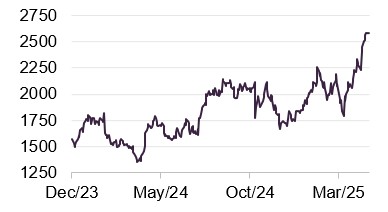
Share price and discount
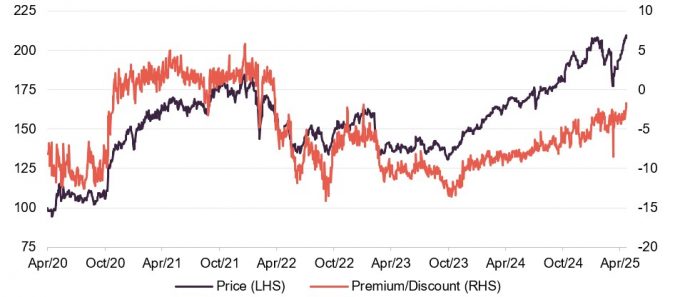
Over the 12 months ended 30 April 2025, PCFT’s discount to net asset value (NAV) moved within a range of 2.4% to 9.2% and averaged 6.2%. At 21 May 2025, PCFT was trading on a discount of 1.7%.
PCFT’s discount has continued to narrow in anticipation of June’s exit opportunity. The odd spike in the discount reflects periods of market volatility.
Time period 30 April 2020 to 21 May 2025
Source: Morningstar, Marten & Co
Share price and discount
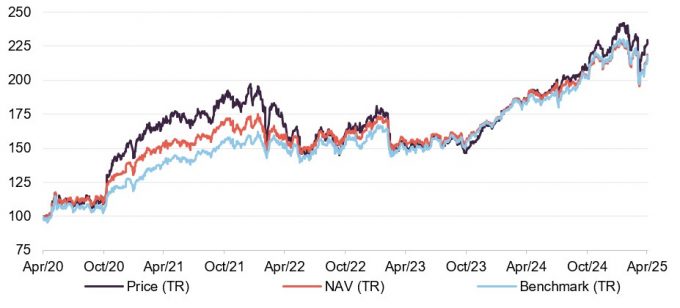
Figure 11 shows the trust’s NAV and share price total returns alongside those of the MSCI All Countries World Financial Index for the period from reconstruction on 22 April 2020 to the end of April 2025. The drivers of PCFT’s historic performance have been covered in our previous notes, a list of which is provided on page 14.
Time period 30 April 2020 to 30 April 2025
Source: Morningstar, Marten & Co
| Year ended | Share price total return (%) | NAV total return (%) | MSCI ACWI Financials total return (%) | MSCI ACWI total return (%) |
|---|---|---|---|---|
| 30/04/2021 | 70.3 | 53.0 | 39.7 | 32.8 |
| 30/04/2022 | (2.7) | 2.4 | 7.4 | 4.3 |
| 30/04/2023 | (7.2) | (0.3) | 0.4 | 1.9 |
| 30/04/2024 | 20.9 | 18.6 | 20.9 | 17.9 |
| 30/04/2025 | 21.7 | 15.8 | 17.6 | 4.8 |
A new lease of life
Five-yearly tender opportunity
This note is being published following of the publication of a circular that will provide details of PCFT’s latest 100% tender offer. At QuotedData, we are fans of this structure. We believe that, by offering these at five-yearly intervals, investors are encouraged to exercise patience and consider PCFT’s long-term total return potential rather than a narrow focus on the discount to NAV. As we show on page 13, history demonstrates that the tender offers have helped to keep the trust’s shares trading fairly close to NAV.
Institutional investors can use this opportunity to buy stock
Shares that are tendered will be available for purchase through a placing to institutional clients of Stifel (PCFT’s broker) at 100.5% of the tender price. Any shares not placed will be bought back into treasury (shares held by the company which can be reissued) and may be reissued if the trust trades at a sustained premium to NAV.
The board has considered the long-term strategic direction of PCFT and its structure
The board uses these opportunities to consider the long-term strategic direction of the company and its structure. On this occasion, the board sees no reason to change an investment strategy and a manager that has delivered outperformance of PCFT’s benchmark since the last tender offer. Nor will it change the trust’s 20% maximum gearing policy. However, in conjunction with the upcoming tender, it has made some changes that are designed to enhance the appeal of the trust.
Lower fees
Fees:
- A new tiered management fee is being introduced with effect from 1 July 2025. The existing flat fee of 0.7% per annum will continue to apply on the first £500m, but the fee on the balance will be charged at a lower rate of 0.65%. At the time of publication, PCFT had net assets of £649m.
- In addition, rather than calculating the fee as a percentage of NAV, going forward, half the fee will be based on NAV and half on the lower of market capitalisation and NAV (providing the manager with some incentive to keep the discount tight).
- The performance fee element of the fee structure will be completely removed (meaning the manager will no longer receive a bonus for outperforming a benchmark).
Higher dividends
Dividends:
Currently, PCFT has a dividend yield of 2.1%. The board proposed and shareholders have approved the adoption of an enhanced dividend policy, using distributable reserves (accumulated profits that can legally be paid out as dividends) to top up PCFT’s revenue account so that it can pay quarterly dividends of 1% of NAV (approximately 4% of NAV per annum). The new policy will take effect for the financial year commencing 1 December 2025.
The policy reflects the trend towards companies prioritising share buybacks over dividends in some markets. In addition, with less reliance on generating income to distribute, the managers will have greater freedom to focus on maximising total returns for shareholders.
New discount control policy
Discount:
If, under normal market conditions: (i) PCFT’s three-month average discount to NAV is greater than 5%, and (ii) the discount to NAV is currently greater than 5%, PCFT will buy back shares with the intention of reducing the discount to NAV to a level of no greater than 5%.
A compelling opportunity
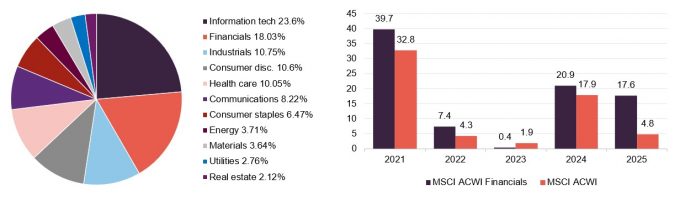
Financials is the second-largest sector after IT
The financials sector is an important part of global indices – the second-largest sector after information technology – and in recent years it has been an important driver of market returns, outperforming the wider global MSCI All Countries World Index (MSCI ACWI) in four of the last five 12-month periods ending 30 April.
When PCFT was launched in July 2013, the key marketing message was around the potential for a recovery in the sector’s fortunes five years on from the disruption caused by the global financial crisis. Seven years later, when shareholders were first given an exit opportunity, any nascent recovery had been choked off by the panic created by the COVID pandemic. Shareholders who ran for the exit may have been left red-faced as the sector soared later that year.
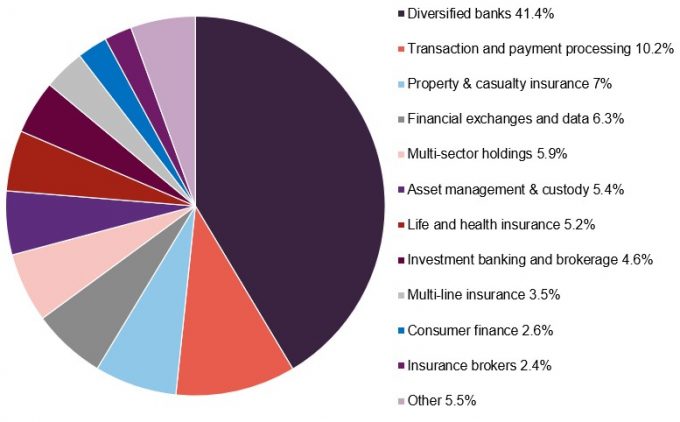
Figure 1: MSCI ACWI sector split as at 30 April 2025
Figure 2: Total returns for periods ending 30 April 2025
Source: Morningstar, Marten & Co
Source: MSCI
Some readers might be surprised of the extent of financials’ outperformance since the last tender offer, especially given that for a couple of years now the market has been fixated on US mega-cap technology businesses seen as plays on artificial intelligence (AI). PCFT’s managers point out that the financials sector should be a big beneficiary of AI. The potential for banks and insurers to exploit this technology to cut costs is considerable, for example. However, recent market volatility associated with Trump’s tariff policy seems to have spurred the debate about the risks of having too many eggs in the AI basket (i.e., being overexposed to a single theme or sector), and that should allow for a broadening of returns and diversion of funds into other sectors such as financials.
A diverse sector
The financials sector covers a diverse set of companies, some of which have quite complex business models and regulatory environments. It makes sense to outsource the job of stock selection to a team of experts, and we believe that the Polar Capital team (as detailed in our last note – or here on the trust’s website) is well-placed to do the job for you.
Figure 3: MSCI ACWI Financials sector split as at 30 April 2025
Source: MSCI
Markets have been volatile in recent months and the sector has not been immune to this. However, the managers used this volatility to build positions in some stocks that they have liked for a while but ahead of the selloff (a rapid and widespread selling of securities, which leads to a sharp decline in their prices) looked fully valued. We discuss recent portfolio changes from page 8 onwards.
Currently, the managers are positive on the outlook for the following:
Trading platforms, data and exchanges were about 16% of the portfolio at end April 2025
- Trading platforms, which are beneficiaries of market volatility, the general shift from defined benefit to defined contribution pension schemes, the growth in cryptocurrencies, and greater appetite for short-term trading strategies.
Examples include flatexDEGIRO (see page 11) and Interactive Brokers.
- Data and exchanges, where market volatility is helpful in terms of driving volumes, but where the managers believe the greater opportunity is in monetising the data the platforms hold.
Examples include Nasdaq and Intercontinental Exchange (see page 9).
- European banks (13% of the portfolio), where the managers are confident that interest rates will not fall to levels that would put pressure on net interest margins (narrower spreads between lending and deposit rates), but where valuations are attractive, balance sheets are strong, and governments are keen to incentivise economic (and by association loan) growth.
Examples include Barclays, the Italian fintech bank Fineco, and Greece’s Alpha Bank.
- Property & casualty insurance (15% of the portfolio), where rising threats from risks such as climate change are helping to keep margins high.
Examples include Beazley, Swiss Re (see page 8), and Gallagher.
- Payments businesses, as electronic payments continue to take share from cash payments.
The managers are happy to have selective exposure to:
- US banks (16% of the portfolio), where there is hope that regulatory burdens on the sector will be eased, and where the managers think provisions against loan books are sensible (banks appear to be factoring in the potential for US unemployment rates of 5-6%), but where valuations are higher than in other markets.
Examples include Goldman Sachs, First Horizon, and BNY Mellon.
- Alternative asset managers, which was an area that PCFT had an overweight exposure to until the turn of the year that was reduced earlier this year on valuation grounds and has fallen further since as investors have fretted about a more difficult environment for exits.
The managers are more cautious on the outlook for life insurance and traditional asset managers.
One other theme that runs across the various subsectors is the attraction of the structural growth within emerging markets as consumers in these countries make greater use of financial services (this accounts for about 16% of the portfolio).
Examples include MercadoLibre (see page 11), Nubank, and Indian non-bank finance company Shriram Finance.
Portfolio – asset allocation
At the end of April 2025, there were 77 positions in PCFT’s portfolio, down from 90 at the end of October 2024. Relative to the benchmark MSCI ACWI Financials Index, PCFT’s active share at 30 April 2025 was 68.2%.
Figure 4: PCFT geographic exposure as at 30 April 2025
Figure 5: PCFT sector exposure as at 30 April 2025
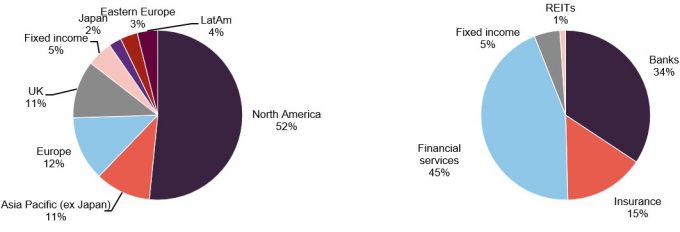
Source: Polar Capital Global Financials Trust
Source: Polar Capital Global Financials Trust
Since we last published (using data as at 31 October 2024), PCFT has reintroduced some exposure to Eastern Europe and Latin America. This has been funded largely by a further reduction in fixed interest exposure (investments in debt instruments such as bonds that pay a fixed return), which will likely continue when the managers are freed up from the need to generate revenue to cover the dividend (as highlighted on page 4). At the same time, the allocation to financial services has risen, funded by a reduction in the exposure to insurance (although a large part of that reflects a switch into Berkshire Hathaway, which has significant exposure to the insurance and reinsurance sectors but is classified within financial services).
Top 10 holdings
Figure 6: Top 10 holdings as at 30 April 2025
| Country/region | Subsector | 30/04/2025(%) | 31/10/2024(%) | Change(%) | |
|---|---|---|---|---|---|
| JPMorgan | United States | Banks | 6.2 | 6.6 | (0.4) |
| Mastercard | United States | Financial services (payments) | 4.8 | 4.5 | 0.3 |
| Berkshire Hathaway | United States | Financial services (insurance) | 4.4 | n/a | n/a |
| Visa | United States | Financial services (payments) | 3.8 | 2.8 | 1.0 |
| Bank of America | United States | Banks | 3.3 | 3.9 | (0.6) |
| UniCredit | Italy | Banks | 2.5 | 2.6 | (0.1) |
| Barclays | United Kingdom | Banks | 2.4 | 1.9 | 0.5 |
| Swiss Re | Switzerland | Insurance | 2.3 | n/a | n/a |
| Intercontinental Exchange | United States | Financial services (exchange) | 2.2 | 1.8 | 0.4 |
| Progressive Corp | United States | Insurance | 2.0 | 1.8 | 0.2 |
| Total | 33.9 |
Since we last published (using data as at end October 2024), Fidelity National Information, Nasdaq, ICICI Bank, and Erste Group Bank have dropped out of the top 10 holdings, to be replaced by Berkshire Hathaway, Swiss Re, Intercontinental Exchange, and Progressive.
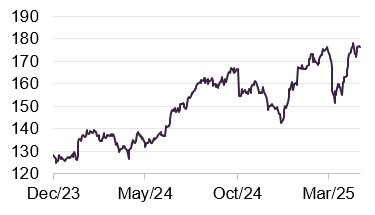
Berkshire Hathaway
Figure 7: Berkshire Hathaway (USD)
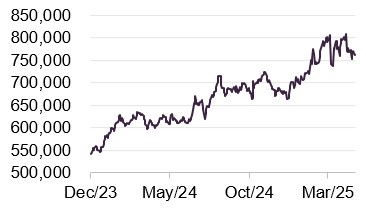
Source: Bloomberg
Berkshire Hathaway (berkshirehathaway.com) has been in the news as Warren Buffett has announced that he will step down as CEO at the end of the year, after more than 60 years at the helm. We discussed the company in our June 2024 note, but to recap, it is the largest stock in PCFT’s benchmark (accounting for 5.1% of it at the end of April 2025, although relative to the benchmark PCFT is still underweight). Sometimes described as a conglomerate, the company’s 189 subsidiaries span insurance and reinsurance, rail freight, utilities and energy, manufacturing services and retailing, as well as an investment portfolio with stakes in many other companies.
Rising cash and short-dated Treasury holdings (safe, liquid government debt) have cushioned the impact of market volatility. The shares did fall back by about 5% on news of Buffett’s retirement, but have still done well over the past year helped by good returns from the company’s insurance and reinsurance activities.
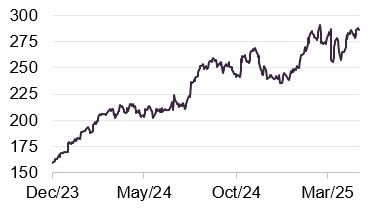
Swiss Re
Figure 8: Swiss Re (CHF)
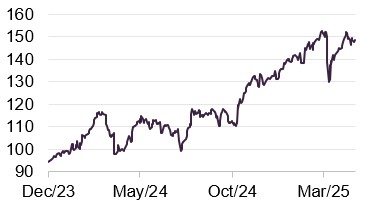
Source: Bloomberg
Swiss Re (swissre.com) is a leading wholesale provider of reinsurance and insurance, across property & casualty, life & health, and corporate solutions. It can boast a strong balance sheet (scoring 254% on the Swiss Solvency Test, against an internal target of 200–250%) and has ambitions to be the leading player in its field. It is expected to announce a new long-term strategy in the second half of this year.
Quarterly results for the first quarter of 2025 were good, with net income of $1.3bn and an ROE of 22.4% (up from $1.1bn and 20.7% for the same quarter last year). The result was achieved despite significant large loss events in its property and casualty businesses including the wildfires in Los Angeles. Concerns about the increased incidence of events such as this are helping to keep the sector profitable.
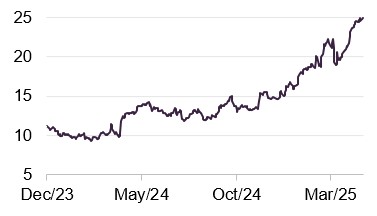
Intercontinental Exchange
Figure 9: Intercontinental Exchange (USD)
Source: Bloomberg
Intercontinental Exchange (ice.com) operates a number of exchanges – covering areas such as equities (including the New York Stock Exchange), interest rates, forex, metals, agricultural goods, energy, and credit – in Europe, US, Singapore, and Abu Dhabi. It also offers clearing services, indices, derivatives, trading applications, and access to data.
ICE’s first quarter 2025 figures showed year-on-year revenue growth of 8%, and around half of revenues were recurring (predictable and ongoing, such as subscription or licence fees). That revenue growth translated not earnings per share (EPS) growth of 16%. That extends an unbroken track record of year-on-year EPS growth that stretches back to 2006 and has compounded at an average of 15% per annum.
Progressive
Figure 10: Progressive (USD)
Source: Bloomberg
Progressive (progressive.com) is primarily an automotive insurance company but also offers home insurance and life insurance products.
Its first quarter 2025 figures showed a 17% year-on-year increase in net premiums written and a 10% uplift in net income. Its underwriting margins have been growing strongly recently. That is feeding through into a stronger balance sheet, with the book value per common share (an indicator of shareholder equity on a per-share basis) standing at $49.39 at end March 2025, up from $26.32 in December 2022.
Performance
Figure 11 shows the trust’s NAV and share price total returns alongside those of the MSCI All Countries World Financial Index for the period from reconstruction on 22 April 2020 to the end of April 2025. The drivers of PCFT’s historic performance have been covered in our previous notes, a list of which is provided on page 14.
Markets have been more volatile over recent months, largely as a consequence of Trump’s trade policies (which have introduced uncertainty around tariffs and global supply chains).
Polar Capital shared some performance attribution data with us which covers the first four months of 2025. Over that period, the trust outperformed by 0.6%. The main drivers of this are shown in Figures 13 and 16.
Figure 11: PCFT NAV, share price, and MSCI ACWI Financials from 22 April 2020 to 30 April 2025
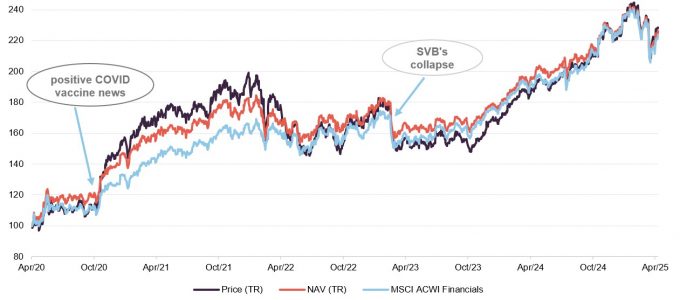
Source: Morningstar, Marten & Co
As Figure 12 shows, PCFT’s NAV and share price returns are ahead of its benchmark since the trust was restructured in April 2020. The sector has also markedly outperformed the wider global index over that period. The managers believe that the outperformance of the financials sector has much further to go.
Figure 12: Cumulative total return performance over periods ending 30 April 2025
| 3 months (%) | 6 months (%) | 1 year (%) | 3 years (%) | 5 years (%) | Since 22 April 20201 (%) | Since launch2 (%) | |
|---|---|---|---|---|---|---|---|
| PCFT price | (5.3) | 8.3 | 21.7 | 36.5 | 126.1 | 128.4 | 173.1 |
| PCFT NAV | (5.0) | 5.9 | 15.8 | 36.9 | 114.5 | 126.3 | 184.7 |
| MSCI ACWI Financials | (6.1) | 5.6 | 17.6 | 42.7 | 114.2 | 123.7 | 205.0 |
| MSCI AC World Index | (10.4) | (2.9) | 4.8 | 26.0 | 74.5 | 77.9 | 332.0 |
Figure 13: Five-largest positive contributions to relative returns YTD to 30 April 2025
| Average stock weight (%) | Active weight (%) | Stock return (%) | Total attribution (%) | |
|---|---|---|---|---|
| UniCredit | 2.32 | 1.78 | 36.17 | 0.53 |
| flatexDEGIRO | 1.01 | 1.01 | 60.92 | 0.45 |
| EURO STOXX Banks Index put options | 0.02 | 0.02 | 300.09 | 0.40 |
| MercadoLibre | 1.11 | 1.11 | 28.57 | 0.28 |
| Deutsche Boerse | 1.46 | 1.09 | 30.97 | 0.28 |
We last discussed UniCredit in our June 2024 note. Recently, the bank celebrated its first quarter 2025 results, describing the three months to end March 2025 as “the best quarter in our history”. Its share price has been hitting new highs, yet it still trades on a P/E ratio of 9.4x and offers a dividend yield of 4.2%. The managers have been highlighting the valuation opportunity for European banks for some time and this stance has begun to be rewarded this year, with a decent contribution to NAV returns coming from a derivatives position on the sector.
flatexDEGIRO
Figure 14: flatexDEGIRO (EUR)
Source: Bloomberg
flatexDEGIRO (flatexdegiro.com/en) describes itself as the leading and fastest-growing European online broker. Having started life in 2006, with an online brokerage operating in Germany and Austria, it now has over 3m customer accounts across 16 countries. It also offers its services to professional investors under its Vitrade brand. The business is highly profitable, with a cost-income ratio of 50% (meaning 50p is spent for every £1 of income). The company increased its net income by 55% on revenues up 23% in 2024 relative to 2023, and announced that it was targeting a further 75% increase in net income by 2027.
The managers see the potential for a further acceleration in growth if Germany legislates to encourage private pension provision (moving more responsibility for retirement income from the state to individuals). The positive shift in investor sentiment within the country, following its commitment to sharply higher defence and infrastructure spending, was also helpful.
This was also a factor in Deutsche Boerse’s strong returns.
MercadoLibre
Figure 15: MercadoLibre (USD)
Source: Bloomberg
MercadoLibre (mercadolibre.com) is the leading online marketplace in Latin America. It is a fast-growing business – it recently reported 17% year-on-year growth in gross merchandise value traded through its sites in the first quarter of 2025, and 37% year-on-year growth in net revenue and financial income (all is US dollar terms). It incorporates a fintech services business Mercado Pago, which is the largest digital payment platform in Latin America and a provider of buy-now-pay-later and other credit provision services. Its credit portfolio (the total value of loans extended to customers) has grown by 75% year-on-year.
Figure 16: Five-largest negative contributions to relative returns YTD to 30 April 2025
| Average stock weight (%) | Active weight (%) | Stock return (%) | Total attribution (%) | |
|---|---|---|---|---|
| Ares Management | 1.62 | 1.39 | (19.54) | (0.38) |
| Berkshire Hathaway | 2.94 | (1.91) | 9.99 | (0.29) |
| Bank of America | 3.78 | 1.58 | (15.25) | (0.26) |
| Banco Santander | 0.00 | (0.68) | 42.16 | (0.24) |
| Allianz | 0.00 | (1.02) | 26.64 | (0.24) |
After a strong run of performance, Ares Management was hit by expectations of a more difficult environment for private assets as Trump’s policy announcements increased the possibility of recession. For most of the first four months of the year, PCFT had a meaningful underweight exposure to Berkshire Hathaway, which was a relatively strong performer. The managers have been adding to the position, however, as discussed on page 8. Underweight exposures to Banco Santander and Allianz also held back PCFT’s relative returns.
US bank stocks including Bank of America, which had been riding high on anticipation of a relaxation of regulations, were knocked by fears of US recession and the prospect of an associated uptick in defaults (when borrowers are unable to repay loans).
Premium/discount
Figure 17: PCFT’s premium/(discount) over the five years to 30 April 2025
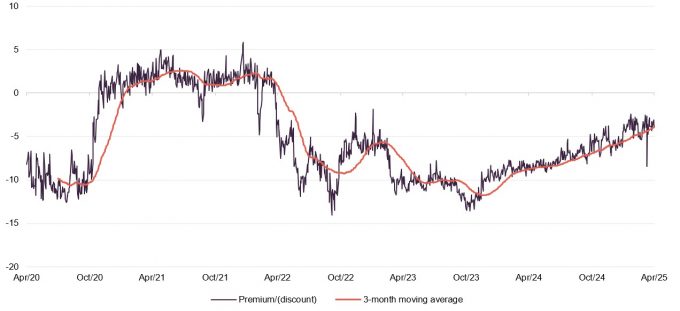
Source: Morningstar, Marten & Co
Over the 12 months ended 30 April 2025, PCFT’s discount to NAV moved within a range of 2.4% to 9.2% and averaged 6.2%. At 21 May 2025, PCFT was trading on a discount to NAV of 1.7%.
PCFT’s discount to NAV has continued to narrow in anticipation of June’s exit opportunity. The odd spike in the discount reflects periods of market volatility.
Fund intro
PCFT looks to grow investors’ income and their capital
More information on the trust is available on its website www.pcgft.com
Polar Capital Global Financials Trust (PCFT) has twin objectives of growing both investors’ income and their capital. Its global mandate makes it a useful alternative for UK-based investors looking to diversify their financials exposure.
PCFT launched on 1 July 2013 with a fixed life. In April 2020, in conjunction with a vote on prolonging the life of the trust, shareholders were offered a cash exit. Holders of 39.1% of PCFT’s then-issued share capital opted to sell their shares and the portfolio was reconstructed to facilitate this. At the same time, shareholders overwhelmingly approved an extension of the trust’s life beyond May 2020 and the trust now has an unlimited life, but with five-yearly tender offers, the first of which is currently underway (see page 4 for details).
Predominantly, the portfolio is invested in listed/quoted securities. The trust may have some exposure to unlisted/unquoted securities, but this is not expected to exceed 10% of total assets at the time of investment.
Benchmarked against MSCI ACWI Financials
Since April 2020, the trust’s performance benchmark has been the MSCI All-Countries World Financials Net Total Return Index in sterling (MSCI ACWI Financials).
PCFT’s AIFM is Polar Capital LLP, which had assets under management (AUM) of £21.4bn at 31 March 2025 and employs 14 investment teams, spread across offices in Europe, the US and Asia. PCFT’s lead managers are Nick Brind, George Barrow, and Tom Dorner.
Previous publications
QuotedData has published a number of notes on PCFT. You can read these by clicking the links in the table below or by visiting the QuotedData.com website.
Figure 18: QuotedData’s previously published notes on PCFT
| Title | Note type | Date |
|---|---|---|
| Don’t fear a slowing economy | Initiation | 30 April 2019 |
| Banks too cheap to ignore | Update | 29 October 2019 |
| New lease of life | Update | 22 February 2020 |
| Too much pessimism? | Annual overview | 22 October 2020 |
| The tide has turned | Update | 25 February 2021 |
| More to go for | Annual overview | 18 November 2021 |
| Riding out the storm | Update | 5 April 2022 |
| Don’t fear the dog that is yet to bark | Annual overview | 30 November 2022 |
| Avoiding mishap | Update | 7 June 2023 |
| Pessimism overdone, time to buy | Annual overview | 12 December 2023 |
| Handful of themes to drive performance | Update | 13 June 2024 |
| Taking advantage of a favourable landscape | Annual overview | 12 December 2024 |
IMPORTANT INFORMATION
Marten & Co (which is authorised and regulated by the Financial Conduct Authority) was paid to produce this note on Polar Capital Global Financials Trust Plc.
This note is for information purposes only and is not intended to encourage the reader to deal in the security or securities mentioned within it. Marten & Co is not authorised to give advice to retail clients. The research does not haveregard to the specific investment objectives financial situation and needs of any specific person who may receive it.
The analysts who prepared this note are not constrained from dealing ahead of it but, in practice, and in accordance with our internal code of good conduct, will refrain from doing so for the period from which they first obtained the information necessary to prepare the note until one month after the note’s publication. Nevertheless, they may have an interest in any of the securities mentioned within this note.
This note has been compiled from publicly available information. This note is not directed at any person in any jurisdiction where (by reason of that person’s nationality, residence or otherwise) the publication or availability of this note is prohibited.
Accuracy of Content: Whilst Marten & Co uses reasonable efforts to obtain information from sources which we believe to be reliable and to ensure that the information in this note is up to date and accurate, we make no representation or warranty that the information contained in this note is accurate, reliable or complete. The information contained in this note is provided by Marten & Co for personal use and information purposes generally. You are solely liable for any use you may make of this information. The information is inherently subject to change without notice and may become outdated. You, therefore, should verify any information obtained from this note before you use it.
No Advice: Nothing contained in this note constitutes or should be construed to constitute investment, legal, tax or other advice.
No Representation or Warranty: No representation, warranty or guarantee of any kind, express or implied is given by Marten & Co in respect of any information contained on this note.
Exclusion of Liability: To the fullest extent allowed by law, Marten & Co shall not be liable for any direct or indirect losses, damages, costs or expenses incurred or suffered by you arising out or in connection with the access to, use of or reliance on any information contained on this note. In no circumstance shall Marten & Co and its employees have any liability for consequential or special damages.
Governing Law and Jurisdiction: These terms and conditions and all matters connected with them, are governed by the laws of England and Wales and shall be subject to the exclusive jurisdiction of the English courts. If you access this note from outside the UK, you are responsible for ensuring compliance with any local laws relating to access.
No information contained in this note shall form the basis of, or be relied upon in connection with, any offer or commitment whatsoever in any jurisdiction.
Investment Performance Information: Please remember that past performance is not necessarily a guide to the future and that the value of shares and the income from them can go down as well as up. Exchange rates may also cause the value of underlying overseas investments to go down as well as up. Marten & Co may write on companies that use gearing in a number of forms that can increase volatility and, in some cases, to a complete loss of an investment.