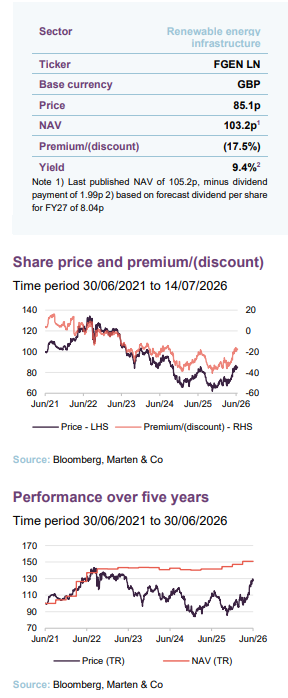
Foresight Environmental Infrastructure (FGEN) has demonstrated the benefits of its diversified portfolio during a period of significant regulatory and market uncertainty for the renewable energy sector. Whilst reductions in power price forecasts and government policy changes – including revisions to inflation-linked renewable subsidies, the planned removal of the Carbon Price Support mechanism and the extension of the Electricity Generator Levy – have weighed on sentiment across the sector, FGEN’s broad portfolio has limited the impact on its NAV and cash flows.
Recognition of the benefits of diversification has seen FGEN’s material discount narrow in recent months, but it continues to offer an attractive yield, a progressive dividend and multiple avenues for future value creation. This includes both growth assets that are ramping up operations and across its anaerobic digestion portfolio, which we explore further in this note.
Progressive dividend from investment in environmental infrastructure assets
FGEN aims to provide its shareholders with a sustainable, progressive dividend, and offer opportunities for capital growth. It invests in a diversified portfolio of environmental infrastructure technologies, targeting projects characterised by long-term stable cash flows, secured revenues, and inflation linkage. Investment in these assets is driven by the need to address climate change and societal demand for sustainability.
FGEN invests in a diversified portfolio of private infrastructure assets that deliver stable returns, long-term predictable income, and opportunities for growth while supporting the drive towards decarbonisation and sustainable resource management.
FGEN invests in three core areas of environmental infrastructure: renewable energy generation, other energy infrastructure, and sustainable resource management. Renewable energy generation investments include wind, solar, anaerobic digestion (AD), biomass, energy from waste, and hydropower. Other energy infrastructure assets include battery energy storage and low carbon transport. Sustainable resource management includes wastewater, waste processing, and sustainable solutions for food production such as agri- and aquaculture-controlled environment projects.
FGEN’s portfolio is diversified across complementary sectors, technologies and geographies which substantially de-risks it from exposure to fluctuations in weather patterns and helps differentiate the company from its peers.
FGEN’s mandate allows it to invest in emerging areas of environmental infrastructure, provided that they are sufficiently mature and display strong infrastructure characteristics.
FGEN’s AIFM is Foresight Group LLP (Foresight). Foresight is one of the best-resourced investors in renewable infrastructure assets, with £13.0bn of AUM at 31 March 2026. This includes Foresight Solar Fund, which sits in FGEN’s peer group. Foresight has a highly experienced and well-resourced global infrastructure team with 185 infrastructure professionals managing around 5.0GW of energy infrastructure. It is a global business, with offices in seven countries. The co-lead managers for FGEN are Edward Mountney and Charlie Wright.
Market backdrop
Government policy changes weighed on sentiment towards renewable energy infrastructure sector
The many government policy changes have added an extra layer of uncertainty to the UK renewable energy infrastructure sector, and dominated investor sentiment over the past few months. The inflation measure used in existing clean energy incentives used in the renewables obligation (RO) and feed-in-tariffs (FIT) schemes switched to CPI from the historically higher RPI in April.
The Carbon Price Support mechanism (CPS) will also be abolished from April 2028. This is expected to have the effect of reducing the marginal cost of gasfired generation that typically sets UK wholesale power prices, resulting in lower longterm power price forecasts.
Meanwhile, on the back of a spike in fuel prices due to the conflict in the Middle East, the government extended and increased the Electricity Generator Levy (EGL). The tax rate on exceptional generation receipts from UK-based electricity generators rose from 45% to 55% from 1 July. Additionally, the levy will be extended past its previously scheduled end date of 31 March 2028.
FGEN’s diverse portfolio has shielded it from worst of policy impact
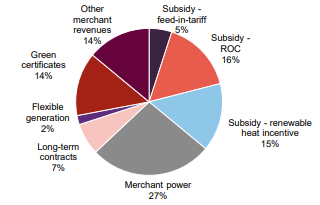
Due to FGEN’s highly diversified portfolio, the impact of these policy changes on the company’s NAV have been small, especially when compared to its pure-play renewable peers. Less than 30% of FGEN’s portfolio revenue is subject to RO and FIT incentives and therefore the change to CPIinflation linkage knocked NAV by just 0.5p per share or 0.5%. Likewise, the removal of the CPS was assessed in FGEN’s 2026 valuation and resulted in a 0.4p reduction in NAV.
FGEN’s manager is not forecasting any extra payments due to the EGL extension. Whilst the company is still earning revenues on some assets above the benchmark price, the manager does not expect that to go beyond the £10m de minimis level.
This highlights the value of FGEN’s portfoliodiversification and is reflected in its NAV and share price outperformance of its peer group (see page 14).
Under a likely Burnham premiership, FGEN’s manager says that the broader policy direction should remain supportive for renewables, grid investment, energy security and regional infrastructure. If there is any shift, the manager believes it would more likely be across regulated utilities where public control, affordability and returns may come under greater scrutiny, affecting ownership models more than decarbonisation ambition. Again, FGEN should not be materially impacted, as it has limited exposure to UK regulated utility assets, no reliance on a single policy framework, and a diversified portfolio across renewable generation, energy infrastructure and sustainable resource management, with revenues supported by contracted, subsidised and diversified merchant streams.
Annual results
FGEN reported a NAV of £655.5m or 105.2p per share at 31 March 2026 – a 1.2% fall over the year. Factoring in dividends of 7.96p, this equated to a 6.2% NAVtotal return for the year.
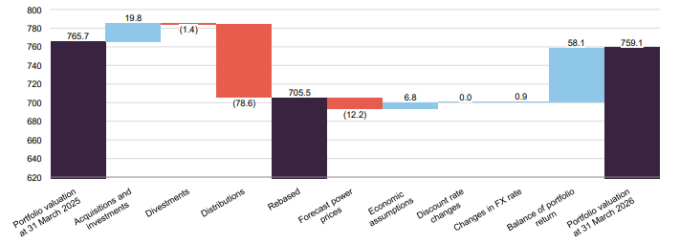
Figure 1: FGEN portfoliovaluation in £m, as at 31 March 2026
Source: FGEN, Marten & Co
Dividend comfortably covered by portfolio cash flows
Distributions received from projects over the year were £78.6m (2025: £90.4m). The reduction in revenues from the previous year was primarily driven by the rolling off of higher power price fixes entered into post-Ukraine conflict, with some downtime across the biomass and foodwaste AD parts of the portfolio also contributing. Dividend coverage remained at a comfortable level at 1.25x. The value of the portfolio fell £6.6m over the year, as shown in Figure 1.
Drivers of portfolio returns
Several factors impacted FGEN’s NAV. We detail these factors and their sensitivities below, beginning with power prices.
Power prices
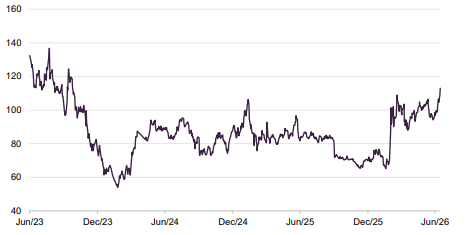
Power prices spiked in March due to the conflict in the Middle East, as shown in Figure 2. However, falling forecasts for future electricity and gas prices compared to forecasts at 31 March 2025 resulted in a £12.2m reduction in FGEN’s NAV. This has been a factor in the falling NAVs of FGEN’s peers, but FGEN’s diversified portfolio makes it less sensitive to this issue.
Figure 2: UK power prices
Source: Bloomberg – UK baseload
Updated forecasts reflect the expected impact of the abolition of the Carbon Price Support mechanism. The removal of the CPS was assessed in FGEN’s 2026 valuation and resulted in a £2.3m reduction in NAV (or 0.4p per share).
Fixed prices secured on the majority of portfolio
FGEN looks to fix the prices for most of its output, in an attempt to de-risk its exposure to volatile market prices. At 31 March 2026, the portfolio had price fixes secured at 80% for the Summer 2026 season, 70% for the Winter 2026/27 season, and 17% for Summer 2027.
Over the life of the asset, an increase in electricity and gas prices of 10% would add £36.2m (or 5.8p) to NAV and a 10% fall in power prices would take off £36.3m (or 5.8p).
FGEN’s manager states that in the event that electricity prices fall to £50/MWh (they are currently at around £110/MWh) and gas prices fall by a corresponding amount, the company would maintain a resilient dividend cover for the next three financial years.
Inflation
Short-term RPIinflation assumptions raised 50bps
Inflation assumptions used to value FGEN’s portfolio at 31 March 2026 (based on actual data and independent forecasts) were raised 50bps to 4.0% RPIinflation for 2026, 3.0% until 2030 and 2.25% thereafter. This resulted in a £7.7m uplift in NAV.
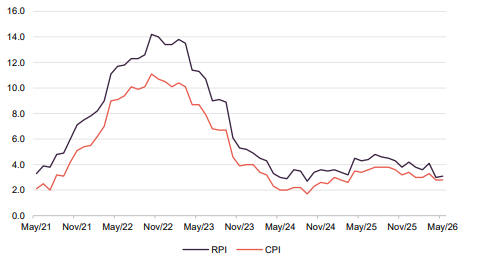
From 1 April 2026, the inflation measure used on RO and FIT contracts switched to CPI. FGEN’s CPIinflation assumptions were 3.0% in 2026, 2.5% to 2030 and 2.25% thereafter. CPI was at 2.8% at the end of May 2026. Figure 3 shows RPI and CPIinflation over the past five years.
Figure 3: UK RPI and CPI year-on-year (%)
Source: ONS, Marten & Co
Changes to RO and FIT indexation were incorporated into FGEN’s March 2026 valuation and reduced NAV by £3.1m, equivalent to 0.5p per share.
Looking forward, a decrease in the inflation rate of 0.5% over FGEN’s base case would result in a fall in the portfoliovaluation of £13.5m (2.2p per share) compared to an uplift in value of £13.9m (2.2p per share) if inflation increased by the same amount.
Anaerobic digestion life extension
We outlined the potential for life extensions on FGEN’s AD assets in our previous note. They were being conservatively valued over the 20-year life of the renewable heat incentive subsidy (RHI) that they receive, but growing evidence across Europe and the UK, including several market transactions, point to valuing the AD facilities beyond the end of the tariffs and possibly into perpetuity. FGEN, with an independent consultant, modelled revenues being derived from a range of sources including corporate offtakes, green certificates and/or a lower level of government support mechanisms.
FGEN extended the lives of seven AD assets
FGEN recognised an £8.7m (or 1.4p per share) NAV uplift from extending the lives of seven of its 11 AD assets that the manager considers possess the most compelling extension potential – mainly waste-based AD assets that have greater sustainability credentials than agricultural AD and would therefore be more attractive to corporate offtakers or gain greater government support.
The manager says that it used conservative assumptions and valuations were based on regulated market drivers and excluded higher voluntary green premiums that may emerge over time.
Some clarity is still required on the position that biomethane will take in the wider net zero and energy transition plans in the UK, with the government currently developing a biomethane policy framework, but the manager says that there is support and recognition from government of biomethane’s role in decarbonising hard-to-abate sectors.
Work is ongoing with a specialist independent consultant to further assess the remaining ADs in the portfolio before extensions and valuation uplifts are applied.
Discount rates
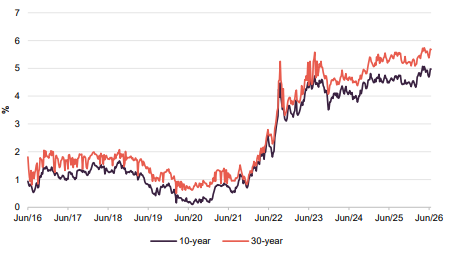
Figure 4: Long-term (10-year and 30-year) UK gilt yields
Source: Bloomberg, Marten & Co
The weighted average discount rate now sits at 9.9%
UK gilt yields remain at elevated levels, as shown in Figure 4. There were no macro-driven changes to discount rates, but some project specific changes related to AD life extension and growth asset progression. FGEN’s weighted average discount rate moved out slightly to 9.9% (from 9.7%), primarily due to ongoing investment into growth assets and increases in their values. There was no change to NAV resulting from changes to the discount rate.
A reduction in the discount rate of 0.5% would result in an uplift in value of £23.1m (or 3.7p per share), while a downward movement in the portfoliovaluation of £21.2m (3.4p per share) would occur if discount rates were increased by the same amount.
Investment process
Foresight selects projects based on their risk-return profile and consistency with its investment policy, operating within a limited set of investment restrictions. New assets are acquired predominantly through secondary market transactions with third parties.
The AIFM seeks to maintain a balanced, diversified portfolio and adopts a cautious approach. Whilst FGEN can invest across all OECD countries, the portfolio remains predominantly UK-focused, with modest exposure to mainland Europe through Norway and Italy. The managers favour jurisdictions and regulatory or subsidy regimes that they know well or where they have established partner relationships.
Investment restrictions
No more than 25% of the portfolio may be invested in assets under construction or not yet operational, of which up to 5% may be invested in development-stage assets.
At least 50% of the portfolio must be invested in the UK, with the balance invested in other OECD countries.
No new investment may exceed 30% of NAV (or 25% of NAV based on acquisition cost, taking existing holdings into account).
Purchases from third parties
Deals can be introduced by the wider Foresight team
Opportunities are sourced through project developers, specialist consultancy firms and the wider Foresight team. Acquisition prices are negotiated on an arm’s-length basis and reflect the managers’ assessment of each project’s risks, returns and capital structure.
ESG assessment
Previously, Foresight’s due diligence processes were structured around its proprietary Sustainability Evaluation Tool (SET), which was designed to consolidate a broad range of sustainability frameworks and assess material sustainability and ESG factors across both existing and prospective investments, while accommodating different investor preferences. As investor and sustainability expectations increasingly converge around a smaller set of common frameworks, Foresight has evolved its approach. The SET has been redesigned primarily as a portfolio management tool, while pre-investment due diligence and ongoing ESG monitoring will now be aligned with regulatory requirements and three core frameworks: the SASB Standards, Paris Agreement alignment, and the EU Taxonomy.
To strengthen internal capabilities, the division is piloting a geospatial risk platform developed with Frontierra that provides location-based insights into climate- and nature-related risks and opportunities. Following development, the platform entered initial testing and implementation across infrastructure, investment and portfolio management teams during FY2026. FGEN also obtained third-party assurance over key sustainability metrics in accordance with ISAE 3000 and intends to repeat this annually in line with sustainability reporting best practice.
Ongoing management
Day-to-day facilities management, operation and maintenance are generally outsourced, with the managers overseeing these arrangements, approving payments, identifying opportunities to improve efficiency and capacity, and optimising project SPV financial structures.
Disposals
FGEN typically holds assets for the long term, but may dispose of investments where the managers believe the sale price is attractive or where there are other compelling reasons to sell.
Hedging
The managers may hedge non-sterling currency exposure, as well as interest-rate, inflation, power-price and commodity-price risks. All hedging decisions are subject to board discretion.
Sustainability
FGEN’s strategy delivers clear environmental benefits. The company voluntarily discloses under Article 9 of the Sustainable Finance Disclosure Regulation (SFDR) and has a sustainable investment objective. Although, as a Guernsey company, it falls outside the UK Sustainability Disclosure Requirements (SDR) and associated labels, it voluntarily aligns with the SDR Sustainability Focus label as a matter of best practice and publishes the relevant disclosures.
During the year ended 31 March 2026, the portfolio generated 1,338GWh of renewable energy (2025: 1,272GWh), treated more than 35.8bn litres of wastewater (2025: 34.7bn litres) and diverted more than 653,464 tonnes of waste from landfill (2025: 703,470 tonnes).
GHG emissions avoided during FY2026 totalled 223,140 tCO₂e, while total portfolio emissions (Scope 1, 2 and 3) were 128,308 tCO₂e.
Foresight Group is a signatory to the United Nations Principles for Responsible Investment (UNPRI). In FY2026, Foresight Group was awarded five-star ratings across both the Policy, Governance and Strategy module and the Infrastructure division. ESG analysis is embedded in both FGEN’s investment process and ongoing portfolio monitoring. More information is included in the ESG section above.
Asset allocation
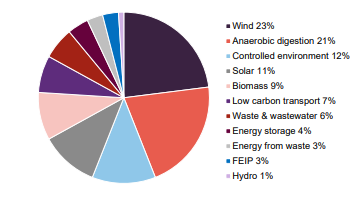
FGEN has one of the most diverse portfolios among its renewable energy infrastructure peers, with it currently invested in 10 sectors across 39 projects. The manager splits the portfolio into three key environmental infrastructure pillars: renewable energy generation (71% of the portfolio – wind, solar, AD, biomass, energy from waste, and hydropower); other energy infrastructure (11% – battery energy storage and low carbon transport assets); and sustainable resource management (18% – waste and water management assets and controlled environment assets).
Figure 5: Portfolio value split by sector, as at 31 March 2026
Source: FGEN, Marten & Co
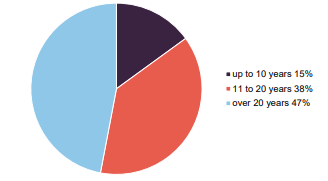
Figure 6: Portfolio split by remaining asset life as at 31 March 2026
Source: FGEN, Marten & Co
Figure 5 displays FGEN’s portfolio by project type, as at 31 March 2026. The weighted average remaining asset life of the portfolio increased to 18.5 years from 16.2 years, following the extension of the lives of some of its AD assets, as discussed earlier. The majority of its portfolio (90%) is located in the UK, with the 10% outside the UK accounted for by FGEN’s Italian and Norwegian investments.
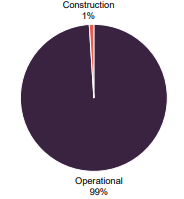
Figure 7: Portfolio split by operational status as at 31 March 2026
Source: FGEN, Marten & Co
Figure 8: Net present value of future revenues by type as at 31 March 2026
Source: FGEN, Marten & C
FGEN’s construction exposure has fallen below 1%, with early-stage assets, including the Rjukan project, transferring to operational.
The top 10 largest assets make up 56% of the total portfolio value. Figure 9 details the assets in FGEN’s portfolio, at 31 March 2026. The company has low exposure to individual assets, with no asset accounting for more than 10% of the portfolio.
Figure 9: FGEN portfolio of projects by type, as at 31 March 2026
Asset
Location
Type
Ownership
Capacity(MW)
Commercial operations date
Renewable energy generation
Bilsthorpe
UK (Eng)
Wind
100%
10.2
Mar 2013
Burton Wold Extension
UK (Eng)
Wind
100%
14.4
Sep 2014
Carscreugh
UK (Scot)
Wind
100%
15.3
Jun 2014
Castle Pill
UK (Wal)
Wind
100%
3.2
Oct 2009
Dungavel
UK (Scot)
Wind
100%
26.0
Oct 2015
Ferndale
UK (Wal)
Wind
100%
6.4
Sep 2011
Hall Farm
UK (Eng)
Wind
100%
24.6
Apr 2013
Llynfi Afan
UK (Wal)
Wind
100%
24.0
Mar 2017
Moel Moelogan
UK (Wal)
Wind
100%
14.3
Jan 2003 & Sep 2008
New Albion
UK (Eng)
Wind
100%
14.4
Jan 2016
Wear Point
UK (Wal)
Wind
100%
8.2
Jun 2014
Biogas Meden
UK (Eng)
Anaerobic digestion
49%
5.3
Mar 2016
Egmere Energy
UK (Eng)
Anaerobic digestion
49%
6.3
Nov 2014
Grange Farm
UK (Eng)
Anaerobic digestion
49%
6.3
Sep 2014
Icknield Farm
UK (Eng)
Anaerobic digestion
53%
7.4
Dec 2014
Merlin Renewables
UK (Eng)
Anaerobic digestion
49%
6.3
Dec 2013
Peacehill Farm
UK (Scot)
Anaerobic digestion
49%
6.8
Dec 2015
Rainworth Energy
UK (Eng)
Anaerobic digestion
100%
2.2
Sep 2016
Vulcan Renewables
UK (Eng)
Anaerobic digestion
49%
12.6
Oct 2013
Warren Energy
UK (Eng)
Anaerobic digestion
49%
6.3
Dec 2015
Amber
UK (Eng)
Solar
100%
9.8
Jul 2012
Branden
UK (Eng)
Solar
100%
14.7
Jul 2013
CSGH
UK (Eng)
Solar
100%
33.5
Mar 2014 & Mar 2015
Monksham
UK (Eng)
Solar
100%
10.7
Mar 2014
Pylle Southern
UK (Eng)
Solar
100%
5.0
Dec 2015
Codford Biogas
UK (Eng)
Waste anaerobic digestion
100%
3.8
2014
Bio Collectors
UK (Eng)
Waste anaerobic digestion
100%
11.7
Dec 2013
Cramlington Renewable Energy Developments
UK (Eng)
Biomass combined heat and power
100%
32.0
2018
Energie Tecnologie Ambiente (ETA)
Italy
Energy-from-waste
45%
16.8
2012
Northern Hydropower
UK (Eng)
Hydropower
100%
2.0
Oct 2011 & Oct 2017
Yorkshire Hydropower
UK (Eng)
Hydropower
100%
1.8
Oct 2015 & Nov 2016
Other energy infrastructure
West Gourdie
UK (Scot)
Battery storage
100%
50.0
May 2023
Clayfords
UK (Scot)
Battery storage
50%
50.0
Pre-construction
Sandridge
UK (Eng)
Battery storage
50%
50.0
Dec 2025
Asset
Location
Type
Ownership
Capacity(MW)
Commercial operations date
CNG Fuels
UK (Eng)
Low carbon transport
Minority2
n/a
Various
Sustainable resource management
Glasshouse
UK (Eng)
Controlled environment
10%
n/a
Mar 2025
Rjukan
Norway
Controlled environment
25%
n/a
Aug 2025
ELWA
UK (Eng)
Waste management
80%
n/a
2006
Tay
UK (Scot)
Wastewater treatment
33%
n/a
Nov 2001
Source: FGEN, Marten & Co. Note 1) excludes projects in FEIP’s portfolio. Note 2) FGEN holds 25% of CNG Foresight Holdings Ltd, which owns 60% of the shares in CNG Fuels Ltd (FGEN look-through interest 15%) and holds £150.15m in 10% preferred return investments issued by CNG Fuels (FGEN interest £37.5m).
The waste management and wastewater treatment assets – East London Waste Authority (ELWA) and Tay – are subject to PFI contracts that are coming towards the end of their concession periods. Some public authorities have attempted to withhold final unitary payments or retain funds within the structure, but FGEN’s manager says that, as yet, there are no indications that handover risk will manifest, particularly given the vintage of the PFI contracts in question have a more limited set of handback conditions compared to later such contracts.
On ELWA, which is due to hand back by the end of 2027, the debt is fully repaid and FGEN expects to start taking surplus cash (which amounts to around £30m-£40m) out of the project over the next two years.
The two controlled environment projects in FGEN’s portfolio are both now operational and production is ramping up, with the Glasshouse increasing commercial activity and Rjukan now producing and harvesting trout. Meanwhile, FGEN’s other growth asset, CNG Fuels, continues to scale its renewable biomethane platform.
FGEN has indicated that it could sell these assets over the medium term once operations have fully ramped up, subject to value and timing. If so, the manager says that the disposal proceeds will be reinvested into new environmental infrastructure opportunities that balance income, growth and risk, and does not expect to make further standalone controlled-environment investments (given it has stated new investments will retain a more disciplined focus on core environmental infrastructure).
Any new investment would share the investment characteristics of traditional infrastructure including inflation linkage, high barriers to entry, stable cash flows, and predictable output profiles. The manager says that these characteristics are more important to it than a particular sector.
Portfolio activity
FGEN made no acquisitions and disposals since our last note in December, but did make several follow-on investments, including into carbon capture across three AD assets, further investment into the pressure reduction system at the Vulcan AD, and a debt investment into CNG Fuels.
Distributions from FGEN’s portfolio were £78.6m over the year to 31 March 2026 – a shortfall of 2.9% (or £2.3m) against budget, although the company expects to recover around £4.2m in contractual compensation mechanisms. Solar and wind assets were 10.0% and 12.5% below target respectively. Meanwhile, AD assets were 19.0% above budget.
FGEN’s largest asset, the Cramlington biomass scheme (which accounts for 9% of portfolio value), generated 25.2% below target in the year, mainly due to a six-week extension of a planned outage in July and recurring boiler issues. Expected compensation reduces the shortfall to 15.7%. Following remediation works, FGEN’s manager says that plant reliability and availability has improved materially, with performance exceeding budget since March.
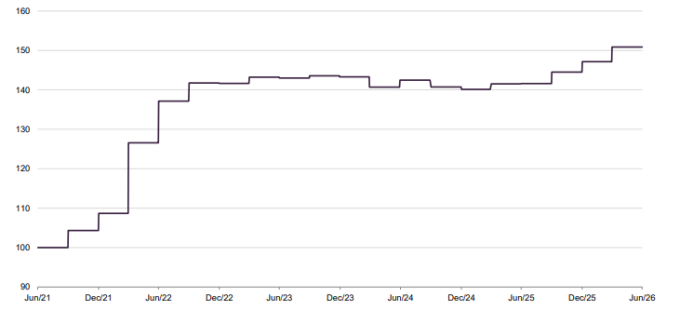
Performance
FGEN’s NAV returns have started to pick up over the past year as organic growth within its portfolio has fed through to valuations. This follows a flat three years as the sector faced substantial headwinds.
Figure 10: FGEN NAV TR over five years to 30 June 2026
Source: Bloomberg, Marten & Co
Figure 11: FGEN cumulative performance to 30 June 2026
3 months (%)
6 months (%)
1 year (%)
3 years (%)
5 years (%)
FGEN NAVtotal return
0.0
2.5
6.5
5.5
50.9
FGEN share price total return
28.2
36.2
17.9
6.4
27.2
Source: Bloomberg, Marten & Co
Peer group
Figure 12: AIC renewable energy infrastructure sector comparison table, as at 15 July 2026
Market cap (£m)
Premium/(discount) (%)
Yield(%)
Ongoing charge (%)
1 yr NAV TR (%)
3 yr NAV TR (%)
5 yr NAV TR (%)
10 yr NAV TR (%)
FGEN
530
(19.3)
9.4
1.11
8.6
2.3
9.0
7.7
Aquila European Renewables Income
53
(63.6)
31.3
1.20
(23.0)
(14.8)
(6.4)
–
Bluefield Solar Income
546
(11.8)
9.7
1.02
(2.8)
(2.6)
4.9
7.6
Ecofin US Renewables Infrastructure
15
(50.6)
0.0
2.30
(7.1)
(26.0)
(14.6)
–
Foresight Solar
387
(28.6)
11.4
1.15
(1.1)
0.7
7.2
6.6
Gore Street Energy Storage Fund
249
(43.2)
8.1
1.38
(10.6)
(3.6)
3.1
–
Greencoat Renewables
683
(26.0)
9.2
1.18
3.6
3.1
6.3
–
Greencoat UK Wind
2,235
(23.0)
10.3
0.83
0.8
(0.4)
8.0
9.0
Gresham House Energy Storage
544
(16.6)
0.4
1.16
6.5
(6.7)
3.6
–
NextEnergy Solar
275
(37.4)
17.6
1.17
(8.7)
(3.4)
2.6
4.4
Octopus Renewables Infrastructure
331
(33.0)
10.0
1.22
(0.2)
1.0
4.8
–
SDCL Efficiency Income
422
(50.2)
16.4
1.05
(11.5)
(3.3)
(0.0)
–
The Renewables Infrastructure Group
1,711
(29.9)
10.3
0.94
3.3
(1.7)
4.2
7.0
US Solar Fund
82
(42.6)
6.3
1.61
(0.8)
(6.4)
(2.6)
–
VH Global Energy Infrastructure
291
(29.3)
7.9
1.50
7.4
2.9
5.7
–
Peer group median
387
(29.9)
9.7
1.17
(0.8)
(2.6)
4.2
7.3
FGEN rank
6/15
3/15
9/15
5/15
1/15
3/15
1/15
2/6
Source: QuotedData website
You can access up-to-date information on FGEN and its peers on the QuotedData website.
FGEN has one of the broadest remits of the 15 companies that comprise the members of the AIC’s renewable energy infrastructure sector. Most of these funds are focused on solar or wind or some combination of the two. Two of these funds are focused solely on energy storage. There is variation of geographic exposure within the peer group too, with a number of funds that are heavily exposed to the North American market (which has a different risk/reward structure).
The sector has been shrinking through a combination of private acquisitions (taking advantage of the wide discounts in the sector) or through managed wind-downs. The sector has lost Aquila Energy Efficiency and Hydrogen Capital Growth to managed wind-downs since our last note. Meanwhile, Bluefield Solar Income’s board has recommended the sale of the company to Drax Group and US Solar Fund has also received a bid for its portfolio. Meanwhile, NextEnergy Solar has put itself up for sale and Aquila European Renewables Income is in a managed wind-down.
A proposed merger of The Renewables Infrastructure Group (TRIG) with InfraRed Capital stablemate HICL Infrastructure was abandoned last year after a shareholder backlash. TRIG passed a continuation vote at the end of June 2026.
FGEN is one of the larger funds within this peer group. Its discount is one the narrowest in the peer group, reflecting the strength of its diversified portfolio. FGEN’s yield is highly attractive, with coverage of 1.25x. Its ongoing charges ratio is now one of the most competitive in the peer group, following a reduction in the management fee. Its NAV returns are also among the highest in the peer group over all time periods.
Dividend
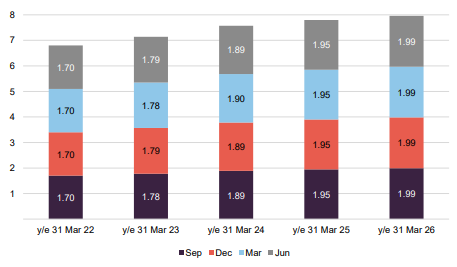
FGEN has a progressive dividend policy and has grown the dividend every year since launch. For the accounting year ended 31 March 2026, the company declared a dividend of 7.96p (up 2.1% from 7.80p in 2025), which was 1.25x covered by net cash flows from the portfolio. The board said that it was targeting a total dividend of 8.04p for the 2027 financial year, representing a 1.0% increase, and expects this to again be comfortably covered by cash flows.
Figure 13: FGEN five-year dividend history, pence per share
Source: FGEN, Marten & Co. Note: financial years to 31 March.
Premium/(discount)
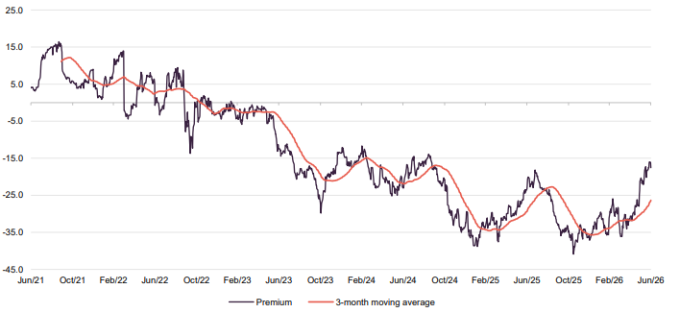
FGEN’s discount had been narrowing from all-time lows that followed the government proposals to bring forward the change in the inflation measure for incentives at the end of 2025.
Over the year to 30 June 2026, FGEN’s shares traded in range of a 16.0% and a 40.9% discount to NAV, and averaged a discount of 29.5%. FGEN’s discount at 14 July 2026 was at 17.5%.
The company is again facing a continuation vote at its AGM in September, as its discount averaged more than 10% over FY2026. Shareholders have overwhelmingly voted for continuation in the previous two years, and the board has said that it is confident of the same outcome this time. We feel that the company deserves to continue.
Figure 14: FGEN premium/(discount) (%) over five years to 30 June 2026
Source: Bloomberg, Marten & Co
Fees and costs
FGEN’s ongoing charges ratio for the year ended 31 March 2026 was 1.11% (2025: 1.24%). The board expects the ongoing charges ratio to fall to 1.05% for FY2027, factoring in the full benefit of the investment management fee reduction and assuming no change in NAV
The investment management fee was reduced in October 2025 and is now calculated 50% based on NAV and 50% on market capitalisation (capped at NAV), having changed from a tiered structure based on NAV in October 2025. The change saw the investment management fee reduce from £7.2m in 2025 to £5.8m in 2026. There is no performance fee, and the manager’s contract can be terminated on one year’s notice.
For the year ended 31 March 2026, directors’ fees and expenses totalled £314,000 (2025: £327,000) and the administration fee was about £110,000 (2025: £124,000).
Capital structure
FGEN has 623,338,335 ordinary shares in issue and 38,192,894 shares held in treasury, as at 15 July 2026.
FGEN has an indefinite life, but a continuation vote may be triggered if its shares trade at a discount in excess of 10% for a prolonged period (which was the case in the financial years 2024, 2025 and 2026). The company’s financial year end is 31 March and AGMs are typically held in August or September.
Gearing
FGEN has a £150m multi-currency RCF that at 31 March 2026 was £123.1m drawn. In April, FGEN signed a one-year extension to the RCF and activated a £15m accordion facility. The additional capacity provides greater headroom to fund existing portfolio commitments.
The RCF – which is provided by National Australia Bank, Royal Bank of Scotland International, ING, HSBC, and Clydesdale Bank – matures in June 2028.
The loan bears interest of SONIA (for sterling drawdowns) and EURIBOR (for euro drawdowns) +210bps. Interest charged is linked to meeting certain agreed sustainability goals, with the rate rising or falling 5bps based on performance against these ESG targets:
Environmental: increase coverage of independent biodiversity assessments and implement initiatives to enhance biodiversity net gain across the portfolio;
Social: increased volume of contributions to local communities; and
Governance: maintaining a low number of work-related accidents, as defined under the Reporting of Injuries, Diseases and Dangerous Occurrences (RIDDORS) by the Health and Safety Executive.
At the project level, FGEN is constrained to a maximum of 65% gearing on gross project value for renewable energy generation projects and a maximum of 85% gearing on gross project value for PFI/PPP type projects. In practice, actual project gearing is much lower than this. At 31 March 2026, project-level gearing across the portfolio was 16.1%.
Including the amount drawn under the RCF, FGEN’s gearing ratio was 28.8% at 31 March 2026.
Major shareholders
FGEN’s largest shareholders at 31 March 2026 were Hargreaves Lansdown (8.36%), Interactive Investor (6.39%) and Gravis Capital Management (6.26%).
Lead managers
Edward Mountney
Edward has been a part of FGEN since 2016 and joined the senior management team in 2022. Before this, he served as head of valuations at Foresight Group and John Laing Capital Management. With over 15 years of experience in infrastructure and renewables, Edward is a member of the Institute of Chartered Accountants in England and Wales. He holds a BA (Hons) in Business and Management from Oxford Brookes University.
Charlie Wright
Charlie joined Foresight Group in 2017, recently joining FGEN’s senior management team. He has over 19 years of experience in infrastructure and renewables as an adviser, equity investor and project director, and has overseen a wide range of investments across Europe. Charlie was previously at John Laing Group and KPMG. He holds a BA in History from Exeter University and an ICAEW & CISI Diploma in Corporate Finance.
Board
FGEN’s board is currently composed of five directors, all of whom are non-executive and considered to be independent of the investment manager.
Chair Ed Warner announced he will step down from the board at the AGM in September. He will be replaced by current senior independent director Stephanie Coxon. Alan Bates will resume the role of senior independent director, and a search is underway for a new board member.
Figure 15: Board members – length of service and shareholdings
Director
Position
Date of appointment
Length of service (years)
Annual fee (GBP)
Shareholding
Ed Warner
Chair
2 August 2022
3.9
85,000
75,000
Stephanie Coxon
Audit committee chair
11 June 2020
6.0
65,500
65,000
Alan Bates
Risk committee chair
10 June 2021
5.0
55,500
25,000
Jo Harrison
ESG committee chair
10 June 2021
5.0
55,500
8,066
Nadia Sood
Director
10 February 2023
3.4
53,000
6,796
Source: FGEN, Marten & Co
Ed Warner
Ed gained extensive financial services experience from senior positions held at several investment banks and financial institutions, including IFX Group, Old Mutual, NatWest Markets and Dresdner Kleinwort Benson. He also has considerable investment trust experience, having been chair of both Standard Life Private Equity Trust Plc and BlackRock Energy and Resources Income Trust Plc. He is currently chair of HarbourVest Global Private Equity. Ed has also previously served as chair of Air Partner Plc and non-executive director and interim chair of Clarkson Plc.
Stephanie Coxon
Stephanie is a fellow of the Institute of Chartered Accountants in England and Wales and is currently a non-executive director of several London listed companies. Prior to her non-executive director career, she led the investment trust capital markets team at PwC for the UK and Channel Islands. During her time at PwC, Stephanie specialised in advising FTSE 250 and premium London listed companies on accounting, corporate governance, risk management and strategic matters.
Alan Bates
Alan has over 33 years’ experience in the energy and infrastructure sectors, including electricity, gas and water utilities. He has developed a broad understanding of the dynamics behind the energy transition and has assisted the government of Guernsey in developing its energy policy. Alan started his career with P&O and Princess Cruises as a Marine Engineering Officer, followed by 19 years in the oil and gas industry working for Mobil Oil/BP Oil and then International Energy Group before becoming the managing director of Manx Gas in the Isle of Man. He is the CEO of Guernsey Electricity and is a director of the Channel Islands Electricity Grid and Alderney Electricity Limited. Alan is a Chartered Engineer, Fellow of the Institute of Mechanical Engineers and a Member of the Institute of Engineering Technology.
Jo Harrison
Jo has over 25 years’ experience working in the water industry and is the director of strategic planning & sustainability at United Utilities, where she is accountable for leading the approach to environmental and long‑term planning, including developing and strengthening the approach to all aspects of the environment, climate change and carbon, asset strategy, risk and resilience. Jo is a chartered member of the Institute of Water and Environmental Managers and is a Chartered Environmentalist. She is also a trustee of the Rivers Trust.
Nadia Sood
Nadia has extensive experience of executing, managing and overseeing complex infrastructure investments. She has run large renewable energy infrastructure investment portfolios worth billions of dollars in multiple countries and served as a director on the board of more than 20 prominent privately owned companies. Nadia is currently CEO of CreditEnable, a global credit insights and technology solutions company, and a member of the IFC/World Bank SME Finance Forum. She holds a Bachelor of Science in Foreign Service from the Edmund A. Walsh School of Foreign Service at Georgetown University in Washington D.C., and a Masters in International Affairs from Columbia University, New York. Nadia is fluent in English, French and Norwegian.
SWOT analysis and bull vs bear case
Figure 16: SWOT analysis for FGEN
Strengths
Weaknesses
Highly diversified portfolio.
Sensitive to market sentiment and interest ratevolatility.
Continued robust revenues from core portfolio.
Progressive dividends, with comfortable coverage by income.
Opportunities
Threats
Valuation uplifts from growth assets moving to fully operational.
Further unfavourable policy changes.
Further life extensions across portfolio.
Source: Marten & Co
Figure 17: Bull vs bear case for FGEN
Aspect
Bull case
Bear case
Performance
Capital appreciation of growth assets as operations ramp up. Core portfolio continues to produce strong cash flows.
Growth assets take longer than anticipated to become fully operational. Energy prices dive, impacting income streams.
Dividends
Progressive dividend since launch, which the board are committed to continuing.
Increases potentially not sustainable if conditions change.
Outlook
Structural increase in renewable energy demand looks set to continue.
Government scales back climate commitments.
Discount
FGEN’s discount could narrow further as interest rates subside and sentiment towards the sector turns positive.
The discount could widen due to detrimental government proposals.
Source: Marten & Co
Previous publications
You can read our previous notes on FGEN by clicking on them below or by visiting our website.
Figure 18: QuotedData’s previously published notes on FGEN
This marketing communication has been prepared for Foresight Environmental Infrastructure Limited by Marten & Co, which is authorised and regulated by the Financial Conduct Authority (FCA). It constitutes non-independent research as defined under the UK MiFID II regime and the onshored Commission Delegated Regulation (EU) 2017/565.
This communication is intended for use by investment professionals as defined in Article 19(5) of the Financial Services and Markets Act 2000 (Financial Promotion) Order 2005. Marten & Co is not authorised to provide advice to retail clients. Accordingly, if you are not a professional investor, or are otherwise restricted from receiving this information, you should disregard it. The note does not have regard to the specific investment objectives, financial situation and needs of any specific person who may receive it.
The note has not been prepared in accordance with legal requirements designed to promote the independence of investment research and as such is considered to be a marketing communication. The analysts who prepared this note are not constrained from dealing ahead of it, but in practice, and in accordance with our internal code of good conduct, will refrain from doing so for the period from which they first obtained the information necessary to prepare the note until one month after the note’s publication. Nevertheless, they may have an interest in any of the securities mentioned within this note.
This note has been compiled from publicly available information. This note is not directed at any person in any jurisdiction where (by reason of that person’s nationality, residence or otherwise) the publication or availability of this note is prohibited.
Accuracy of Content: Whilst Marten & Co uses reasonable efforts to obtain information from sources which we believe to be reliable and to ensure that the information in this note is up to date and accurate, we make no representation or warranty that the information contained in this note is accurate, reliable or complete. The information contained in this note is provided by Marten & Co for personal use and information purposes generally. You are solely liable for any use you may make of this information. The information is inherently subject to change without notice and may become outdated. You, therefore, should verify any information obtained from this note before you use it.
No Advice: Nothing contained in this note constitutes or should be construed to constitute investment, legal, tax or other advice.
No Representation or Warranty: No representation, warranty or guarantee of any kind, express or implied is given by Marten & Co in respect of any information contained on this note.
Exclusion of Liability: To the fullest extent allowed by law, Marten & Co shall not be liable for any direct or indirect losses, damages, costs or expenses incurred or suffered by you arising out or in connection with the access to, use of or reliance on any information contained on this note. In no circumstance shall Marten & Co and its employees have any liability for consequential or special damages.
Governing Law and Jurisdiction: These terms and conditions and all matters connected with them, are governed by the laws of England and Wales and shall be subject to the exclusive jurisdiction of the English courts. If you access this note from outside the UK, you are responsible for ensuring compliance with any local laws relating to access.
No information contained in this note shall form the basis of, or be relied upon in connection with, any offer or commitment whatsoever in any jurisdiction.
Investment Performance Information: Please remember that past performance is not necessarily a guide to the future and that the value of shares and the income from them can go down as well as up. Exchange rates may also cause the value of underlying overseas investments to go down as well as up. Marten & Co may write on companies that use gearing in a number of forms that can increase volatility and, in some cases, to a complete loss of an investment.