
Pushing on despite regulatory upheaval
The renewable energy infrastructure sector was hit last month when the government announced plans to switch the inflation link in clean energy incentives from the higher RPI to CPI from next year, four years earlier than planned. For Foresight Environmental Infrastructure (FGEN), this would only mean a small 0.5% drop in NAV thanks to its diverse portfolio. However, a second proposal to freeze uplifts until overpayments are recovered could be more damaging, raising concerns about the UK government’s reliability as an investment partner and risking long-term investment in UK infrastructure.
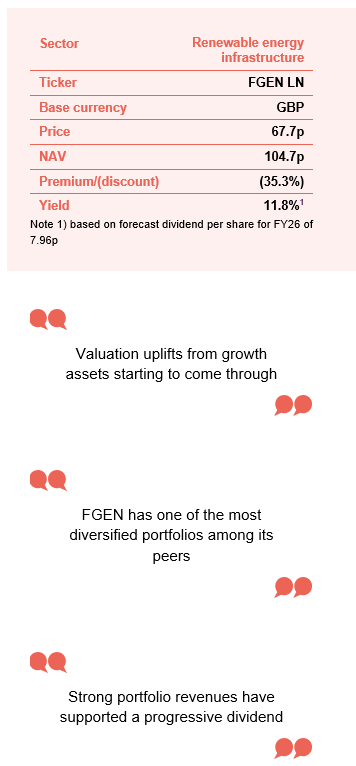
Despite this, FGEN’s portfolio continues to generate strong revenues, easily covering its progressive dividend, which currently yields nearly 12%. The company is also set to benefit as its growth assets become fully operational.
Progressive dividend from investment in environmental infrastructure assets
FGEN aims to provide its shareholders with a sustainable, progressive dividend, and to preserve capital values. It invests in a diversified portfolio of environmental infrastructure technologies, targeting projects characterised by long-term stable cash flows, secured revenues, and inflation linkage. Investment in these assets is driven by the need to address climate change and societal demand for sustainability.
At a glance
Share price and discount
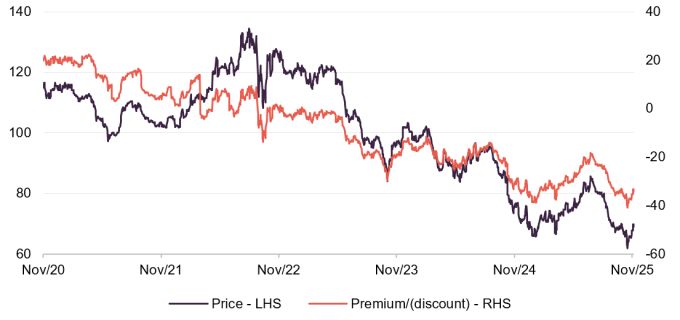
FGEN’s discount had been narrowing from record lows earlier this year. However, government plans to change the inflation measure for incentives caused the discount to widen, as happened across the peer group.
Over 12 months to 30 September 2025, FGEN’s shares traded at discounts to NAV between 17.4% and 38.8%, averaging 28.6%. On 15 December 2025, the discount was 35.3%, wider than the 12-month average.
Time period 30 November 2020 to 15 December 2025
Source: Bloomberg, Marten & Co
Performance over five years
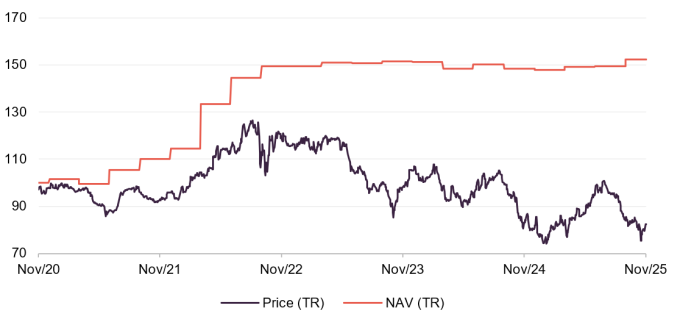
FGEN’s NAV returns have been flat over the past three years, despite significant challenges for both the company and the wider renewable energy infrastructure sector that have led to lower portfolio valuations. However, strong portfolio revenues have supported steady dividend payments, helping to balance out the decline in asset value.
Time period 30 November 2020 to 30 November 2025
Source: Bloomberg, Marten & Co
| 12 months ending | Share price total return (%) | NAV total return (%) | Earnings per share (pence) | Adjusted EPS (pence) | Dividend per share (pence) |
|---|---|---|---|---|---|
| 31/03/2021 | 6.9 | 1.5 | 1.5 | 6.7 | 6.76 |
| 31/03/2022 | 7.3 | 34.1 | 30.6 | 7.0 | 6.80 |
| 31/03/2023 | 12.2 | 13.1 | 14.9 | 6.7 | 7.14 |
| 31/03/2024 | (15.8) | (1.8) | (2.1) | 7.5 | 7.57 |
| 31/03/2025 | (15.9) | 0.6 | (0.4) | 8.6 | 7.80 |
Source: Bloomberg, Marten & Co
Market backdrop
UK government proposes change to inflation measure in existing incentives
Government plans to change the inflation measure used in clean energy incentives have caused share prices in the renewable energy infrastructure sector to fall. The Department of Net Zero and Energy Security began a consultation in October on switching the inflation index for renewables obligation (RO) and feed-in-tariffs (FIT) schemes from RPI to CPI.
Two options are being considered. The first is a straightforward switch in 2026, four years earlier than the scheduled 2030 change. The second would freeze the subsidy until 2035 to recover what the government sees as past overpayments to renewable operators.
Figure 1 shows the possible impact on FGEN and the sector’s NAV under both options. FGEN’s portfolio is more diversified, with only about 29% of its revenue tied to RO and FIT incentives, so it should be less affected than its more specialised renewable peers.
Figure 1: Estimated NAV impact of proposed change to RO and FIT inflation measure
| Company | Option 1 (%) | Option 2 (%) |
|---|---|---|
| FGEN | (0.5) | (6.3) |
| Bluefield Solar | (2.0) | (10.0) |
| Foresight Solar | (1.6) | (10.2) |
| Greencoat UK Wind | (1.7) | (7.5) |
| NextEnergy Solar | (2.0) | (9.0) |
| Octopus Renewables Infrastructure | (1.1) | (4.0) |
| The Renewables Infrastructure Group | (0.5) | (2.2) |
Source: Company announcements
Option one impact FGEN the least among peers
The manager estimates option one would reduce FGEN’s NAV by 0.5p per share or 0.5%, while option two would cut it by 6.6p, or 6.3%. In both cases, dividend cover is expected to remain stable in the near term.
The government aims to lower energy bills, estimating that option one would reduce the average household bill in 2026-27 by £4, rising to £13 under option two, before considering other costs like higher capital costs.
This proposal follows the Office for National Statistics recommending RPI be replaced by CPIH, which includes housing costs, as RPI tends to overstate inflation and inflate linked payments. The government has not explained why it is not switching to CPIH.
The government said that using CPI to annually adjust the RO and FIT buyout price (which were withdrawn in 2017-2019 but will continue until 2037 for renewable energy operators that built wind and solar farms under the schemes) was “proportionate and fair”, ensuring a stable and predictable return for generators and savings for consumers. It added that this would also prevent the risk of overpayment, as occurred when energy prices and inflation soared after Russia’s invasion of Ukraine in 2022.
QuotedData view
Move could erode investor confidence in UK government
Unilaterally changing contract terms with the renewables industry would damage confidence in the sector and set a worrying precedent. It would also weaken investor trust in the UK government as a reliable business partner, at a time when private investment in UK infrastructure is urgently needed. While such changes might bring short-term savings on consumer bills, they are likely to result in higher long-term costs as investors demand greater returns to offset the increased risk. This situation mirrors what happened in Spain in the mid-2010s, when the government changed renewable energy contracts, replaced support schemes, and introduced new taxes. That move badly hurt investor confidence and led to ongoing legal disputes.
Interim results
FGEN reported a NAV of £652.7m, or 104.7p per share, at 30 September 2025, down 1.7% over six months. Including dividends of 3.94p, the NAV total return was 2.0% for the period.
Project distributions totalled £39.7m, compared to £46.6m in the previous year, covering the dividend by 1.22 times and supporting further share buybacks. The portfolio value fell by £13.8m during the period, as shown in Figure 2.
Figure 2: FGEN portfolio valuation in £m, as at 30 September 2025

Source: FGEN, Marten & Co
Drivers of portfolio returns
Several factors impacted FGEN’s NAV. We detail these factors and their sensitivities below, beginning with inflation.
Inflation
Short-term RPI inflation assumptions raised 50bps
Inflation assumptions for valuing FGEN’s portfolio were increased by 0.5 percentage points to 4.0% RPI for 2025, 3.5% for 2026, then 3% until 2030 and 2.25% after. This change led to a £6.1m rise in NAV.
As noted earlier, RO and FIT contracts are expected to switch to using CPI next year. FGEN assumes CPI inflation of 2.75% in 2025 and 2.25% from 2026 onwards. CPI stood at 3.6% at the end of October 2025. Figure 3 shows RPI and CPI inflation for the past five years.
Figure 3: UK RPI and CPI year-on-year (%)

Source: ONS, Marten & Co
Power prices
Power prices have fallen slightly over the past six months, as shown in Figure 4. Small changes in forecasts for future electricity and gas prices compared to those at 31 March 2025 led to a £6.5m reduction in FGEN’s NAV.
Figure 4: UK power prices

Source: Bloomberg – UK baseload
Fixed prices secured on the majority of portfolio
FGEN aims to reduce its risk by fixing prices for most of its output. As of 30 September 2025, it had secured price fixes for 63% of output for Winter 2025/26, 24% for Summer 2026, and 25% for Winter 2026/27. Over the asset’s life, a 10% rise in electricity and gas prices would add £33.8m (5.4p) to NAV, while a 10% fall would reduce NAV by £33.1m (5.3p). The manager says that even if electricity prices drop to £40/MWh from the current £70/MWh, and gas prices fall similarly, FGEN expects to maintain strong dividend cover for the next three years.
Discount rates
Figure 5: Long-term (10-year and 30-year) UK gilt yields

Source: Bloomberg, Marten & Co
The weighted average discount rate now sits at 10.1%
UK gilt yields have dipped slightly but are still high, as shown in Figure 5. The discount rates used to value FGEN’s portfolio stayed the same, but the weighted average discount rate rose slightly to 10.1% from 9.7%. This was mainly due to ongoing investment in growth assets and their rising values. There was no change to NAV from discount rate movements.
If the discount rate fell by 0.5%, the portfolio value would rise by £19.4m (3.1p per share). If the discount rate increased by 0.5%, the value would drop by £18.2m (2.9p per share).
Asset allocation
FGEN has one of the most diversified portfolios among renewable energy infrastructure peers, with investments in 10 sectors across 39 projects. The manager divides the portfolio into three main areas: renewable energy generation (71% of the portfolio, including wind, solar, anaerobic digestion, biomass, energy from waste, and hydropower); other energy infrastructure (11%, such as battery storage and low carbon transport); and sustainable resource management (18%, covering waste, water management, and controlled environment assets).
Figure 6: Portfolio value split by sector, as at 30 September 2025
Figure 7: Portfolio split by remaining asset life as at 30 September 2025

Source: FGEN, Marten & Co
Source: FGEN, Marten & Co
As of 30 September 2025, the portfolio’s weighted average remaining asset life was 16.2 years. The manager believes this is a cautious estimate, particularly for the anaerobic digestion assets, which are valued based on the duration of their renewable heat incentive subsidies. However, recent market evidence suggests these assets could be valued beyond the end of these subsidies, potentially indefinitely. The manager has modelled scenarios where revenues continue through corporate contracts, green certificates, or reduced government support, which would lead to a significant increase in valuation of between £10m and £20m (1.6p to 3.2p) and significantly extend the weighted average life of the portfolio.
Potential Life extensions for AD assets could result in a substantial valuation uplift
There is still uncertainty about biomethane’s role in the UK’s net zero and energy transition plans, as the government is developing a biomethane policy framework expected next year.
The majority of its portfolio (88%) is located in the UK, with the 12% outside the UK accounted for by FGEN’s Italian and Norwegian investments.
Figure 8: Portfolio split by operational status as at 30 September 2025
Figure 9: Net present value of future revenues by type as at 30 September 2025

Source: FGEN, Marten & Co
Source: FGEN, Marten & Co
FGEN’s construction exposure has reduced to 3%, with the Rjukan asset transferring to early-stage operations (detailed below).
The top 10 largest assets make up 54% of the total portfolio value. Figure 10 details the assets in FGEN’s portfolio, at 30 September 2025. The company has low exposure to individual assets, with no asset accounting for more than 10% of the portfolio.
Figure 10: FGEN portfolio1 of projects by type, as at 30 September 2025
| Asset | Location | Type | Ownership | Capacity(MW) | Commercial operations date |
|---|---|---|---|---|---|
| Renewable energy generation | |||||
| Bilsthorpe | UK (Eng) | Wind | 100% | 10.2 | Mar 2013 |
| Burton Wold Extension | UK (Eng) | Wind | 100% | 14.4 | Sep 2014 |
| Carscreugh | UK (Scot) | Wind | 100% | 15.3 | Jun 2014 |
| Castle Pill | UK (Wal) | Wind | 100% | 3.2 | Oct 2009 |
| Dungavel | UK (Scot) | Wind | 100% | 26.0 | Oct 2015 |
| Ferndale | UK (Wal) | Wind | 100% | 6.4 | Sep 2011 |
| Hall Farm | UK (Eng) | Wind | 100% | 24.6 | Apr 2013 |
| Llynfi Afan | UK (Wal) | Wind | 100% | 24.0 | Mar 2017 |
| Moel Moelogan | UK (Wal) | Wind | 100% | 14.3 | Jan 2003 & Sep 2008 |
| New Albion | UK (Eng) | Wind | 100% | 14.4 | Jan 2016 |
| Wear Point | UK (Wal) | Wind | 100% | 8.2 | Jun 2014 |
| Biogas Meden | UK (Eng) | Anaerobic digestion | 49% | 5.0 | Mar 2016 |
| Egmere Energy | UK (Eng) | Anaerobic digestion | 49% | 5.0 | Nov 2014 |
| Grange Farm | UK (Eng) | Anaerobic digestion | 49% | 5.0 | Sep 2014 |
| Icknield Farm | UK (Eng) | Anaerobic digestion | 53% | 5.0 | Dec 2014 |
| Merlin Renewables | UK (Eng) | Anaerobic digestion | 49% | 5.0 | Dec 2013 |
| Peacehill Farm | UK (Scot) | Anaerobic digestion | 49% | 5.0 | Dec 2015 |
| Rainworth Energy | UK (Eng) | Anaerobic digestion | 100% | 5.0 | Sep 2016 |
| Vulcan Renewables | UK (Eng) | Anaerobic digestion | 49% | 5.0 | Oct 2013 |
| Warren Energy | UK (Eng) | Anaerobic digestion | 49% | 5.0 | Dec 2015 |
| Amber | UK (Eng) | Solar | 100% | 9.8 | Jul 2012 |
| Branden | UK (Eng) | Solar | 100% | 14.7 | Jul 2013 |
| CSGH | UK (Eng) | Solar | 100% | 33.5 | Mar 2014 & Mar 2015 |
| Monksham | UK (Eng) | Solar | 100% | 10.7 | Mar 2014 |
| Pylle Southern | UK (Eng) | Solar | 100% | 5.0 | Dec 2015 |
| Codford Biogas | UK (Eng) | Waste anaerobic digestion | 100% | 3.8 | 2014 |
| Bio Collectors | UK (Eng) | Waste anaerobic digestion | 100% | 11.7 | Dec 2013 |
| Cramlington Renewable Energy Developments | UK (Eng) | Biomass combined heat and power | 100% | 32.0 | 2018 |
| Energie Tecnologie Ambiente (ETA) | Italy | Energy-from-waste | 45% | 16.8 | 2012 |
| Northern Hydropower | UK (Eng) | Hydropower | 100% | 2.0 | Oct 2011 & Oct 2017 |
| Yorkshire Hydropower | UK (Eng) | Hydropower | 100% | 1.8 | Oct 2015 & Nov 2016 |
| Other energy infrastructure | |||||
| West Gourdie | UK (Scot) | Battery storage | 100% | n/a | May 2023 |
| Clayfords | UK (Scot) | Battery storage | 50% | n/a | Pre-construction |
| Sandridge | UK (Eng) | Battery storage | 50% | n/a | Under construction |
| Asset | Location | Type | Ownership | Capacity(MW) | Commercial operations date |
| CNG Fuels | UK (Eng) | Low carbon transport | Minority2 | n/a | Various |
| Sustainable resource management | |||||
| Glasshouse | UK (Eng) | Controlled environment | 10% | n/a | Mar 2025 |
| Rjukan | Norway | Controlled environment | 25% | n/a | Early stage operations |
| ELWA | UK (Eng) | Waste management | 80% | n/a | 2006 |
| Tay | UK (Scot) | Wastewater treatment | 33% | n/a | Nov 2001 |
Source: FGEN, Marten & Co. Note 1) excludes projects in FEIP’s portfolio. Note 2) FGEN holds 25% of CNG Foresight Holdings Ltd, which owns 60% of the shares in CNG Fuels Ltd (FGEN look-through interest 15%) and holds £150.15m in 10% preferred return investments issued by CNG Fuels (FGEN interest £37.5m).
FGEN plans to sell its three growth assets – the Glasshouse, Rjukan, and the CNG portfolio – once operations have scaled up and their values have increased. These assets were detailed in our previous note (see page 17 for a link).
The valuation of Rjukan asset rose as it transitions from construction to operational
All three are progressing as expected. The Rjukan trout farm in Norway increased in value by £2.9m over six months as it moved from construction to early operations, with the first harvest and sales in the summer. Its valuation method shifted from cost to discounted cash flow, and the manager expects further increases as operations grow.
CNG Fuels also performed well, with gas volumes up 15%, truck numbers up 18%, and pricing up 21% over the year, leading to a £2.2m rise in asset value.
The Glasshouse expanded sales and now supplies six of the UK’s eight largest clinics. It aims to reach cash flow break-even in the new year, with full ramp-up expected by 2026/27.
Portfolio activity
FGEN sold its stake in a BESS project and is considering options on another BESS asset
There has been little acquisition or disposal activity since our last note in July. In August, FGEN sold its 50% stake in the Lunanhead battery energy storage (BESS) project for £1.25m, matching its book value, choosing not to make a further investment. The manager is still considering options for the Clayfords BESS asset, where it also owns 50%.
Over the past six months, FGEN made follow-on investments totalling £7.9m, including further funding for the CNG platform and Vulcan Renewables.
FGEN’s solar assets outperformed generation targets by 6.2%, but this was offset by wind assets performing 6.5% below target. The Cramlington biomass scheme, FGEN’s largest asset at 9% of portfolio value, generated 44.3% below target in the six months to September, mainly due to a six-week extension of a planned outage in July. FGEN’s manager has made a liquidated damages claim against the O&M contractor and expects the shortfall to fall to 9.5% once the minimum compensation is received.
Performance
FGEN’s NAV returns have been flat over the past three years, despite significant challenges for both the company and the wider renewable energy infrastructure sector that have led to lower portfolio valuations. However, strong portfolio revenues have supported steady dividend payments, helping to balance out the decline in asset value.
Figure 11: FGEN NAV TR over five years to 30 September 2025

Source: Bloomberg, Marten & Co
Figure 12: FGEN cumulative performance to 30 September 2025
| 3 months (%) | 6 months (%) | 1 year (%) | 3 years (%) | 5 years (%) | |
|---|---|---|---|---|---|
| FGEN NAV total return | 2.0 | 2.1 | 2.7 | 1.9 | 52.4 |
| FGEN share price total return | (10.5) | 2.7 | (14.6) | (24.8) | (14.8) |
Source: Bloomberg, Marten & Co
Peer group
Figure 13: AIC renewable energy infrastructure sector comparison table, as at 15 December 2025
| Market cap (£m) | Premium/(discount) (%) | Yield(%) | Ongoing charge (%) | |
|---|---|---|---|---|
| FGEN | 422 | (35.3) | 11.8 | 1.24 |
| Aquila Energy Efficiency | 20 | (46.1) | 0.0 | 3.80 |
| Aquila European Renewables Income | 121 | (38.3) | 14.1 | 1.10 |
| Bluefield Solar Income | 401 | (41.1) | 13.2 | 1.02 |
| Ecofin US Renewables Infrastructure | 21 | (50.3) | 2.3 | 2.30 |
| Foresight Solar | 358 | (38.7) | 12.5 | 1.17 |
| Gore Street Energy Storage Fund | 272 | (40.2) | 13.0 | 1.38 |
| Greencoat Renewables | 683 | (30.4) | 9.7 | 1.18 |
| Greencoat UK Wind | 2,106 | (31.5) | 10.6 | 0.95 |
| Gresham House Energy Storage | 461 | (30.4) | 6.8 | 1.29 |
| Hydrogen Capital Growth | 19 | (59.0) | 0.0 | 2.53 |
| NextEnergy Solar | 291 | (42.9) | 16.7 | 1.18 |
| Octopus Renewables Infrastructure | 314 | (39.8) | 10.4 | 1.21 |
| SDCL Efficiency Income | 572 | (40.9) | 12.0 | 1.16 |
| The Renewables Infrastructure Group | 1,651 | (36.9) | 10.8 | 1.04 |
| US Solar Fund | 79 | (45.2) | 10.1 | 1.54 |
| VH Global Energy Infrastructure | 249 | (41.4) | 9.2 | 1.50 |
| Peer group median | 314 | (40.2) | 10.6 | 1.21 |
| FGEN rank | 6/17 | 4/17 | 7/17 | 10/17 |
Source: QuotedData website
You can access up-to-date information on FGEN and its peers on the QuotedData website.
FGEN stands out among the 17 companies in the AIC‘s renewable energy sector, as most peers focus mainly on solar, wind, or both, while two specialise only in energy storage. There are also differences in where these funds invest, with some having significant exposure to North America, which carries different risks and returns.
The sector has been shrinking over the past year due to private acquisitions, which have taken advantage of large discounts, and managed wind-downs. Since our last update, Downing Renewables & Infrastructure has left the sector, and both Aquila Energy Efficiency and Hydrogen Capital Growth are being wound down. Bluefield Solar Income put itself up for sale in November after shareholders rejected a merger with its manager, Bluefield Partners.
The proposed merger of The Renewables Infrastructure Group (TRIG) and infrastructure trust HICL Infrastructure (which are both managed by InfraRed Capital) was abandoned in early December after a HICL shareholder revolt. TRIG is facing a continuation vote in 2026.
FGEN is one of the larger funds in its peer group. Although its discount is narrower than most, the sector as a whole has seen lower valuations after government proposals to change the inflation measure on ROs and FITs. These wide discounts have affected yields across the sector. Despite this, FGEN offers a strong dividend yield with 1.22 times coverage. Its ongoing charges are about average but should decrease once the recent management fee reduction takes effect.
Figure 14: AIC renewable energy infrastructure sector NAV total return performance comparison table, as at 1 December 2025
| 1 year(%) | 3 years(%) | 5 years(%) | 10 years(%) | |
|---|---|---|---|---|
| FGEN | 2.7 | 0.6 | 8.8 | 7.3 |
| Aquila Energy Efficiency | (19.3) | (7.1) | – | – |
| Aquila European Renewables Income | (28.3) | (14.5) | (5.7) | – |
| Bluefield Solar Income | (2.8) | (0.5) | 6.8 | 7.8 |
| Ecofin US Renewables Infrastructure | (39.9) | (25.1) | – | – |
| Foresight Solar | (2.4) | (0.5) | 8.3 | 7.1 |
| Gore Street Energy Storage Fund | (6.0) | (0.7) | 4.7 | – |
| Greencoat Renewables | 3.6 | 4.2 | 5.9 | – |
| Greencoat UK Wind | (5.0) | 9.3 | 9.7 | 9.4 |
| Gresham House Energy Storage | 6.1 | (6.7) | 6.7 | – |
| Hydrogen Capital Growth | (59.1) | (24.4) | – | – |
| NextEnergy Solar | (0.7) | (2.9) | 5.3 | 5.6 |
| Octopus Renewables Infrastructure | 0.8 | 1.8 | 5.5 | – |
| SDCL Efficiency Income | 1.9 | (0.4) | 2.8 | – |
| The Renewables Infrastructure Group | (3.7) | (0.9) | 5.4 | 7.4 |
| US Solar Fund | (16.5) | (11.2) | (3.0) | – |
| VH Global Energy Infrastructure | 1.5 | 3.5 | – | – |
| Peer group median | (2.8) | (0.7) | 5.5 | 7.3 |
| FGEN rank | 3/17 | 5/17 | 2/13 | 4/6 |
Source: QuotedData website
Premium/(discount)
FGEN’s discount had been narrowing from record lows earlier this year. However, government plans to change the inflation measure for incentives caused the discount to widen, as happened across the peer group.
From 30 September 2025, FGEN’s shares traded at discounts to NAV between 17.4% and 38.8%, averaging 28.6%. On 15 December 2025, the discount was 35.3%, wider than the 12-month average.
Figure 15: FGEN premium/(discount) (%) over five years to 30 September 2025

Source: Bloomberg, Marten & Co
Fund profile
Further information can be found at FGEN.com
FGEN invests in a broad range of private infrastructure assets that provide stable returns, reliable long-term income, and growth potential, while also supporting decarbonisation and sustainable resource management.
The portfolio focuses on three main areas: renewable energy generation (including wind, solar, anaerobic digestion, biomass, energy from waste, and hydropower), other energy infrastructure (such as battery storage and low carbon transport), and sustainable resource management (covering wastewater, waste processing, and sustainable food production like agri- and aquaculture projects).
FGEN’s investments are spread across different sectors, technologies, and regions, reducing risk from weather changes and setting it apart from competitors. The mandate also allows investment in new areas of environmental infrastructure, as long as they are mature and have strong infrastructure qualities.
FGEN’s AIFM is Foresight Group LLP, a leading investor in renewable infrastructure with £13.6bn in assets under management as of 30 September 2025. This includes Foresight Solar Fund, a peer of FGEN. Foresight’s global team of 185 infrastructure professionals manages about 5.0GW of energy assets across seven countries. The co-lead managers for FGEN are Chris Tanner, Edward Mountney, and Charlie Wright.
SWOT analysis and bull vs bear case
Figure 16: SWOT analysis for FGEN
| Strengths | Weaknesses |
|---|---|
| Continued robust revenues from core portfolio | Sensitive to market sentiment and interest rate volatility |
| Progressive dividends, with comfortable coverage by income | |
| Opportunities | Threats |
| Valuation uplifts from growth assets moving to fully operational | Potential discount widening with Option 2 of government proposal |
| 35%+ discount to NAV could narrow if sentiment improves and interest rates fall |
Source: Marten & Co
Figure 17: Bull vs bear case for FGEN
| Aspect | Bull case | Bear case |
|---|---|---|
| Performance | Capital appreciation of growth assets as operations ramp up. Core portfolio continues to produce strong cash flows | Growth assets take longer than anticipated to become fully operational. Energy prices dive, impacting income streams |
| Dividends | Strong track record of increases, which the board are committed to continuing | Increases potentially not sustainable if conditions change |
| Outlook | Structural increase in renewable energy demand looks set to continue | Government scales back climate commitments |
| Discount | FGEN’s wide discount could narrow as interest rates subside and sentiment towards the sector turns positive | The discount could widen further due to detrimental government proposals |
Source: Marten & Co
Previous publications
You can read our previous notes on FGEN by clicking on them below or by visiting our website.
Figure 18: QuotedData’s previously published notes on FGEN
| Title | Note type | Date |
|---|---|---|
| Diverse renewables exposure | Initiation | 6 September 2017 |
| Anaerobic diversification | Update | 6 March 2018 |
| Diversification benefits shine through | Annual overview | 12 September 2018 |
| Life extensions to boost NAV? | Update | 15 March 2019 |
| Battery storage potential | Annual overview | 9 September 2019 |
| Reliable source of income | Update | 14 May 2020 |
| Increasingly diversified as green-led recovery looms | Annual overview | 16 February 2021 |
| On the front foot | Update | 4 August 2021 |
| It’s all about renewables | Annual overview | 29 March 2022 |
| Further portfolio diversification | Update | 29 September 2022 |
| Laying the foundations for NAV growth | Annual overview | 31 March 2023 |
| Backing the green hydrogen revolution | Update | 28 November 2023 |
| Vote against discontinuation | Annual overview | 17 July 2024 |
| Looking to bounce back | Update | 3 December 2024 |
| Strategic refresh | Annual overview | 21 July 2025 |
Source: Marten & Co
IMPORTANT INFORMATION
Marten & Co (which is authorised and regulated by the Financial Conduct Authority) was paid to produce this note on Foresight Environmental Infrastructure Plc.
This note is for information purposes only and is not intended to encourage the reader to deal in the security or securities mentioned within it. Marten & Co is not authorised to give advice to retail clients. The research does not have regard to the specific investment objectives financial situation and needs of any specific person who may receive it.
The analysts who prepared this note are not constrained from dealing ahead of it but, in practice, and in accordance with our internal code of good conduct, will refrain from doing so for the period from which they first obtained the information necessary to prepare the note until one month after the note’s publication. Nevertheless, they may have an interest in any of the securities mentioned within this note.
This note has been compiled from publicly available information. This note is not directed at any person in any jurisdiction where (by reason of that person’s nationality, residence or otherwise) the publication or availability of this note is prohibited.
Accuracy of Content: Whilst Marten & Co uses reasonable efforts to obtain information from sources which we believe to be reliable and to ensure that the information in this note is up to date and accurate, we make no representation or warranty that the information contained in this note is accurate, reliable or complete. The information contained in this note is provided by Marten & Co for personal use and information purposes generally. You are solely liable for any use you may make of this information. The information is inherently subject to change without notice and may become outdated. You, therefore, should verify any information obtained from this note before you use it.
No Advice: Nothing contained in this note constitutes or should be construed to constitute investment, legal, tax or other advice.
No Representation or Warranty: No representation, warranty or guarantee of any kind, express or implied is given by Marten & Co in respect of any information contained on this note.
Exclusion of Liability: To the fullest extent allowed by law, Marten & Co shall not be liable for any direct or indirect losses, damages, costs or expenses incurred or suffered by you arising out or in connection with the access to, use of or reliance on any information contained on this note. In no circumstance shall Marten & Co and its employees have any liability for consequential or special damages.
Governing Law and Jurisdiction: These terms and conditions and all matters connected with them, are governed by the laws of England and Wales and shall be subject to the exclusive jurisdiction of the English courts. If you access this note from outside the UK, you are responsible for ensuring compliance with any local laws relating to access.
No information contained in this note shall form the basis of, or be relied upon in connection with, any offer or commitment whatsoever in any jurisdiction.
Investment Performance Information: Please remember that past performance is not necessarily a guide to the future and that the value of shares and the income from them can go down as well as up. Exchange rates may also cause the value of underlying overseas investments to go down as well as up. Marten & Co may write on companies that use gearing in a number of forms that can increase volatility and, in some cases, to a complete loss of an investment.