
Pushing on despite regulatory upheaval
The renewable energy infrastructure sector was affected last month as the government outlined plans to change the inflation link in existing clean energy incentives from RPI to CPI from next year, four years ahead of the previously planned changeover. The impact on Foresight Environmental Infrastructure (FGEN) would likely be marginal under this option (0.5% reduction in NAV), due to the diversified nature of its portfolio. However, a second proposal was also put forward that would freeze uplifts until the government determines that overpayments are recovered. This move may raise questions about the UK government’s reputation as an investment partner for private capital and could affect long-term investment in UK infrastructure.
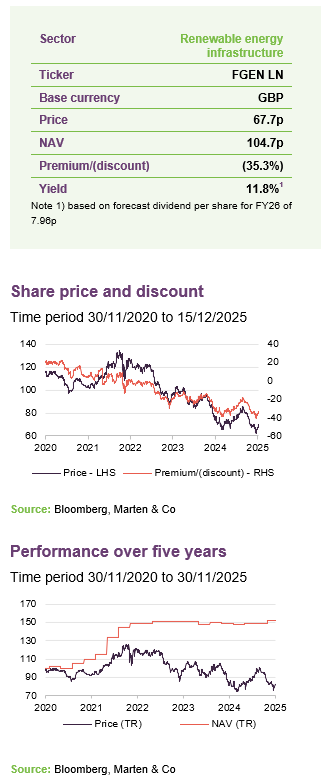
FGEN’s portfolio continues to produce revenue streams that cover its progressive dividend, which currently yields almost 12%. The company may benefit from its growth assets becoming fully operational.
Progressive dividend from investment in environmental infrastructure assets
FGEN aims to provide its shareholders with a sustainable, progressive dividend, and to preserve capital values. It invests in a diversified portfolio of environmental infrastructure technologies, targeting projects characterised by long-term stable cash flows, secured revenues, and inflation linkage. Investment in these assets is driven by the need to address climate change and societal demand for sustainability.
| 12 months ending | Share price TR (%) | NAV total return (%) | Earnings per share (pence) | Adjusted EPS (pence) | Dividend per share (pence) |
|---|---|---|---|---|---|
| 31/03/2021 | 6.9 | 1.5 | 1.5 | 6.7 | 6.76 |
| 31/03/2022 | 7.3 | 34.1 | 30.6 | 7.0 | 6.80 |
| 31/03/2023 | 12.2 | 13.1 | 14.9 | 6.7 | 7.14 |
| 31/03/2024 | (15.8) | (1.8) | (2.1) | 7.5 | 7.57 |
| 31/03/2025 | (15.9) | 0.6 | (0.4) | 8.6 | 7.80 |
Source: Bloomberg, Marten & Co
Market backdrop
UK government proposes change to inflation measure in existing incentives
Government proposals to change the inflation measure used in existing clean energy incentives appear to have impacted share prices across the renewable energy infrastructure sector. The Department of Net Zero and Energy Security launched a consultation in October on changing the inflation indexation calculation used in the renewables obligation (RO) and feed-in-tariffs (FIT) schemes from RPI to CPI.
Two options have been put forward to the industry. Option one is for a simple switch to take effect in 2026; four years before the planned 2030 changeover. Option two would involve freezing the subsidy until 2035 to recover what the government views as historic overpayments to renewable operators.
The impact on FGEN and the wider sector’s NAV of the two proposed outcomes is shown in Figure 1. FGEN’s diversified portfolio means that a lower percentage of its portfolio revenue (around 29%) is subject to RO and FIT incentives than its pureplay renewable peers, and as such, it may be less impacted.
Figure 1: Estimated NAV impact of proposed change to RO and FIT inflation measure
| Company | Option 1 (%) | Option 2 (%) |
|---|---|---|
| FGEN | (0.5) | (6.3) |
| Bluefield Solar | (2.0) | (10.0) |
| Foresight Solar | (1.6) | (10.2) |
| Greencoat UK Wind | (1.7) | (7.5) |
| NextEnergy Solar | (2.0) | (9.0) |
| Octopus Renewables Infrastructure | (1.1) | (4.0) |
| The Renewables Infrastructure Group | (0.5) | (2.2) |
Source: Company announcements
Option one impact FGEN the least among peers
The manager estimates that option one could reduce FGEN’s NAV by 0.5p per share or 0.5%, while option two could reduce the NAV by 6.6p, or 6.3%. In both scenarios, the manager states that dividend cover would not be materially impacted in the near-term.
The government is seeking to reduce energy bills and estimates that the changes under option one may result in the average household bill for 2026-27 falling by £4. This figure increases to £13 under the second option (before any costs such as an increase in the cost of capital).
The proposal follows the Office for National Statistics’s call for RPI to be dropped in favour of its preferred measure of CPIH, which includes housing costs, because RPI appears to have tended to over-estimate inflation, thereby increasing contractual payments linked to it. The government has not commented on why it is not proposing a change to CPIH.
The government said that using CPI to annually adjust the RO and FIT buyout price (which were withdrawn in 2017-2019 but will continue until 2037 for renewable energy operators that built wind and solar farms under the schemes) was “proportionate and fair”, ensuring a stable and predictable return for generators and savings for consumers. It added that this would also prevent the risk of overpayment, as occurred when energy prices and inflation soared after Russia’s invasion of Ukraine in 2022.
Manager’s view
Move could erode investor confidence in UK government
Unilaterally changing the terms of its contract with the renewables industry may undermine confidence in the sector and could create a precedent. It may also affect investor confidence in the UK government as a business partner at a time when private investment in UK infrastructure appears to be needed. The UK government’s actions are similar to those taken by the Spanish government in the mid-2010s, which retrospectively altered the terms of existing renewable energy projects, replaced FITs with new schemes, and levied a tax on electricity producers. According to reports, investor confidence was negatively affected and this led to a series of legal challenges that continue.
Interim results
FGEN reported a NAV of £652.7m or 104.7p per share at 30 September 2025, representing a 1.7% decrease over the six-month period. Including dividends of 3.94p, this equated to a 2.0% NAV total return in the period.
Distributions received from projects over the six months were £39.7m (six months to September 2024: £46.6m). This provided a dividend coverage of 1.22x and was used to fund further share buybacks. The value of the portfolio decreased by £13.8m over the period, as shown in Figure 2.
Figure 2: FGEN portfolio valuation in £m, as at 30 September 2025

Source: FGEN, Marten & Co
Drivers of portfolio returns
Several factors impacted FGEN’s NAV. We detail these factors and their sensitivities below, beginning with inflation.
Inflation
Short-term RPI inflation assumptions raised 50bps
Inflation assumptions used to value FGEN’s portfolio (based on actual data and independent forecasts) were raised 50bps to 4.0% RPI inflation for 2025 and 3.5% for 2026, then decreasing to 3% until 2030 and 2.25% thereafter. This change resulted in a £6.1m increase in NAV.
As discussed, the inflation measure used on RO and FIT contracts may revert to CPI next year. FGEN’s CPI inflation assumptions are 2.75% in 2025 and 2.25% thereafter. CPI was at 3.6% at the end of October 2025. Figure 3 shows RPI and CPI inflation over the past five years.
Figure 3: UK RPI and CPI year-on-year (%)

Source: ONS, Marten & Co
Power prices
Power prices have fallen slightly over the six months, as shown in Figure 4, and a marginal change in forecasts for future electricity and gas prices compared to forecasts at 31 March 2025 resulted in a £6.5m reduction in FGEN’s NAV.
Figure 4: UK power prices

Source: Bloomberg – UK baseload
Fixed prices secured on the majority of portfolio
FGEN seeks to fix the prices for most of its output, which may be intended to reduce its exposure to volatile market prices. At 30 September 2025, the portfolio had price fixes secured at 63% for the Winter 2025/26 season, 24% for the Summer 2026 season, and 25% for Winter 2026/27.
Over the life of the asset, an increase in electricity and gas prices of 10% may add £33.8m (or 5.4p) to NAV, and a 10% fall in power prices may reduce NAV by £33.1m (or 5.3p).
FGEN’s manager states that in the event that electricity prices fall to £40/MWh (they are currently at around £70/MWh) and gas prices fall by a corresponding amount, the company would maintain a resilient dividend cover for the next three financial years.
Discount rates
Figure 5: Long-term (10-year and 30-year) UK gilt yields

Source: Bloomberg, Marten & Co
The weighted average discount rate now sits at 10.1%
Despite a slight fall over recent months, UK gilt yields remain at elevated levels, as shown in Figure 5. The discount rates used to value FGEN’s portfolio remained unchanged. However, FGEN’s weighted average discount rate increased slightly to 10.1% (from 9.7%), which may be attributable to ongoing investment into growth assets and increases in their values. There was no change to NAV resulting from changes to the discount rate.
A reduction in the discount rate of 0.5% is estimated to result in an uplift in value of £19.4m (or 3.1p per share), while a downward movement in the portfolio valuation of £18.2m (2.9p per share) may occur if discount rates are increased by the same amount.
Asset allocation
FGEN holds a diversified portfolio among its renewable energy infrastructure peers, with current investments in 10 sectors across 39 projects. The manager divides the portfolio into three environmental infrastructure categories: renewable energy generation (71% of the portfolio – wind, solar, AD, biomass, energy from waste, and hydropower); other energy infrastructure (11% – battery energy storage and low carbon transport assets); and sustainable resource management (18% – waste and water management assets and controlled environment assets).
Figure 6: Portfolio value split by sector, as at 30 September 2025
Figure 7: Portfolio split by remaining asset life as at 30 September 2025

Source: FGEN, Marten & Co
Source: FGEN, Marten & Co
Figure 6 displays FGEN’s portfolio by project type, as at 30 September 2025. The weighted average remaining asset life of the portfolio was 16.2 years. The manager states that it is being conservative in this area, particularly in its AD portfolio.
Potential Life extensions for AD assets could result in a substantial valuation uplift
According to the manager, these assets are currently valued over the life of the renewable heat incentive subsidy (RHI) that they receive. The manager also states that there is growing evidence, including several market transactions, suggesting that these AD facilities could be valued beyond the end of the tariffs and potentially into perpetuity. The manager has modelled extension scenarios for its AD portfolio, including revenues being derived from corporate offtakes, green certificates and/or a lower level of government support mechanisms. The manager has modelled that this could result in a substantial valuation uplift of between £10m and £20m (1.6p to 3.2p) and significantly extend the weighted average life of the portfolio.
Some clarity appears to be required on the position that biomethane will take in the wider net zero and energy transition plans in the UK, with the government currently developing a biomethane policy framework, which the manager expects to be released next year.
The majority of its portfolio (88%) is located in the UK, with the remaining 12% outside the UK accounted for by FGEN’s Italian and Norwegian investments.
Figure 8: Portfolio split by operational status as at 30 September 2025
Figure 9: Net present value of future revenues by type as at 30 September 2025

Source: FGEN, Marten & Co
Source: FGEN, Marten & Co
FGEN’s construction exposure has reduced to 3%, with the Rjukan asset transferring to early-stage operations (detailed below).
The top 10 largest assets make up 54% of the total portfolio value. Figure 10 details the assets in FGEN’s portfolio, at 30 September 2025. The company reports low exposure to individual assets, with no asset accounting for more than 10% of the portfolio.
Figure 10: FGEN portfolio1 of projects by type, as at 30 September 2025
| Asset | Location | Type | Ownership | Capacity(MW) | Commercial operations date |
|---|---|---|---|---|---|
| Renewable energy generation | |||||
| Bilsthorpe | UK (Eng) | Wind | 100% | 10.2 | Mar 2013 |
| Burton Wold Extension | UK (Eng) | Wind | 100% | 14.4 | Sep 2014 |
| Carscreugh | UK (Scot) | Wind | 100% | 15.3 | Jun 2014 |
| Castle Pill | UK (Wal) | Wind | 100% | 3.2 | Oct 2009 |
| Dungavel | UK (Scot) | Wind | 100% | 26.0 | Oct 2015 |
| Ferndale | UK (Wal) | Wind | 100% | 6.4 | Sep 2011 |
| Hall Farm | UK (Eng) | Wind | 100% | 24.6 | Apr 2013 |
| Llynfi Afan | UK (Wal) | Wind | 100% | 24.0 | Mar 2017 |
| Moel Moelogan | UK (Wal) | Wind | 100% | 14.3 | Jan 2003 & Sep 2008 |
| New Albion | UK (Eng) | Wind | 100% | 14.4 | Jan 2016 |
| Wear Point | UK (Wal) | Wind | 100% | 8.2 | Jun 2014 |
| Biogas Meden | UK (Eng) | Anaerobic digestion | 49% | 5.0 | Mar 2016 |
| Egmere Energy | UK (Eng) | Anaerobic digestion | 49% | 5.0 | Nov 2014 |
| Grange Farm | UK (Eng) | Anaerobic digestion | 49% | 5.0 | Sep 2014 |
| Icknield Farm | UK (Eng) | Anaerobic digestion | 53% | 5.0 | Dec 2014 |
| Merlin Renewables | UK (Eng) | Anaerobic digestion | 49% | 5.0 | Dec 2013 |
| Peacehill Farm | UK (Scot) | Anaerobic digestion | 49% | 5.0 | Dec 2015 |
| Rainworth Energy | UK (Eng) | Anaerobic digestion | 100% | 5.0 | Sep 2016 |
| Vulcan Renewables | UK (Eng) | Anaerobic digestion | 49% | 5.0 | Oct 2013 |
| Warren Energy | UK (Eng) | Anaerobic digestion | 49% | 5.0 | Dec 2015 |
| Amber | UK (Eng) | Solar | 100% | 9.8 | Jul 2012 |
| Branden | UK (Eng) | Solar | 100% | 14.7 | Jul 2013 |
| CSGH | UK (Eng) | Solar | 100% | 33.5 | Mar 2014 & Mar 2015 |
| Monksham | UK (Eng) | Solar | 100% | 10.7 | Mar 2014 |
| Pylle Southern | UK (Eng) | Solar | 100% | 5.0 | Dec 2015 |
| Codford Biogas | UK (Eng) | Waste anaerobic digestion | 100% | 3.8 | 2014 |
| Bio Collectors | UK (Eng) | Waste anaerobic digestion | 100% | 11.7 | Dec 2013 |
| Cramlington Renewable Energy Developments | UK (Eng) | Biomass combined heat and power | 100% | 32.0 | 2018 |
| Energie Tecnologie Ambiente (ETA) | Italy | Energy-from-waste | 45% | 16.8 | 2012 |
| Northern Hydropower | UK (Eng) | Hydropower | 100% | 2.0 | Oct 2011 & Oct 2017 |
| Yorkshire Hydropower | UK (Eng) | Hydropower | 100% | 1.8 | Oct 2015 & Nov 2016 |
| Other energy infrastructure | |||||
| West Gourdie | UK (Scot) | Battery storage | 100% | n/a | May 2023 |
| Clayfords | UK (Scot) | Battery storage | 50% | n/a | Pre-construction |
| Sandridge | UK (Eng) | Battery storage | 50% | n/a | Under construction |
| Asset | Location | Type | Ownership | Capacity(MW) | Commercial operations date |
| CNG Fuels | UK (Eng) | Low carbon transport | Minority2 | n/a | Various |
| Sustainable resource management | |||||
| Glasshouse | UK (Eng) | Controlled environment | 10% | n/a | Mar 2025 |
| Rjukan | Norway | Controlled environment | 25% | n/a | Early stage operations |
| ELWA | UK (Eng) | Waste management | 80% | n/a | 2006 |
| Tay | UK (Scot) | Wastewater treatment | 33% | n/a | Nov 2001 |
Source: FGEN, Marten & Co. Note 1) excludes projects in FEIP’s portfolio. Note 2) FGEN holds 25% of CNG Foresight Holdings Ltd, which owns 60% of the shares in CNG Fuels Ltd (FGEN look-through interest 15%) and holds £150.15m in 10% preferred return investments issued by CNG Fuels (FGEN interest £37.5m).
As part of FGEN’s re-focus on core environmental assets, its three growth assets – the two controlled environment projects (the Glasshouse and Rjukan) and the CNG portfolio – are expected to be sold over the medium term once operations have ramped up and their valuation uplifts have been recorded. All three were profiled in the previous note, a link to which can be found on page 16.
The valuation of Rjukan asset rose as it transitions from construction to operational
All three assets have progressed in line with the manager’s expectations. The value of the Rjukan land-based trout farm in Norway increased as it transitioned from construction to early-stage operational, with the first harvest and sales occurring in the summer. It moved from being valued at cost to the DCF method, and increased in value by £2.9m over six months. FGEN’s manager states that the valuation will increase further as operations are ramped up.
Operations at CNG Fuels also grew, with volumes of gas dispensed (+15%), truck numbers (+18%) and pricing (+21%) all increasing over the year. This appears to have contributed to a £2.2m uplift in value for the asset.
Meanwhile, the Glasshouse reported additional sales and market penetration, with customers now including six of the eight largest clinics in the UK. The business has set a target of reaching cash flow break-even in the new year, ahead of a planned full ramp-up by 2026/27.
Portfolio activity
FGEN sold its stake in a BESS project and is considering options on another BESS asset
There has been limited activity in acquisitions and disposals since the previous note in July. FGEN sold its 50% stake in the Lunanhead battery energy storage (BESS) project for £1.25m, which was in line with book value, in August. The sale was made instead of making a follow-on investment in the project. The manager states that it is continuing to explore options for the Clayfords BESS asset, in which it owns a 50% stake.
The company made several follow-on investments over the six months totalling £7.9m, including into the CNG platform and into Vulcan Renewables.
FGEN’s solar assets exceeded generation targets by 6.2% in the period, but this was offset by the performance of its wind assets, which was 6.5% below target. FGEN’s largest asset, the Cramlington biomass scheme (which accounts for 9% of portfolio value), generated 44.3% below target in the six months to the end of September, which the company states was due to a six-week extension of a planned outage in July. FGEN’s manager has advanced a liquidated damages claim with the O&M contractor and states that the shortfall is expected to reduce to 9.5% once the minimum expected compensations are received.
Performance
FGEN’s NAV returns over the past three years have been flat. The company and the renewable energy infrastructure sector have faced headwinds over the period, which may have contributed to portfolio valuation declines. Portfolio revenues have allowed for a progressive dividend distribution, which has offset the fall in asset value.
Figure 11: FGEN NAV TR over five years to 30 September 2025

Source: Bloomberg, Marten & Co
Figure 12: FGEN cumulative performance to 30 September 2025
| 3 months (%) | 6 months (%) | 1 year (%) | 3 years (%) | 5 years (%) | |
|---|---|---|---|---|---|
| FGEN NAV total return | 2.0 | 2.1 | 2.7 | 1.9 | 52.4 |
| FGEN share price total return | (10.5) | 2.7 | (14.6) | (24.8) | (14.8) |
Source: Bloomberg, Marten & Co
Peer group
Figure 13: AIC renewable energy infrastructure sector comparison table, as at 15 December 2025
| Market cap (£m) | Premium/(discount) (%) | Yield(%) | Ongoing charge (%) | |
|---|---|---|---|---|
| FGEN | 422 | (35.3) | 11.8 | 1.24 |
| Aquila Energy Efficiency | 20 | (46.1) | 0.0 | 3.80 |
| Aquila European Renewables Income | 121 | (38.3) | 14.1 | 1.10 |
| Bluefield Solar Income | 401 | (41.1) | 13.2 | 1.02 |
| Ecofin US Renewables Infrastructure | 21 | (50.3) | 2.3 | 2.30 |
| Foresight Solar | 358 | (38.7) | 12.5 | 1.17 |
| Gore Street Energy Storage Fund | 272 | (40.2) | 13.0 | 1.38 |
| Greencoat Renewables | 683 | (30.4) | 9.7 | 1.18 |
| Greencoat UK Wind | 2,106 | (31.5) | 10.6 | 0.95 |
| Gresham House Energy Storage | 461 | (30.4) | 6.8 | 1.29 |
| Hydrogen Capital Growth | 19 | (59.0) | 0.0 | 2.53 |
| NextEnergy Solar | 291 | (42.9) | 16.7 | 1.18 |
| Octopus Renewables Infrastructure | 314 | (39.8) | 10.4 | 1.21 |
| SDCL Efficiency Income | 572 | (40.9) | 12.0 | 1.16 |
| The Renewables Infrastructure Group | 1,651 | (36.9) | 10.8 | 1.04 |
| US Solar Fund | 79 | (45.2) | 10.1 | 1.54 |
| VH Global Energy Infrastructure | 249 | (41.4) | 9.2 | 1.50 |
| Peer group median | 314 | (40.2) | 10.6 | 1.21 |
| FGEN rank | 6/17 | 4/17 | 7/17 | 10/17 |
Source: QuotedData website
You can access up-to-date information on FGEN and its peers on the QuotedData website.
FGEN has one of the broadest remits among the 17 companies that comprise the members of the AIC’s renewable energy sector. Most of these funds are focused on solar or wind, or some combination of the two. Two of these funds are focused solely on energy storage. There is variation in geographic exposure within the peer group, with a number of funds that are heavily exposed to the North American market, which has a different risk/reward structure.
The sector has been shrinking over the past 12 months through a combination of private acquisitions, which may be related to the wide discounts in the sector, or through managed wind-downs. Downing Renewables & Infrastructure has exited since the last note, while Aquila Energy Efficiency and Hydrogen Capital Growth are in a managed wind-down. Bluefield Solar Income put itself up for sale in November after shareholders voted against a proposal for it to merge with its manager, Bluefield Partners.
The proposed merger of The Renewables Infrastructure Group (TRIG) and infrastructure trust HICL Infrastructure (which are both managed by InfraRed Capital) was abandoned in early December after a HICL shareholder revolt. TRIG is facing a continuation vote in 2026.
FGEN is one of the larger funds within this peer group. Its discount is narrower than most, and the whole sector appears to have derated following the government proposals on bringing forward a change in the inflation measure on ROs and FITs. Wide discounts have affected yields across the sector. FGEN’s yield is 1.22x covered. Its ongoing charges ratio is in the middle range compared to peers, and is expected to fall when the impact of a reduction in the management fee occurs.
Figure 14: AIC renewable energy infrastructure sector NAV total return performance comparison table, as at 1 December 2025
| 1 year(%) | 3 years(%) | 5 years(%) | 10 years(%) | |
|---|---|---|---|---|
| FGEN | 2.7 | 0.6 | 8.8 | 7.3 |
| Aquila Energy Efficiency | (19.3) | (7.1) | – | – |
| Aquila European Renewables Income | (28.3) | (14.5) | (5.7) | – |
| Bluefield Solar Income | (2.8) | (0.5) | 6.8 | 7.8 |
| Ecofin US Renewables Infrastructure | (39.9) | (25.1) | – | – |
| Foresight Solar | (2.4) | (0.5) | 8.3 | 7.1 |
| Gore Street Energy Storage Fund | (6.0) | (0.7) | 4.7 | – |
| Greencoat Renewables | 3.6 | 4.2 | 5.9 | – |
| Greencoat UK Wind | (5.0) | 9.3 | 9.7 | 9.4 |
| Gresham House Energy Storage | 6.1 | (6.7) | 6.7 | – |
| Hydrogen Capital Growth | (59.1) | (24.4) | – | – |
| NextEnergy Solar | (0.7) | (2.9) | 5.3 | 5.6 |
| Octopus Renewables Infrastructure | 0.8 | 1.8 | 5.5 | – |
| SDCL Efficiency Income | 1.9 | (0.4) | 2.8 | – |
| The Renewables Infrastructure Group | (3.7) | (0.9) | 5.4 | 7.4 |
| US Solar Fund | (16.5) | (11.2) | (3.0) | – |
| VH Global Energy Infrastructure | 1.5 | 3.5 | – | – |
| Peer group median | (2.8) | (0.7) | 5.5 | 7.3 |
| FGEN rank | 3/17 | 5/17 | 2/13 | 4/6 |
Source: QuotedData website
Premium/(discount)
FGEN’s discount had been narrowing from all-time lows at the start of this year; however, government proposals to bring forward the change in the inflation measure for incentives appeared to coincide with the discount widening (along with the wider peer group).
Over the year to 30 September 2025, FGEN’s shares traded in a range of a 17.4% to a 38.8% discount to NAV, and averaged a discount of 28.6%. FGEN’s discount at 15 December 2025 was 35.3%, which was wider than its 12-month average.
Figure 15: FGEN premium/(discount) (%) over five years to 30 September 2025

Source: Bloomberg, Marten & Co
Fund profile
Further information can be found at FGEN.com
FGEN invests in a diversified portfolio of private infrastructure assets that are intended to deliver stable returns, long-term predictable income, and opportunities for growth while supporting decarbonisation and sustainable resource management.
FGEN invests in three core areas of environmental infrastructure: renewable energy generation, other energy infrastructure, and sustainable resource management. Renewable energy generation investments include wind, solar, AD, biomass, energy from waste, and hydropower. Other energy infrastructure assets include battery energy storage and low carbon transport. Sustainable resource management includes wastewater, waste processing, and sustainable solutions for food production such as agri- and aquaculture-controlled environment projects.
FGEN’s portfolio is diversified across sectors, technologies, and geographies, which may reduce its exposure to fluctuations in weather patterns and could differentiate the company from its peers.
FGEN’s mandate allows it to invest in emerging areas of environmental infrastructure, provided that they are sufficiently mature and display infrastructure characteristics.
FGEN’s AIFM is Foresight Group LLP (Foresight). Foresight had £13.6bn of AUM at 30 September 2025. This includes Foresight Solar Fund, which is in FGEN’s peer group. Foresight has a global infrastructure team with 185 infrastructure professionals managing around 5.0GW of energy infrastructure. It is a global business, with offices in seven countries. The co-lead managers for FGEN are Chris Tanner, Edward Mountney and Charlie Wright.
Previous publications
You can read our previous notes on FGEN by clicking on them below or by visiting our website.
Figure 18: QuotedData’s previously published notes on FGEN
| Title | Note type | Date |
|---|---|---|
| Diverse renewables exposure | Initiation | 6 September 2017 |
| Anaerobic diversification | Update | 6 March 2018 |
| Diversification benefits shine through | Annual overview | 12 September 2018 |
| Life extensions to boost NAV? | Update | 15 March 2019 |
| Battery storage potential | Annual overview | 9 September 2019 |
| Reliable source of income | Update | 14 May 2020 |
| Increasingly diversified as green-led recovery looms | Annual overview | 16 February 2021 |
| On the front foot | Update | 4 August 2021 |
| It’s all about renewables | Annual overview | 29 March 2022 |
| Further portfolio diversification | Update | 29 September 2022 |
| Laying the foundations for NAV growth | Annual overview | 31 March 2023 |
| Backing the green hydrogen revolution | Update | 28 November 2023 |
| Vote against discontinuation | Annual overview | 17 July 2024 |
| Looking to bounce back | Update | 3 December 2024 |
| Strategic refresh | Annual overview | 21 July 2025 |
Source: Marten & Co
IMPORTANT INFORMATION
Marten & Co (which is authorised and regulated by the Financial Conduct Authority) was paid to produce this note on Foresight Environmental Infrastructure Plc.
This note is for information purposes only and is not intended to encourage the reader to deal in the security or securities mentioned within it. Marten & Co is not authorised to give advice to retail clients. The research does not have regard to the specific investment objectives financial situation and needs of any specific person who may receive it.
The analysts who prepared this note are not constrained from dealing ahead of it but, in practice, and in accordance with our internal code of good conduct, will refrain from doing so for the period from which they first obtained the information necessary to prepare the note until one month after the note’s publication. Nevertheless, they may have an interest in any of the securities mentioned within this note.
This note has been compiled from publicly available information. This note is not directed at any person in any jurisdiction where (by reason of that person’s nationality, residence or otherwise) the publication or availability of this note is prohibited.
Accuracy of Content: Whilst Marten & Co uses reasonable efforts to obtain information from sources which we believe to be reliable and to ensure that the information in this note is up to date and accurate, we make no representation or warranty that the information contained in this note is accurate, reliable or complete. The information contained in this note is provided by Marten & Co for personal use and information purposes generally. You are solely liable for any use you may make of this information. The information is inherently subject to change without notice and may become outdated. You, therefore, should verify any information obtained from this note before you use it.
No Advice: Nothing contained in this note constitutes or should be construed to constitute investment, legal, tax or other advice.
No Representation or Warranty: No representation, warranty or guarantee of any kind, express or implied is given by Marten & Co in respect of any information contained on this note.
Exclusion of Liability: To the fullest extent allowed by law, Marten & Co shall not be liable for any direct or indirect losses, damages, costs or expenses incurred or suffered by you arising out or in connection with the access to, use of or reliance on any information contained on this note. In no circumstance shall Marten & Co and its employees have any liability for consequential or special damages.
Governing Law and Jurisdiction: These terms and conditions and all matters connected with them, are governed by the laws of England and Wales and shall be subject to the exclusive jurisdiction of the English courts. If you access this note from outside the UK, you are responsible for ensuring compliance with any local laws relating to access.
No information contained in this note shall form the basis of, or be relied upon in connection with, any offer or commitment whatsoever in any jurisdiction.
Investment Performance Information: Please remember that past performance is not necessarily a guide to the future and that the value of shares and the income from them can go down as well as up. Exchange rates may also cause the value of underlying overseas investments to go down as well as up. Marten & Co may write on companies that use gearing in a number of forms that can increase volatility and, in some cases, to a complete loss of an investment.