
Gathering momentum
BlackRock American Income (BRAI) appears to be strengthening in its new form. Consistent outperformance of its benchmark and peers since April 2025’s revamp is attracting investors, while strong returns are supporting higher dividends. The company is re-issuing shares and nearing a £200m market value. It could soon reach thresholds that attract larger wealth managers, potentially accelerating its growth, lowering average running costs and making its shares easier to trade.
As this note explains, recent benchmark rebalancing has refreshed BRAI’s investment opportunities. Investors concerned about US share valuations may take comfort from its portfolio’s substantial valuation discount to the wider US market. The manager remains convinced that BRAI’s preference for value stocks – shares considered cheap relative to their underlying worth – will serve it well over the medium term.
Attractive income and growth from US value stocks, using a systematic active equity approach
BRAI aims to provide long-term capital growth, whilst paying an attractive level of income (1.5% of NAV per quarter, around 6% of NAV per annum). BRAI follows a systematic active equity approach that aims to provide consistent outperformance of the Russell 1000 Value Index.
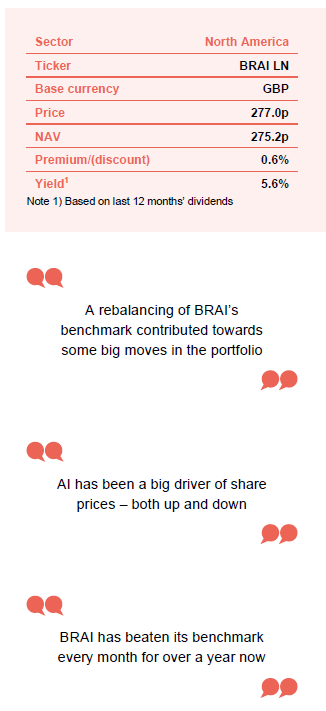
At a glance
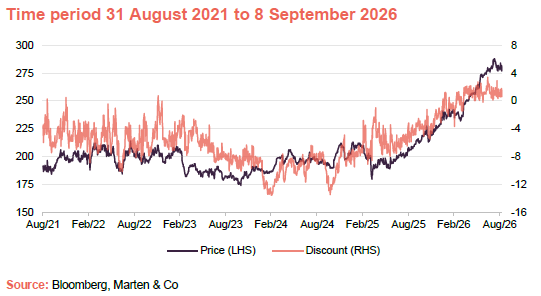
Share price and premium/(discount)
BRAI’s share price discount to net asset value (NAV) widened in 2023 as the Magnificent 7 dominated markets and value stocks underperformed. Its rating began improving in October 2024, initially ahead of an anticipated tender offer. The new strategy’s success appears to have encouraged investors, with growing buying interest helping shares reach a premium to NAV this year. This has enabled BRAI to reissue shares.
Performance since strategy change
BRAI has delivered consistent outperformance of its benchmark for many months now. As we discuss later in this note, BRAI benefitted from exposure to some of the stocks that have soared in the wake of the AI capital expenditure boom while avoiding some of the software stocks that are threatened by the advance of AI.
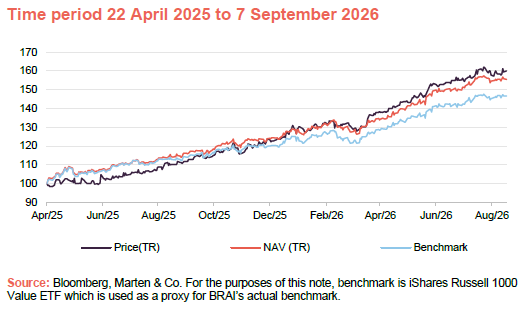
| 12 months ended | Share price total return (%) | NAV total return (%) | Benchmark (%) |
|---|---|---|---|
| 31/08/2026 | 43.0 | 36.5 | 30.0 |
Fund profile
More information is available on the trust’s website
BRAI aims to derive capital growth and pay an attractive income by investing in a portfolio of US value stocks.
In April 2025, the company overhauled its structure and approach, halved its management fee and introduced quarterly dividends of 1.5% of net asset value, funded from both revenue and capital.
A more detailed look at BRAI’s structure and investment process was included within our initiation note
Stocks are selected using BlackRock’s systematic active equity approach, detailed in our initiation note and summarised below:
BlackRock’s Systematic Active Equity (SAE) team of over 100 investment professionals seeks to use data-derived insights to spot and exploit market inefficiencies (mispriced stocks).
The approach draws on over 40 years of insights into what works and what does not work when it comes to active investment management.
The SAE team evaluates sets of data to produce insights into companies’ fundamentals, market sentiment, and macroeconomic themes. The analysis includes both numeric and text datasets (contributing to over 1,000 signals in total) and makes use of LLM models that have been developed and optimised over many years.
Once the manager has a set of signals that it thinks is providing useful information, the scores from these signals are blended to give a view on each stock in the universe.
Higher scores translate into higher return expectations, and this informs portfolio construction, which seeks the best possible trade-off between risk and return net of transaction costs. The manager ensures that there are no big factor, sector, or stock bets that can skew returns. BRAI will hold 150–250 stocks of a universe of 870.
New signals are constantly being identified and evaluated. BRAI’s manager describes this as an “arms race” where the aim is to extract as much information about stocks and the economy as possible, and learn how to interpret that. BlackRock’s scale, depth of resource, and long history in this area gives it an edge that is hard to replicate.
Backdrop
Gasoline prices are well above pre-war levels but inflation is not as high as feared
War between the US/Israel and Iran broke out one day after our last report on 27 February 2026, sending oil prices soaring, raising inflation concerns and shifting market interest rate expectations from likely cuts to possible rises. Oil prices have fluctuated as hopes for a lasting resolution rose and fell, but remain elevated. Petrol prices have fallen from recent peaks, contributing to below-forecast US inflation of 3.4% at end July 2026, but remain well above pre-war levels.
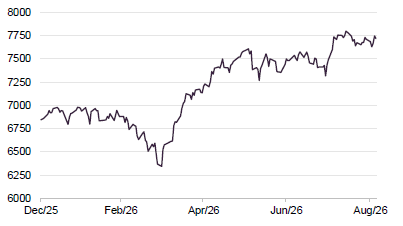
Nevertheless, the US S&P 500 Index in Figure 2 has performed well year-to-date, especially since March’s lows.
Figure 1: Oil price
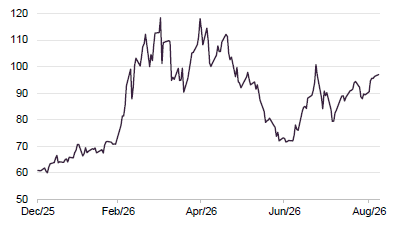
Figure 2: S&P 500
AI has been a big driver of share prices – both up and down
AI has driven markets. In particular the capital expenditure needed to support it and the potential impact of advances in agentic AI on software and data businesses – the so-called SaaSpocalypse.
Suppliers of semiconductor equipment, memory, optical connections and data-centre infrastructure in BRAI’s benchmark saw sharp share price gains. Micron Technology rose 277% between 30 March 2026 and 25 June 2026. However, some investors increasingly question whether the largest cloud companies can finance this spending and what returns it will generate. This is reflected in the Magnificent 7’s relative performance, as Figure 3 shows.
Figure 3: Mag 7 relative to rest of S&P500
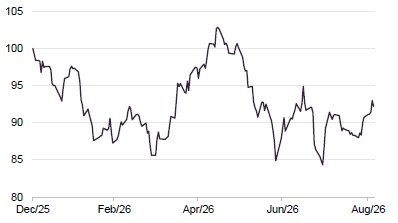
Figure 4: Yield on long-dated US Treasuries
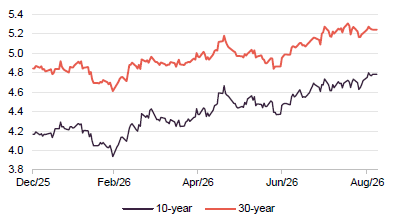
Despite US inflation remaining well above its 2% target, the Federal Reserve has held interest rates steady this year. Long-dated US government bond yields have risen amid growing market concerns over a potential $2trn deficit in 2026 and its sustainability. Higher-for-longer rates favour value over growth strategies.
Asset allocation
At the end of June 2026, BRAI held 155 stocks, two more than at end-December 2025, the date of our previous report’s data, and near the bottom of its 150–250 target range.
The manager’s end-June data shows the portfolio’s weighted average price/earnings (P/E) ratio, price-to-book ratio and return on equity (ROE) were close to benchmark averages but significantly below the wider market’s.
Figure 5: Comparison of BRAI with US indices as at 30 June 2026
| BRAI | Benchmark | S&P 500 | |
|---|---|---|---|
| Number of securities | 155 | 870 | 504 |
| Average market cap ($bn) | 555.8 | 511.7 | 1,058.3 |
| P/E next 12 months (x) | 17.3 | 17.9 | 21.3 |
| Price/book (x) | 3.35 | 3.22 | 5.66 |
| Dividend yield (%) | 1.6 | 1.6 | 1.0 |
| ROE (5-year average) (%) | 14.0 | 14.8 | 12.6 |
Benchmark index rebalancing
A rebalancing of BRAI’s benchmark contributed towards some big moves in the portfolio
BRAI’s benchmark index is now rebalanced every six months, partly based on company size. In June, stocks can also be reclassified from value to growth or vice versa.
Stocks are ranked using one value measure, the ratio of book value to share price, weighted at 50%. Two growth measures — two-year forecast earnings growth and historical five-year sales growth — make up the remaining 50%. Stocks can be classified as entirely value or growth, but most combine both.
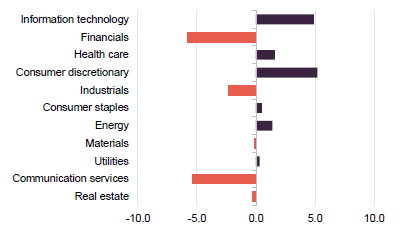
The substantial shift at the end of June triggered significant changes in BRAI’s portfolio, shown in the following charts.
Increased exposure to information technology and consumer discretionary, alongside reductions in financials and communication services, mainly reflects changes to the benchmark’s composition.
Consumer discretionary exposure rose as Amazon became the benchmark’s largest stock, accounting for 5.95% of the index at the end of June, according to BRAI. Information technology exposure increased with the addition of Apple and Microsoft to the benchmark, partly offset by stocks such as Micron, Sandisk and Western Digital moving to the growth index.
Figure 6: BRAI asset allocation by sector as at 31 July 2026
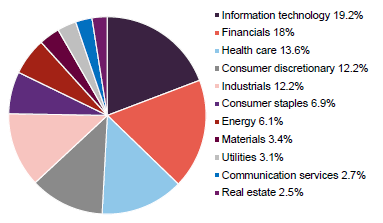
Figure 7: BRAI changes to sector allocations since 31 December 2025
As noted earlier, the manager aims to avoid large differences from the benchmark in investment styles, sectors or individual stocks. Changes to the list of the 10 largest holdings reflect this approach.
Top 10 holdings
Figure 8: Top 10 holdings as at 31 July 2026 compared to 31 May 2026
| % as at 31/07/26 | % as at 31/05/26 | Change | ||
|---|---|---|---|---|
| Amazon | Consumer discretionary | 6.8 | 2.5 | 4.3 |
| Apple | Information technology | 5.3 | 0.4 | 4.9 |
| Microsoft | Information technology | 4.6 | 0.6 | 4.0 |
| Berkshire Hathaway | Financials | 2.9 | 2.6 | 0.3 |
| JPMorgan Chase | Financials | 2.6 | 2.3 | 0.3 |
| Exxon Mobil | Energy | 1.9 | 2.1 | (0.2) |
| Bank of America | Financials | 1.8 | 1.9 | (0.1) |
| Chevron | Energy | 1.6 | 1.8 | (0.2) |
| Procter & Gamble | Consumer staples | 1.5 | 1.8 | (0.3) |
| Goldman Sachs | Financials | 1.4 | n/a | n/a |
| Total of top 10 | 30.4 | 25.1 |
From end-December 2025 to end-May 2026, Exxon Mobil, Procter & Gamble and Chevron replaced Walmart, Meta Platforms and Charles Schwab in the top 10.
Following the 30 June rebalancing, the Amazon holding increased markedly and a new Apple position was opened. Goldman Sachs was the only other new top 10 entrant at 31 July 2026. Morgan Stanley, Alphabet and Micron Technology dropped out after the rebalancing.
Performance
Up to date information is available on our website
We consider analysis of BRAI’s returns before the strategy change irrelevant to this note. Figure 9 compares its share price and net asset value returns with its performance benchmark, the S&P 500 Index and the median for its AIC North America peers: Baillie Gifford US Growth, Canadian General Investments, JPMorgan American, Pershing Square Holdings and The North American Income Trust. BRAI ranks first within this group across all periods shown, with much less variation in returns than its peers.
Figure 9: Total return performance data for periods to end July 2026
| Calendar year | 1 month (%) | 3 months (%) | 6 months (%) | 1 year (%) | Since 22 April 20251 | 3 years (%) | 5 years (%) |
|---|---|---|---|---|---|---|---|
| BRAI share price | 1.5 | 7.8 | 18.7 | 43.0 | 58.3 | 78.3 | 85.0 |
| BRAI NAV | 1.6 | 9.5 | 16.7 | 36.5 | 55.5 | 62.6 | 74.7 |
| Benchmark | 2.1 | 8.3 | 14.7 | 30.0 | 46.9 | 60.8 | 77.2 |
| S&P 500 | 2.5 | 1.5 | 12.1 | 20.5 | 46.1 | 66.3 | 85.9 |
| Peer group median | 1.6 | 6.3 | 8.4 | 22.6 | 45.4 | 58.9 | 74.7 |
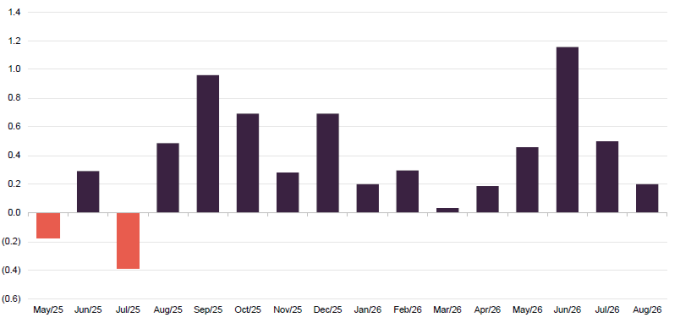
Figure 10 shows BRAI’s monthly relative returns, highlighting strong, consistent outperformance over the past year.
Figure 10: BRAI NAV total return relative performance by month
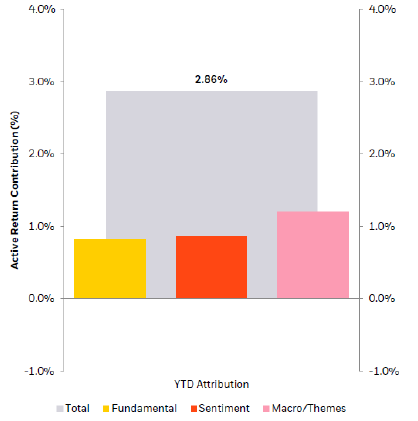
Figures 11 and 12 show the manager’s analysis of BRAI’s returns for the first half of 2026. In Figure 11, yellow dots show average overweight and underweight positions against the benchmark; bars show each sector’s contribution to returns. Figure 12 shows that all signals contributed positively to returns.
Figure 11: Attribution by sector
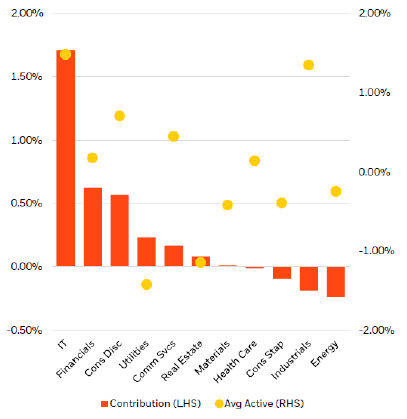
Figure 12: Attribution by signal
The IT sector’s significant contribution was driven by rising share prices linked to AI investment, including Micron, Applied Materials, LAM Research, Western Digital and Sandisk. As described above, some have since left BRAI’s benchmark and portfolio. BRAI captured their gains but avoided the subsequent falls following the index rebalancing.
BRAI’s stock-selection model analyses companies’ supply chains and helps predict customer demand. The manager says it identified a wide range of beneficiaries of AI investment, recognising the research and development spending supporting their growth. BRAI anticipated the shift as businesses previously seen as dull, cash-generative and slow-growing saw orders multiply and profit margins widen.
BRAI outperformed the wider market partly by avoiding highly valued software and data businesses caught in the sell-off earlier this year. Investors panicked over the potential for AI tools that act independently, such as Claude Cowork, to disrupt business models. High valuations were not the only reason BRAI had no exposure: its model had already identified the threat from these tools.
BRAI’s interim report had a table of contributors to and detractors from its relative returns over the six months ended 30 April 2026, the top five of each we have reproduced below.
Figure 13: BRAI five largest contributions to relative returns over six months ended 30 April 2026
| Stock | Sector | BRAI weight (%) | Benchmark weight (%) | Active weight (%) | Contribution (%) |
|---|---|---|---|---|---|
| Micron Technology | Information technology | 2.2 | 1.8 | 0.5 | 0.5 |
| Devon Energy | Energy | 0.5 | 0.1 | 0.4 | 0.5 |
| Bristol Myers Squibb | Health care | 1.4 | 0.3 | 1.1 | 0.3 |
| Moderna | Health care | 0.0 | 0.1 | (0.1) | 0.3 |
| Lam Research | Information technology | 0.4 | 0.0 | 0.4 | 0.3 |
Health care recovered as investors saw drugmakers’ deals with the US government on pricing and overseas manufacturing as easing government intervention risks. Merger and acquisition activity also increased.
Figure 14: BRAI five largest detractors from relative returns over six months ended 30 April 2026
| Stock | Sector | BRAI weight (%) | Benchmark weight (%) | Active weight (%) | Contribution (%) |
|---|---|---|---|---|---|
| Exxon Mobil | Energy | 2.1 | 2.0 | 0.1 | (0.4) |
| Boston Scientific | Health care | 0.6 | 0.2 | 0.4 | (0.4) |
| Texas Instruments | Information technology | 0.0 | 0.5 | (0.5) | (0.2) |
| Merck &Co | Health care | 0.0 | 0.8 | (0.8) | (0.2) |
| Corning | Information technology | 0.0 | 0.4 | (0.4) | (0.2) |
Dividends
Enhanced dividend policy roughly 6% of NAV each year
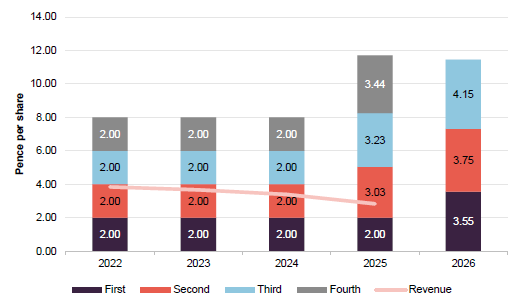
BRAI has long funded part of its dividend from capital. Since April 2025, its quarterly dividend has been set at 1.5% of NAV, or approximately 6% annually. Without needing high-yielding stocks for income, BRAI can invest across the US market to maximise total returns.
Figure 15 shows five years of dividends. On 3 August 2026, BRAI announced its third interim dividend, payable on 11 September 2026.
Based on NAV at publication, the next dividend would be 4.15p, bringing the current financial year’s total to 15.6p, up 33% on the previous year.
Figure 15: BRAI five-year dividend history for financial years ending in October
Premium/(discount)
BRAI’s shares averaged a 0.9% discount to NAV in the year to 31 August 2026, ranging from a 5.9% discount to a 3.4% premium. The discount closed by 25 February 2026; at publication, shares traded at a 0.6% premium.
Figure 16: BRAI’s premium/(discount) over the five years ended 31 August 2026
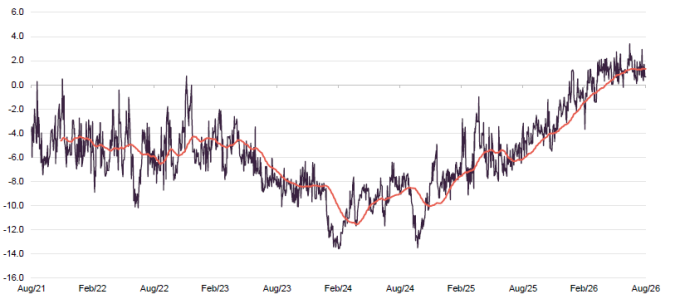
BRAI’s discount widened in 2023 as the Magnificent 7 dominated markets and value stocks underperformed. Its rating began improving in October 2024, initially ahead of an anticipated tender offer. The new strategy’s success appears to have encouraged investors, with growing buying interest helping shares reach a premium to NAV this year. This enabled BRAI to reissue shares, as detailed below.
Issuing shares above NAV increases NAV for existing shareholders, makes shares easier to trade and spreads fixed overheads across a larger base, reducing average running costs.
Conditional tender offers
BRAI has committed to a 100% tender offer at a 2% discount to NAV less costs if it fails to beat its benchmark after fees by an average 0.5% annually over three-year periods, the first ending 30 April 2028. The offer may also be triggered if net assets are below £125m at those period-ends.
Share issuance and repurchase
On 27 August 2026, BRAI published a circular calling a shareholder meeting for 14 September 2026 to approve new shares equivalent to up to 30% of its share capital at 21 August 2026. We expect approval, saving the cost of frequent meetings for smaller share issues and enabling significant re-expansion of the trust. This should improve liquidity, lower average running costs by spreading fixed costs across a larger base, and attract larger wealth managers.
At publication, BRAI had 69,620,138 shares in issue with voting rights and a further 25,741,167 shares held in treasury.
Figure 17: Share issuance/repurchases over the past 12 months
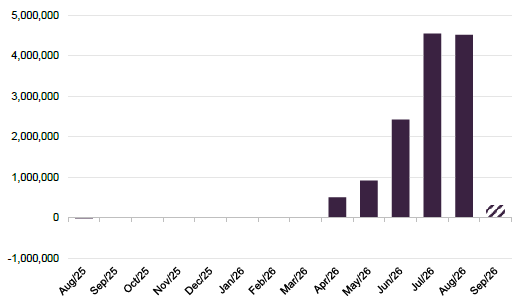
In April 2025, before the strategy change, BRAI bought back 10,910,252 shares into treasury at 192.0501p each through a tender offer. Shares have since risen 47%. We welcome BRAI’s renewed expansion, with over 13.2m shares issued in the last six months.
SWOT and bull vs. bear analysis
Figure 18: SWOT analysis
| Strengths | Weaknesses |
|---|---|
| Differentiated investment proposition | Investors need to get comfortable with the investment approach |
| Enhanced income whilst maintaining risk-controlled exposure to US equities | Relatively low market cap restricts attraction for wealth managers (albeit this is changing quickly) |
| Encouraging early performance | |
| Considerable backing of BlackRock | |
| Opportunities | Threats |
| Discount has been eliminated; trust is re-expanding | Persistent US dollar weakness might undermine attraction for UK investors |
| Recent market moves mean that US investors are thinking more about diversification | Growth stocks might return to favour |
| Value is benefitting from rising US borrowing costs |
Figure 19: Bull versus bear case
| Bull | Bear | |
|---|---|---|
| Performance | Building a good track record with consistent outperformance and lower volatility | Perception that US equities are expensive could mean markets retrench at some point |
| Dividends | Dividend policy results in attractive yield | If markets fell for an extended period, the dividend policy would shrink the capital base of the company |
| Outlook | Value is picking up and a more decisive shift in sentiment could maintain BRAI’s run of good relative performance | Weak dollar and return to outperformance by growth stocks are both possibilities |
| Discount | Trading at a premium and reissuing stock on a regular basis | If sentiment changed to the extent that buybacks were needed, BRAI’s small size reduces the impact of buybacks as liquidity worsens |
Previous publications
Readers interested in further information about BRAI may wish to read our previous notes.
Figure 20: QuotedData’s previously published notes on BRAI
| Title | Note type | Date |
|---|---|---|
| And now for something completely different | Initiation | 27 November 2025 |
| On the up | Update | 27 February 2026 |
IMPORTANT INFORMATION
Marten & Co (which is authorised and regulated by the Financial Conduct Authority) was paid to produce this note on BlackRock American Income Trust Plc.
This note is for information purposes only and is not intended to encourage the reader to deal in the security or securities mentioned within it.
Marten & Co is not authorised to give advice to retail clients. The research does not have regard to the specific investment objectives financial situation and needs of any specific person who may receive it.
The analysts who prepared this note are not constrained from dealing ahead of it but, in practice, and in accordance with our internal code of good conduct, will refrain from doing so for the period from which they first obtained the information necessary to prepare the note until one month after the note’s publication. Nevertheless, they may have an interest in any of the securities mentioned within this note.
This note has been compiled from publicly available information. This note is not directed at any person in any jurisdiction where (by reason of that person’s nationality, residence or otherwise) the publication or availability of this note is prohibited.
Accuracy of Content: Whilst Marten & Co uses reasonable efforts to obtain information from sources which we believe to be reliable and to ensure that the information in this note is up to date and accurate, we make no representation or warranty that the information contained in this note is accurate, reliable or complete. The information contained in this note is provided by Marten & Co for personal use and information purposes generally. You are solely liable for any use you may make of this information. The information is inherently subject to change without notice and may become outdated. You, therefore, should verify any information obtained from this note before you use it.
No Advice: Nothing contained in this note constitutes or should be construed to constitute investment, legal, tax or other advice.
No Representation or Warranty: No representation, warranty or guarantee of any kind, express or implied is given by Marten & Co in respect of any information contained on this note.
Exclusion of Liability: To the fullest extent allowed by law, Marten & Co shall not be liable for any direct or indirect losses, damages, costs or expenses incurred or suffered by you arising out or in connection with the access to, use of or reliance on any information contained on this note. In no circumstance shall Marten & Co and its employees have any liability for consequential or special damages.
Governing Law and Jurisdiction: These terms and conditions and all matters connected with them, are governed by the laws of England and Wales and shall be subject to the exclusive jurisdiction of the English courts. If you access this note from outside the UK, you are responsible for ensuring compliance with any local laws relating to access.
No information contained in this note shall form the basis of, or be relied upon in connection with, any offer or commitment whatsoever in any jurisdiction.
Investment Performance Information: Please remember that past performance is not necessarily a guide to the future and that the value of shares and the income from them can go down as well as up. Exchange rates may also cause the value of underlying overseas investments to go down as well as up. Marten & Co may write on companies that use gearing in a number of forms that can increase volatility and, in some cases, to a complete loss of an investment.