
Defensively positioned, cautious on inflation
According to the managers of Capital Gearing Trust (CGT), there may be reasons for caution regarding the outlook for markets and inflation, and they have positioned the portfolio in response. The portfolio’s exposure to risk assets was reduced to 25% at the end of November 2025, and holdings of UK inflation-linked bonds were increased.
Within the risk assets portfolio, the managers took action to oppose a merger proposal for HICL Infrastructure, leading a campaign group of HICL shareholders against the deal. The HICL share price has since increased. This episode illustrates the type of work that CG Asset Management (CGAM) undertakes, typically in the background, to seek to narrow discounts across the UK-listed investment companies sector.
Preserve and grow shareholders’ real wealth
CGT aims to preserve and grow its shareholders’ real wealth over time. Whilst it has a long-term investment horizon, it has an aversion to short-term losses. That means that greater emphasis is placed on avoiding loss than on maximising returns. It targets returns in sterling that are ahead of inflation over the long term.
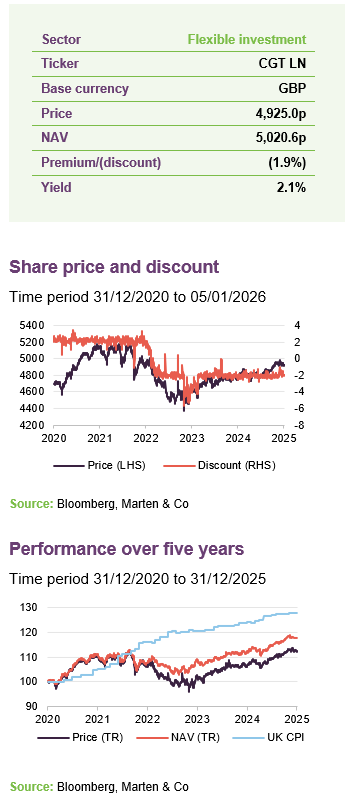
| 12 months ended | Share price total return (%) | NAV total return (%) | UK CPI(%) | MSCI UK total return (%) |
|---|---|---|---|---|
| 31/12/2021 | 10.8 | 11.0 | 5.4 | 19.7 |
| 31/12/2022 | (4.2) | (3.2) | 10.0 | 7.2 |
| 31/12/2023 | (3.3) | 1.3 | 4.0 | 7.7 |
| 31/12/2024 | 4.0 | 2.6 | 3.0 | 9.5 |
| 31/12/2025 | 5.4 | 5.4 | 3.1 | 25.8 |
Source: Bloomberg, Marten & Co
Fund profile
You can access the trust’s website at: www.capitalgearingtrust.com
CGT is designed for investors with a long-term investment horizon, who seek to avoid significant short-term losses and aim to generate returns ahead of inflation. Over a long period, it has outperformed inflation and has experienced a low level of drawdowns.
Its manager is CG Asset Management (CGAM), which also acts as the company’s AIFM. CGAM was established in 2001 by Peter Spiller, who has been responsible for CGT’s portfolio since 1982. Since then, CGT has recorded two years of negative performance – over the 12 months ended 31 March 2014 and the 12-month period that ended on 31 March 2023. In both cases, the period was marked by rising bond yields.
CGAM is majority-owned by an employee ownership trust, and states that it intends to remain independent. A significant majority of the individual managers’ assets are invested in the funds managed, which may help align their interests with clients.
There are 10 members of the CGAM team, six of whom are focused on investments. These include the three leads on the portfolio – Peter Spiller, Alastair Laing, and Chris Clothier – as well as Hassan Raza, Emma Moriarty, and Jock Henderson.
As at 31 December 2025, CGAM had AUM of £2.3bn.
New chair in place
As of July 2025, CGT has a new chairman, Karl Sternberg, who held a number of positions at Morgan Grenfell/Deutsche Asset Management between 1992 and 2004, including chief investment officer for London, Australia, Europe, and the Asia Pacific. Following this, he became a founding partner of institutional asset manager Oxford Investment Partners, which was acquired by Towers Watson in 2013. Karl has held a number of non-executive roles within the investment company sector, including as the former chairman of JPMorgan Income & Growth Investment Trust Plc, The Monks Investment Trust Plc, and Apax Global Alpha Plc. Currently, he is chairman of Clipstone Industrial REIT and a non-executive director of Howard de Walden Estates.
Managers’ view
In recent weeks, a number of brokers have published optimistic forecasts for equity markets (usually US equity markets) for 2026. These forecasts appear to be based on a scenario of falling interest rates, tax rebates, and infrastructure investment. However, there is a possibility that persistent or rising inflation could affect these outcomes. If that occurs, CGT’s managers believe there may be limited options for investors to mitigate risk.
Over 2021, an environment of easy-money policies introduced to cushion economies from the effects of COVID appears to have contributed to a resurgence of inflation. The rate of inflation has slowed but remains above central banks’ targets. CGT’s managers believe that this could continue to be the case for some time.
The COVID-related fiscal measures also appear to have contributed to growing fiscal deficits within most developed world countries. However, governments appear unwilling to reduce spending, which may be contributing to unease within bond markets, with some increased volatility in yields of long-dated credit.
Figure 1: US and UK inflation rates
Figure 2: US fiscal deficit as a percentage of GDP
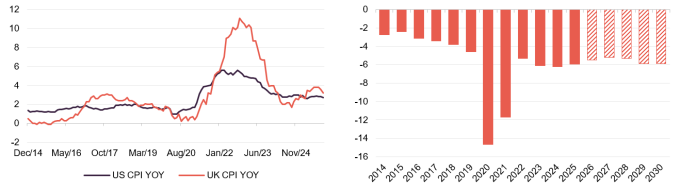
Source: Bloomberg
Source: Federal Reserve Bank of St Louis (historic figures), US Congressional Budget Office (forecasts as at March 2025).
A third of the S&P 500 is in stocks trading on more than 10x revenues
At the same time, equity market valuations appear stretched. The managers cite a variety of statistics that support this view, including that, by market cap, a third of the S&P 500 is trading at more than 10x revenues, excluding Alphabet (on just under 10x revenues) and Amazon (where the revenue multiple is affected by the ecommerce business, but the team believes much of the market cap may be attributed to interest in its cloud infrastructure business).
The team observes that the business models of the mega-cap, AI-related businesses that dominate indices appear to be becoming more capital intensive. In its view, the returns on investment required to justify the planned levels of capex may be difficult to achieve.
The tariff announcements on “Liberation Day” at the start of April appeared to trigger some market volatility, but this was short-lived. CGT fell by 2% by comparison to c.20% in global equities The impact of tariffs has been more muted than some market participants expected, but it may be contributing towards higher inflation and lower growth. US GDP growth numbers may be influenced by AI-related capex, without which the economy appears relatively flat. The demand for power to service AI datacentres appears to be putting upward pressure on US energy prices, which could feed through into inflation.
At CGAM’s recent capital markets day, Peter Spiller outlined the team’s view that commercial real estate markets are overvalued. He states that, in his view, investors are not fully accounting for the effects of the trend to redevelop offices every 25–30 years in expected returns from this asset class. According to CGAM, assuming a 25-year life and 70% rebuild cost, this may reduce the expected return by approximately 2.8% per annum. Prime yields are reported to be about 5.5% in the City and 3.75% in the West End, according to Cushman & Wakefield.
Figure 3: S&P 500 Index 2025 and 2026 YTD
Figure 4: Average US power prices in cents per kilowatt-hour
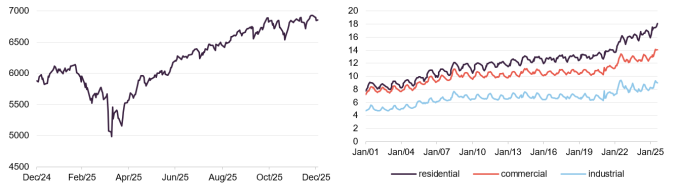
Source: Bloomberg
Source: US Energy Information Administration
Gold has performed well this year, and CGT has a small exposure to it. The managers remain cautious on the commodity, given CGT’s mandate to preserve real wealth. The managers state that the precious metal has no intrinsic yield, an unreliable track record of protecting against inflation, and prices that appear highly speculative. They believe that, while gold can perform well during periods of war and political upheaval, its volatility and sentiment-driven behaviour introduce risks that they consider inconsistent with the trust’s primary objective.
Figure 5: CAPE equity yield versus inflation linked bond yields
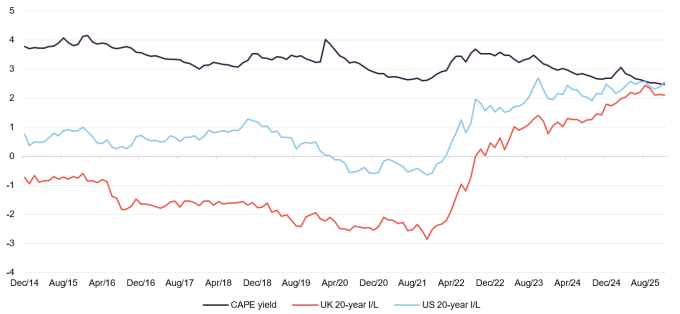
Source: Bloomberg, Robert Shiller online dataset (at yale.edu)
Given the team’s concerns over valuations, CGT’s asset allocation appears to be increasingly weighted away from risk assets towards inflation-linked bonds. The team states that these bonds may still offer the prospect of positive real returns.
The team also notes that the CAPE equity yield (the inverse of the cyclically-adjusted price earnings ratio produced by Robert Shiller) is now roughly the same as the yield on 20-year US TIPS and 20-year UK inflation-linked gilts. The team states that this suggests high valuations are being attributed to equities.
CGT’s liquidity – in the form of cash and high-quality, short-dated credit – is maintained so that the team can potentially respond to market setbacks by increasing risk asset exposure at lower prices. The managers note that a considerable amount of time has elapsed since the last bear market. The managers state that they are prepared to act when such an opportunity arises.
Asset allocation
Figure 6 shows how CGT’s monthly asset allocation has varied since March 2011. The team notes that, despite the reduction in risk asset exposure, there may still be idiosyncratic opportunities to add value within that part of the portfolio.
Figure 6: CGT asset allocation history

Source: Capital Gearing Trust
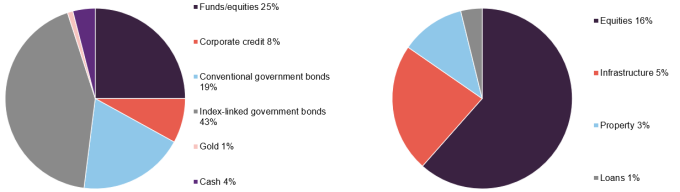
Compared with the previous note, which used data as at the end of June 2025, CGT’s portfolio has increased exposure to index-linked government bonds, with reduced allocations to funds/equities, corporate credit, and conventional government bonds. Over this year, there has been a shift towards UK index-linked bonds, funded by realisations of US TIPS.
The managers state that CGT’s current asset allocation reflects a cautious stance relative to other multi-asset investment trusts. According to the managers, the portfolio is constructed with an emphasis on capital preservation, favouring inflation-linked sovereign bonds, defensive assets, and low-volatility exposures over growth-oriented risk assets. The managers report that this approach may result in lower sensitivity to equity market drawdowns and credit spreads, and a return profile that appears less correlated with traditional multi-asset peers, many of which maintain higher allocations to equities and credit. The managers state that CGT’s defensiveness is structural rather than cyclical, which they say is consistent with its objective of preserving real wealth across market environments.
Figure 7: Asset allocation as at 30 November 2025
Figure 8: Split of funds/equities allocation as at 30 November 2025
Source: Capital Gearing Trust
Source: Capital Gearing Trust
The duration of CGT’s portfolio is up slightly from 3.9 years when last published. Credit spreads have narrowed this year, but since June the credit quality of the portfolio appears to have improved on average.
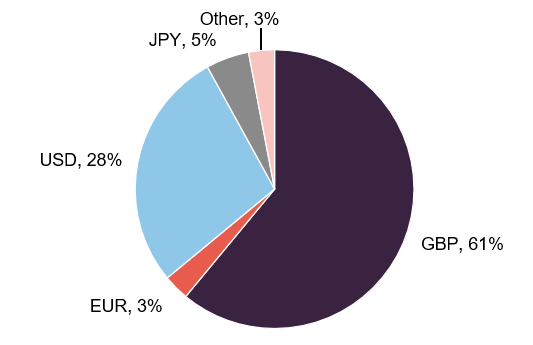
Figure 9: CGT’s currency exposure as at 30 November 2025
Source: Capital Gearing Trust
Figure 10: CGT’s duration and yield as at 30 September 2025
| Weight (%) | Duration (years) | Yield (%) | Rating | |
|---|---|---|---|---|
| Cash & TBills | 23 | 1.0 | 4.1 | A+ |
| I/L Bonds | 39 | 7.2 | 4.31 | AA |
| Corporate bonds | 11 | 3.2 | 5.8 | A/A- |
| Risk Assets (HY) | 1 | 1.1 | 9.0 | BB/BB- |
| Risk assets (other) | 26 | n/a | 5.0 | n/a |
| Total | 4.6 |
Source: Capital Gearing Trust. Note 1) 1.4% real yield
Largest underlying holdings
Figure 11: Largest equity and bond positions in the portfolio as at 30 November 2025
| Largest equity holdings | As at 30/11/25 (%) | Largest bond holdings | As at 31/10/25 (%) |
|---|---|---|---|
| North Atlantic Small Companies | 2.1 | UK Index-linked 0.125% 10/08/31 | 6.3 |
| Vanguard FTSE 100 ETF | 2.0 | JGB 0.60% 01/01/27 | 5.3 |
| International Public Partnership | 1.4 | UK Index-linked 0.75% 22/11/33 | 3.9 |
| JPMorgan Japan ETF | 1.2 | US Index-linked 0.125% 15/07/31 | 3.5 |
| BlackRock Energy | 1.2 | US Index-linked 0.175% 15/01/34 | 3.5 |
Source: Capital Gearing Trust
Within the risk asset portion of the portfolio, CGT realised profits on several discount opportunities, including exiting Fidelity Japan Values (FJV) when that company was taken over and rolling part into AVI Japan Opportunity Trust (AJOT). CGT had established its position as one of the top shareholders when FJV did not meet its single digit discount commitment, anticipating that the board may need to take significant action ahead of the trust’s continuation vote to address performance concerns.
CGT also made use of the recent cash exit opportunities that were available from Mobius Investment Trust and Polar Capital Global Financials Trust.
Positions in Aberdeen Asia Focus (AAS) and Fidelity Emerging Markets have also delivered strong performance this year. In the case of AAS, CGT took a substantial position in the trust’s convertible loan stock at prices that management considered attractive and was able to convert the loan stock into equity when the NAV rose sufficiently.
Crystal Amber was a relatively large position. That company’s managed wind-down is nearing its end and CGT has been able to book some profits on the position.
CGT is less focused on renewables than previously. When the prices of many of these trusts increased over the summer, the team sold down positions; exiting holdings in The Renewables Infrastructure Group (TRIG), Greencoat UK Wind, and Foresight Solar, and reducing the holding in Bluefield Solar Income Fund over June and July.
Even as share prices were rising, the team was becoming less convinced of the validity of the NAVs of these companies, observing that for some investment companies in managed wind-down, such as Aquila European Renewables, the assets appeared to be changing hands at lower prices than the NAV models had implied.
Doubts over NAVs appear to have been a factor in the team’s opposition to HICL Infrastructure’s plan to acquire TRIG.
The members of the team support the zero-discount model used by CGT, and suggest that the three-year stamp duty holiday for new IPOs may encourage the launch of a new trust with this model.
Public campaigns such as the one launched against the infrastructure merger are uncommon. Most of the work undertaken to encourage boards to address discounts and adhere to previous commitments on discount controls typically occurs privately.
The team has identified around 90 investment companies where some action to narrow discounts has been promised or where an exit opportunity is available. Notwithstanding the extended valuations of many asset classes in general, many of these may present opportunities for the risk assets portion of the portfolio.
Performance
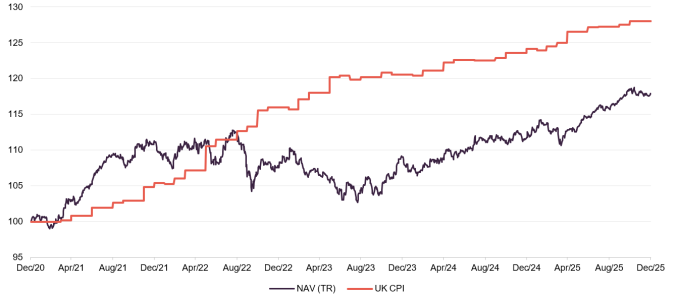
Figure 12: CGT NAV total return and UK inflation (CPI) over five years to end December 2025
Source: Bloomberg, Marten & Co
As Figure 13 shows, CGT appears to have preserved and grown shareholders’ capital in real terms over the long term, and it is making up ground against the inflation index following the surge in inflation over 2021/22.
Figure 13: Cumulative total returns for periods ended 31 December 2025
| 3 months | 6 months | 1 year | 3 years | 5 years | 10 years | |
|---|---|---|---|---|---|---|
| CGT price | 0.9 | 3.0 | 5.4 | 6.0 | 12.6 | 66.8 |
| CGT NAV | 0.8 | 2.9 | 5.4 | 9.6 | 17.9 | 69.1 |
| CPI | 0.4 | 0.6 | 3.1 | 10.4 | 28.0 | 39.4 |
| MSCI UK | 7.1 | 15.4 | 25.8 | 48.3 | 90.2 | 134.0 |
Source: Bloomberg, Marten & Co
Large-cap UK equities have outperformed US indices in sterling terms over 2025. CGT’s returns have been less volatile than those of the UK and world indices, with a 10-year annualised standard deviation of 4.8% compared to about 15.1% for the MSCI UK Index and 15.2% for the MSCI World Index.
Over the 10-year period ended 31 December 2025, CGT’s largest monthly drawdown was 4.8%, compared to 13.5% for the MSCI UK Index and 10.6% for the MSCI World Index.
The team notes that the market gyrations related to “Liberation Day” appeared to have only a modest effect on CGT’s share price. The drawdown on the S&P 500 was over 12% between 2 April and 8 April, whereas CGT’s NAV declined by less than 2% and the discount did not widen.
Drivers of returns
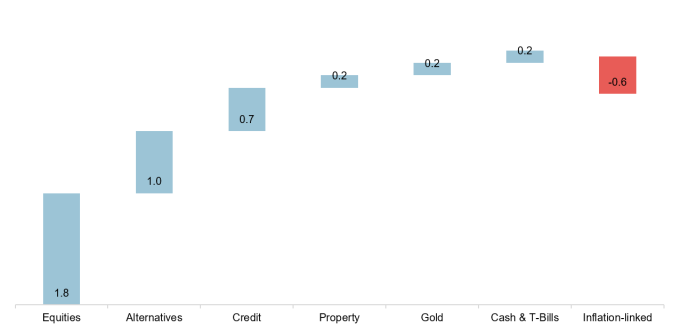
The data in Figure 14 is taken from CGT’s recent interim results presentation, which covered the six-month period ended 3 September 2025.
Almost all parts of the investment portfolio appear to have made a positive contribution to the trust’s NAV returns, with the exception of the allocation to inflation-linked bonds, where prices have been falling and yields rising, particularly in the UK. This appears to have contributed to the valuation opportunity that encouraged the shift from US TIPS into UK index-linked bonds.
The risk asset portion appeared to perform well, which may have been influenced by some of the discount narrowing discussed in the asset allocation section above, with both equities and alternatives contributing to CGT’s NAV uplift.
Figure 14: Contributions to CGT’s NAV returns over the six months ended 30 September 2025
Source: Capital Gearing Trust
Premium/(discount)
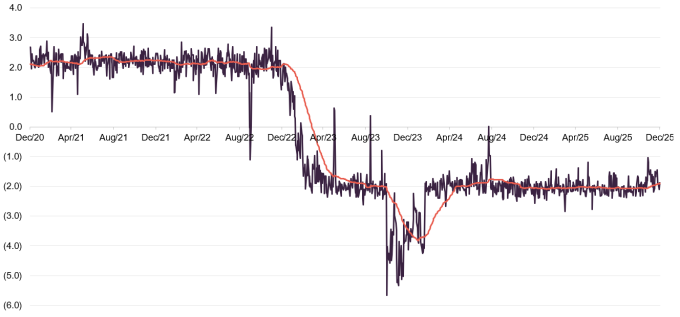
The board states that the threat of an expanded discount is not one that shareholders should be expected to bear. Therefore, since 2015, CGT has operated a discount control policy whereby it aims to purchase or issue shares to ensure, in normal market conditions, that its shares trade consistently close to NAV.
At each AGM, shareholders are asked to approve the issuance of up to one third of CGT’s issued share capital and buy back up to 14.99%. If necessary, the board seeks to renew these permissions between AGMs.
Consistent with its discount control policy, over the 12 months ended 31 December 2025, CGT’s shares traded within a range of 2.8% discount to 1% discount and an average discount of 2.0%.
At the time of publication, CGT’s shares were trading at a 1.9% discount.
Figure 15: CGT premium/(discount) over five years to end December 2025
Source: Bloomberg, Marten & Co
Previous publications
We published a number of notes on CGT between September 2018 and March 2020, which are available to view on the QuotedData website.
Our re-initiation note – Cautiously positioned in volatile markets – was published on 10 July 2025.
IMPORTANT INFORMATION
Marten & Co (which is authorised and regulated by the Financial Conduct Authority) was paid to produce this note on Capital Gearing Trust Plc.
This note is for information purposes only and is not intended to encourage the reader to deal in the security or securities mentioned within it. Marten & Co is not authorised to give advice to retail clients. The research does not have regard to the specific investment objectives financial situation and needs of any specific person who may receive it.
The analysts who prepared this note are not constrained from dealing ahead of it but, in practice, and in accordance with our internal code of good conduct, will refrain from doing so for the period from which they first obtained the information necessary to prepare the note until one month after the note’s publication. Nevertheless, they may have an interest in any of the securities mentioned within this note.
This note has been compiled from publicly available information. This note is not directed at any person in any jurisdiction where (by reason of that person’s nationality, residence or otherwise) the publication or availability of this note is prohibited.
Accuracy of Content: Whilst Marten & Co uses reasonable efforts to obtain information from sources which we believe to be reliable and to ensure that the information in this note is up to date and accurate, we make no representation or warranty that the information contained in this note is accurate, reliable or complete. The information contained in this note is provided by Marten & Co for personal use and information purposes generally. You are solely liable for any use you may make of this information. The information is inherently subject to change without notice and may become outdated. You, therefore, should verify any information obtained from this note before you use it.
No Advice: Nothing contained in this note constitutes or should be construed to constitute investment, legal, tax or other advice.
No Representation or Warranty: No representation, warranty or guarantee of any kind, express or implied is given by Marten & Co in respect of any information contained on this note.
Exclusion of Liability: To the fullest extent allowed by law, Marten & Co shall not be liable for any direct or indirect losses, damages, costs or expenses incurred or suffered by you arising out or in connection with the access to, use of or reliance on any information contained on this note. In no circumstance shall Marten & Co and its employees have any liability for consequential or special damages.
Governing Law and Jurisdiction: These terms and conditions and all matters connected with them, are governed by the laws of England and Wales and shall be subject to the exclusive jurisdiction of the English courts. If you access this note from outside the UK, you are responsible for ensuring compliance with any local laws relating to access.
No information contained in this note shall form the basis of, or be relied upon in connection with, any offer or commitment whatsoever in any jurisdiction.
Investment Performance Information: Please remember that past performance is not necessarily a guide to the future and that the value of shares and the income from them can go down as well as up. Exchange rates may also cause the value of underlying overseas investments to go down as well as up. Marten & Co may write on companies that use gearing in a number of forms that can increase volatility and, in some cases, to a complete loss of an investment.