
North American Income Trust
Investment companies | Annual overview | 10 February 2023
As headwind turns tailwind
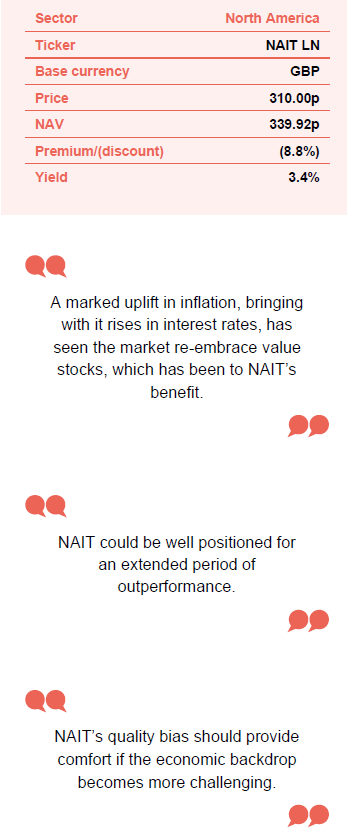
North American Income Trust (NAIT) adopted its income strategy in May 2012 and, for most of the nearly 11 years that this has been in place, there has been a headwind to value investing in the form of easy money policies (where interest rates and borrowing costs are low, which tends to favour growth-style investing). However, a marked uplift in inflation, bringing with it rises in interest rates, has seen the market re-embrace value stocks. This has been to NAIT’s benefit, pushing it up its peer group rankings over the last year, as most funds in the North America sector now have a growth bias.
While US inflation has been falling for some months now, it remains at an elevated level and perennially-low interest rates look like a thing of the past. This suggests that NAIT could be well positioned for an extended period of outperformance. Its quality bias should provide comfort should the economic backdrop become more challenging. In the meantime, a 3.4% dividend yield means that investors are paid to wait, plus its discount to net asset value (NAV) leaves it modestly cheap versus its longer-term averages.
Above-average income and long-term growth
NAIT’s objective is to invest for above-average dividend income and long-term capital growth, mainly from a concentrated portfolio of dividend-paying S&P 500 US equities. It may also invest in Canadian stocks and US small- and mid-cap companies to provide for diversified sources of income as well as fixed income investments, which may include non-investment grade debt.
Market outlook
Value investing has faced the headwind of low interest rates since the global financial crisis.
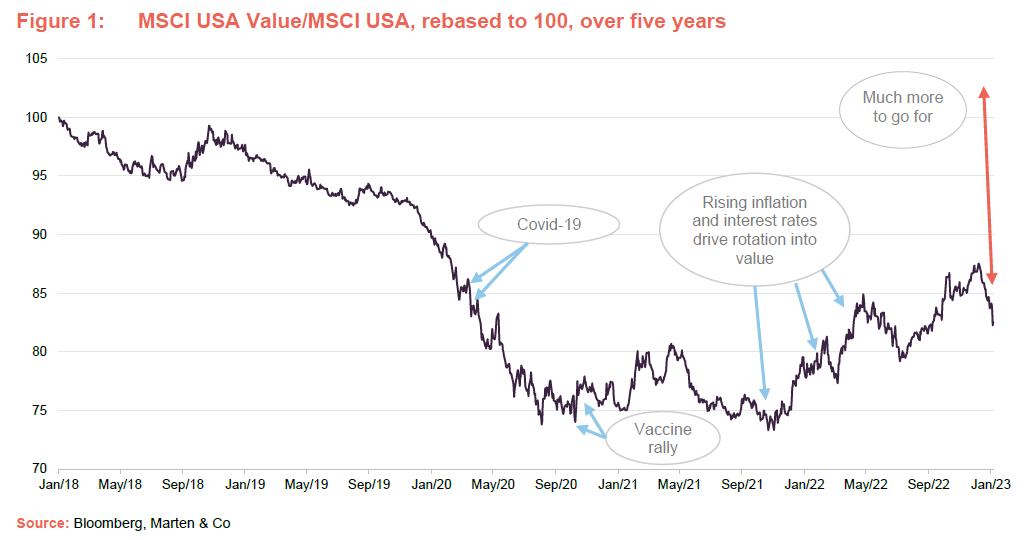
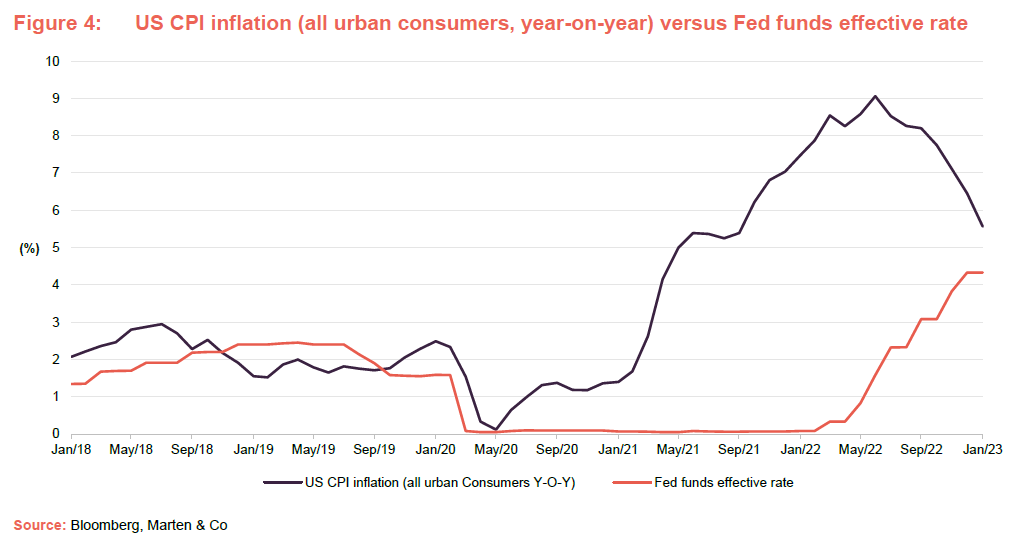
As illustrated in Figures 1 and 2, US value stocks have underperformed wider US equity markets by a significant margin during the last five years. Most of value’s underperformance that is visible in Figure 1 occurred during the period prior to the COVID-related market collapse of March 2020 and this continued in the period immediately following it. Governments and central banks responded to the pandemic with an unprecedented level of fiscal and monetary stimulus. This further extended the low interest rate, low growth narrative, effectively present since the global financial crisis. Such an environment inherently favours risk-taking/growth-investing. However, during the last 12 months, value stocks have outperformed growth as central banks have raised interest rates in response to soaring inflation (see Figure 4) – in part a consequence of the sheer level of stimulus injected into the global economy in response to the pandemic.
Inflation has finally been driving a strong rotation back into value.
Figure 4 illustrates that US inflation has been on a declining trend in recent months but remains at a significantly elevated level when compared to recent history. A comparison of Figure 1 versus Figure 2 highlights that, while value has been outperforming broader US equities in recent months, equities in general have been retreating.
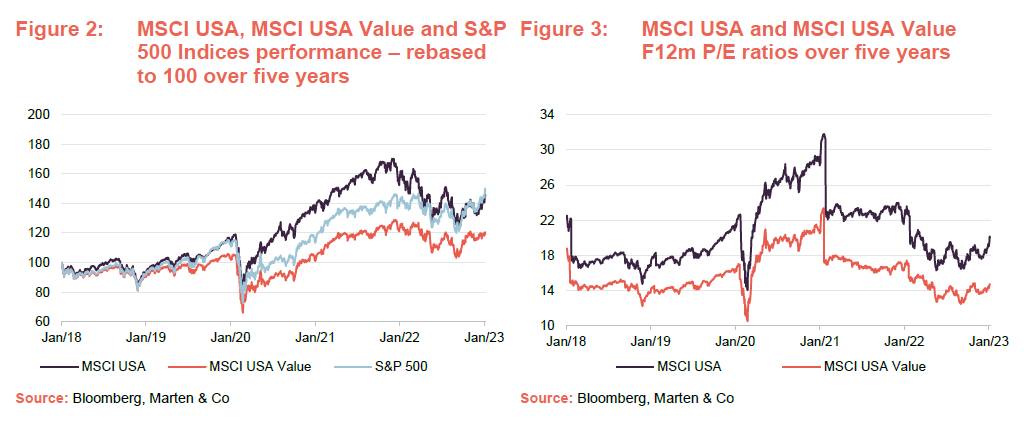
As illustrated in Figure 3, US value stocks have tended to trade at a discount to the broader US equity market during the last five years (arguably reflecting the markets general bias towards growth stocks during this period). Figure 3 also illustrates that valuations for both value stocks and broader US equities have become more attractive during the last 12 months and are now below their longer-term averages.
As at 3 February 2023, the MSCI Value Index was trading at a 12-month forward (F12m) price/earnings (P/E) ratio of 14.6x (7.7% below its five-year average of 15.9x), while the broader MSCI USA Index was trading at 20.0x (2.9% below its five-year average). Over the 12 months to 31 December 2022, the broader MSCI USA Index lost 9.7% in sterling adjusted total return terms, while the MSCI Value Index gained 4.8%.
Manager’s view
NAIT’s manager, Fran Radano, says that from a top-down perspective the US market feels much cheaper than it has been in recent years. When compared to just a year ago, when he was reluctant to spend more than 20 times what he felt was peak earnings for a company, he is now able to find a wider selection of opportunities that fit his requirements and are available at more sensible valuations. To illustrate this point, as at 31 December 2021, the MSCI US Value Index was trading at a 12-months forward P/E ratio of 17.0x whereas today it is at 14.6x and is below its five-year low of 15.9x.
The red wave that wasn’t
In US politics, bi-partisan tussles seem to be the order of the day, but the much-vaunted red wave that the Republicans had been predicting in the US midterm elections failed to materialise (a red or blue wave is a US election where either the Republican Party or Democratic party makes significant gains respectively). With a circa 40% approval rating for Biden coming into the mid-terms, a large swing against the Democrats had been predicted, with many pundits suggesting that the incumbents would lose both houses.
Biden’s approval rating implied much greater losses for the Democrats in the midterms.
Since World War II, the party of the incumbent president has, on average, lost 26 seats in the House of Representatives (the lower chamber in the US congress) and four seats in the Senate (the upper chamber in the US congress). In the event, the Democrats lost nine seats in the House of Representatives (having been predicted to lose 47) but actually gained a seat in the Senate.
The result was that the Republicans took control of the House of Representatives (the lower house), which controls the legislative agenda, but the Democrats held on to the senate (the upper house). Control of the upper house is key, as it allows the Democrats to make judicial appointments. However, loss of control of the lower house will make it harder to pass new laws (a similar situation occurred during the second half of Trump’s presidency, which effectively put the brakes on his legislative agenda).
NAIT’s manager is not expecting to see big changes in policy.
Reflecting the fine balance of power within the House and Democratic control of the senate, Fran does not expect to see any big changes in policy. He thinks that there will be some horse trading, with the Republicans likely to require significant concessions to allow legislation proposed by the Democrats to pass. He also stresses that, while senators represent the interest of their states, members of the House of Representatives work for the local populations and some Republicans have won seats in Democrat leaning areas, meaning that they will need to track close to the middle as well.
Fran also points out that there are a lot of issues for politicians to work through. The US has been growing its renewable energy generation capacity, but lots more is needed. Generous childcare provisions that were put in place during COVID for the unemployed subsequently created a strong disincentive to return to work. This measure has since been scrapped, but it is another factor putting pressure on consumers. Fran predicts that we might see some fiscal policy (government spending) directed towards consumers to try and alleviate the pain, noting that Biden was able to get his Inflation Reduction Act through. This included a lot of measures and, while the Republicans may have resisted it, deals were done to get this over the line and neither side will want to see these rolled back. Drug pricing will likely remain a politically-sensitive issue, but given that the sometimes-generous margins are readily observable, getting these costs down is a potential win for all.
The more extreme Trump-endorsed candidates were rejected.
Fran underlines that a key takeaway from the process is that the more extreme Trump-endorsed candidates were rejected. He thinks that this opens the door for a less-radical approach from the Republicans going forward. Furthermore, mailed-in ballots, which have tended to be favoured by Democrat-leaning voters, have become more acceptable in the aftermath of COVID. This is a potential negative for Republicans going forward.
With higher interest rates, will valuations start to matter?
A higher cost of capital raises the return bar for all asset classes.
Fran states that, since having a cost of capital that was effectively free – or possibly even negative – is now a thing of the past, this raises the bar for returns for all asset classes. The effects are considerable. If discount rates used to value assets (for example, in discounted cash flow models) had been trending towards zero for most equities, Fran’s view is that the new normal suggests they need to be in the 4-6% range. The implication is that valuations and terminal values (the value of an asset at the end of its forecast period) have changed markedly and, if higher interest rates persist, valuations should matter more to investors.
Fran acknowledges that there is an ongoing debate about what level discount rates should be at, and that this impacts valuations. However, the marked increase in inflation, accompanied by a shift towards much higher interest rates, suggests that, whatever their prior level, the majority of valuations were too high. The impact is particularly strong for growth stocks that have a much larger portion of their value discounted from dates in the future (value stocks, in comparison, are more likely to be cash generative and provide dividends or return cash to shareholders up front through share buybacks and so more of their intrinsic value is provided in the near-term).
A focus on companies that pay dividends and return capital is more appealing in an environment of rising interest rates.
NAIT’s focus on companies that have a narrative of paying dividends and returning capital has much greater appeal in an environment of rising interest rates (these near-term cash flows are markedly more valuable than less certain future ones and such companies are returning more today). Fran acknowledges that the key catalyst for the resurgence in value has been rising interest rates due to rising inflation, but notes that we were operating at peak fiscal and monetary policy, which could not go on indefinitely and so something had to give.
Fran says that a pertinent question now is whether the market has over-reacted and the risk premium between the yields on treasuries and the discount rates being applied to equities is now too wide (that is, are discount rates now too high and pushing down valuations more than they should). Related to this, there is the further question of what this will look like in a year’s time, much of which hinges on the direction of inflation and, by implication, interest rates. Fran thinks that the gap is probably too wide, which suggests the potential for a degree of rotation from value back towards growth.
Dollar strength helps NAIT’s sterling returns, but is a headwind for US companies.
In this scenario, Fran expects NAIT’s portfolio to hold up better than the average value portfolio because it is more conservatively positioned and should be less interest rate sensitive. However, the big unknown is currency. US dollar strength had been helping NAIT in sterling return terms but has also been working against US companies more generally (a stronger US dollar makes exporters products more expensive to overseas buyers). Now the dollar is going the other way.
Growth has been outperforming value for well over a decade, but the environment has changed markedly.
Fran says that growth has been outperforming value for well over a decade now. The last year has seen value claw back a bit of relative performance, and while value as a style is by no means out of the woods, the environment is markedly different now. He points out that, using data since 1936, share price appreciation has provided 64% of investors’ returns and dividends 36% (Source: BofA US Equity & Quant Strategy, Factset, November 2022). However, since 2013, share price appreciation has provided 85% of investors’ returns with dividends just 14%. As such, recent market performance is significantly out of kilter with long run averages.
Fund flows continue to favour growth
Growth investors have been rewarded for buying dips for a long time; this calculation may change.
Fran comments that fund flows into large US exchange traded funds (ETFs) continue to be highly skewed towards growth. This is despite the poor performance of growth relative to value during the last 12 months and a climate in which inflation, while receding, remains elevated. He thinks that, at present, investors continue to believe they will be rewarded for buying dips, which to be fair is all that many younger investors have ever experienced. However, this cannot continue indefinitely, and Fran believes that if the performance of growth continues to drag, this could be a catalyst for the market to reassess values prospects. This could lead to a significant switch in fund flows in favour of value, which could give a massive boost to these stocks. Fran notes that, for a cohort of investors, growth investing has worked spectacularly well, but this was in an environment where the cost of capital was approximately zero.
How hard will the landing be?
A soft landing looks unlikely given current headwinds.
Fran thinks that a key question for US investors is whether the Fed can engineer a soft landing? If so, he thinks that we could see some real GDP growth (economic growth that is greater than inflation) from here but thinks that this unlikely, given current global headwinds (the challenges presented by the war in Ukraine and the difficulties China is facing as it re-opens from prolonged lockdowns with a population that is inadequately protected). There is no shortage of risks to the global economy, but if things continue to gradually settle, Fran thinks that we could see food and energy prices come off further, dampening inflation and reducing recessionary risk.
Rising interest rates could take the wind out of the property market.
However, property remains a concern. If mortgage rates move up significantly – from, say, around 3.5% to 7% – this changes the calculations on housing and could take the wind out of that market, significantly impacting confidence elsewhere. Fran notes that supply chains have been stretched in the US as elsewhere (think COVID, then Ukraine and then Chinese lockdowns) but observes that companies are finding workarounds, including re-shoring and near-shoring strategies. However, the workarounds tend to be more expensive, which in itself is inflationary. Fran notes that the labour market still looks tight (unemployment sub-4%) and average hourly earnings growth is still nearly 5%. He thinks that inflation should perhaps be higher than it currently is and, more importantly, that the current level of inflation should imply a higher level of interest rates. Fran says that the team is monitoring this dislocation between interest rates and inflation very carefully.
Continued focus on quality
Fran comments that in current uncertain markets, abrdn’s focus on quality is valuable as it helps to reduce the level of unforced errors (the logic being that a higher-quality company should be better positioned to deal with a more challenging economic environment, perhaps through lower levels of debt or more resilient earnings and therefore dividends, for example).
Concentrated in quality.
To compensate for this, the portfolio is reasonably concentrated (the top 10 holdings tend to account for 30 to 40% of the portfolio), but there is a soft cap of 5% on any one holding plus, for lower-yielding stocks (typically those whose dividend yield is sub 2%), the manager raises the bar in terms of the capital growth he expects (say a share price that could double every five years).
It is noteworthy that, during the pandemic, NAIT’s holdings dividends were very resilient, with only one holding actually cutting its dividend. This was Gaming and Leisure Properties (a landlord to regional casinos), which cut its quarterly dividend from USc70 to USc60. However, the dividend quickly recovered and has grown since so that the current quarterly rate of USc70.5 is now above its pre-pandemic level. In addition, the company paid a special dividend at the end of 2021, which partially compensated shareholders for the lost income.
Positive outlook for dividend growth reflecting portfolio resilience.
Despite a slowing economy, Fran continues to feel positive about NAIT’s holdings and the outlook for dividend income from its portfolio. As discussed on page 19, Fran thinks that the portfolio could achieve high single-digit growth in dividend income over the next year.
Asset allocation
As at 30 November 2022, NAIT’s portfolio consisted of 37 equity and 2 fixed-income investments.
As at 31 December 2022, NAIT’s portfolio consisted of 36 equity and seven fixed-income investments, with an active share of 87.7%. This compares with 39 equity and three fixed-income holdings at 30 June 2022 (the most recently available data when we last published), when the active share was 89.1%.
Bonds have been scaled back significantly in recent years and currently account for around 1.5% of the portfolio. The allocation was taken down in 2020 at a time when markets were depressed and bond yields had been driven down by investors clamouring for income (with capital values rising accordingly). There has been one issue added to NAIT’s bond holdings during the second half of 2022 and, with yields rising, NAIT’s portfolio could see its allocation to bonds expand from here.
NAIT can also invest in Canada and, as at 31 December 2022, this represented 8.0% of the portfolio while the US accounted for 87.7%. The balance of 4.3% was held in cash. The Canadian exposure has decreased by 0.2 percentage points since our last note (from 8.2%); the US exposure has decreased by 0.9 percentage points (from 88.6%) and cash has increased by 1.1 percentage points (from 3.2%).
Sector breakdown
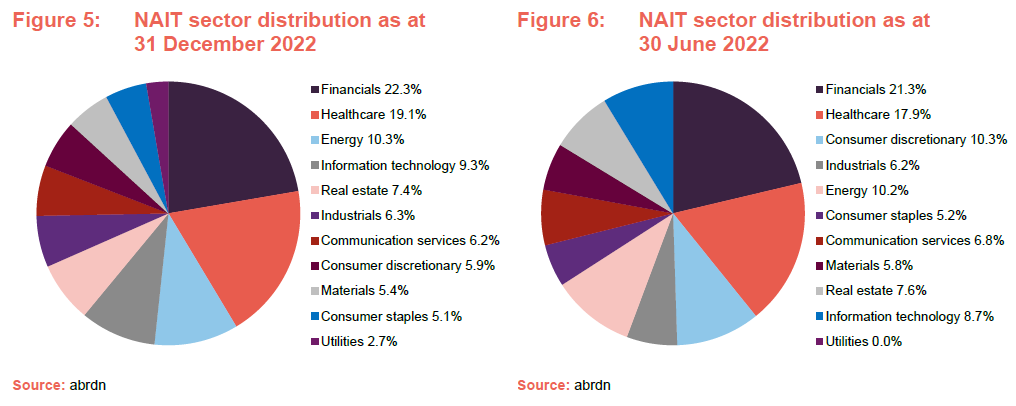
Comparing the most recent sectoral makeup with the position as at 30 June 2022, the main differences are the change in exposures to consumer discretionary (down by 4.4 percentage points), utilities (up by 2.7 percentage points), healthcare (up by 1.2 percentage points) and financials (up by one percentage points). All other changes are less than one percentage point.
Financials continues to be NAIT’s largest portfolio weighting, as it has been for some time. The portfolio remains overweight banks, reflecting the fact that they benefit from a rising interest rate environment.
Portfolio activity
As we discussed in our August 2022 note, the sharp value rally during 2022 saw some holdings bought and sold again very quickly; for example, NAIT’s holdings in Home Depot and CMS Energy were both held for a short period. Ordinarily, the manager might have otherwise expected to hold these for a number of years, but they quickly reached their target prices and were sold, with the proceeds rotated into better opportunities.
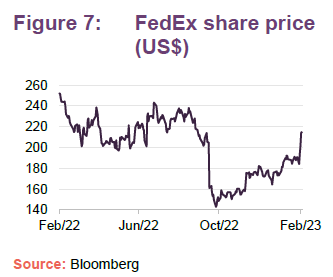
FedEx was added to NAIT’s portfolio in the second half of the year after it posted guidance for the year that was well below market expectations and also reduced its guidance for 2023 (FedEx’s shares lost 21% on the day of the announcement). The announcement highlighted weakening demand in shipping globally on the back of a poor macroeconomic outlook.
Whilst acknowledging the challenges that FedEx faces, Fran felt that the market had over-reacted to the news, and thinks that FedEx can fix the problems that it is having with Express and Ground and that its plans to aggressively accelerate its cost-reduction efforts should quickly yield results.
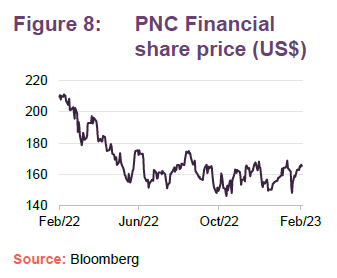
PNC Financial is a banking stock whose share price gave back some of its previous gains during the first half of 2022. NAIT’s manager felt that the market wasn’t giving the bank sufficient credit for the progress being made in growing both its interest and non-interest income, and established a position for the trust.
NAIT exited Nutrien in the first half of its financial year, following a strong performance on the back of a rally in fertiliser prices. The railroad freight operator Union Pacific Corp was also exited in the first half. This followed a number of quarters of mixed performance due to operational challenges. Huntington Bancshares was sold in the second half after its shares rallied. The bank posted Q4 results that beat market expectations on the back of expanding net interest margins.
Top 10 holdings
Since we published our last note, which highlighted NAIT’s top 10 holdings as at 30 June 2022, there have been few changes to the list. When we last published, we commented on how turnover had picked up as a number of stocks in the portfolio had re-rated, but this has since settled and is more akin to what might be expected over the long term.
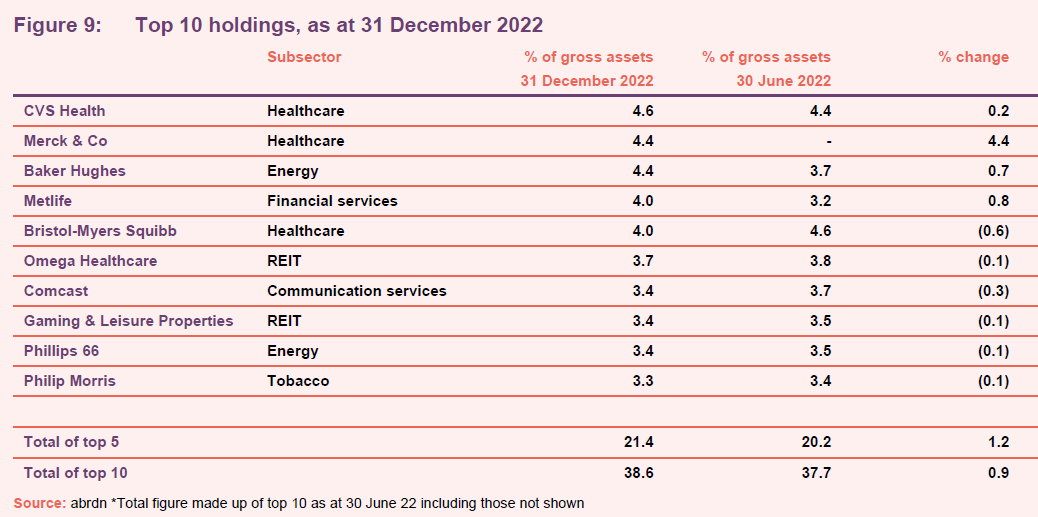
The one change within NAIT’s top 10 is that L3Harris Technologies has moved out and has been replaced by Merck & Co. We discuss some of the more interesting changes and developments in the following pages. Readers interested in more information on other names within NAIT’s top 10 should see our previous notes, where many of these have been previously discussed (see page 21 of this note).
Merck & Co (4.4%) – sizeable initiation
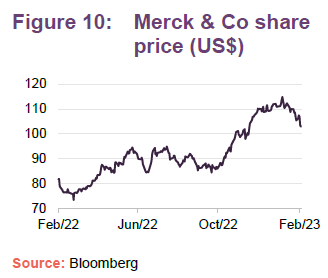
Merck & Co (www.merck.com) is an American multinational pharmaceutical company that develops and produces medicines, vaccines and biologic therapies as well as animal health products. Its areas of focus include oncology, vaccines, infectious diseases and cardio-metabolic disorders. It has multiple blockbuster drugs, targeting areas such cancer immunotherapy, anti-diabetic medication and vaccines against HPV (human papillomavirus) and chickenpox.
NAIT’s manager added Merck to the portfolio in August 2022 when its share price was depressed and the company was trading on a low multiple, reflecting very poor sentiment towards the biotech sector. The manager achieved an attractive price of around US$87 per share by writing a put option at around US$89 per share and receiving an option writing premium of around US$1 per share. As at 8 February 2023, Merck & Co was trading at US$107 per share. At the same time, the manager rotated out of Gilead and also reduced Abvie, as both had performed strongly and were trading at higher multiples. The manager also added to Bristol Myers Squibb as it was largely unloved and also trading at a depressed multiple.
L3Harris Technologies – hampered by supply chain issues
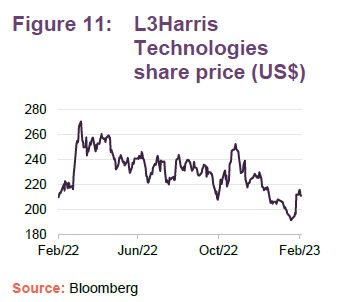
L3Harris Technologies (www.l3harris.com) is an American aerospace and defence company that provides advanced defence and commercial technologies across air, land, sea, space and cyber space. The company produces C6ISR systems (command, control, communications, computers, cyber-defence and combative systems) and associated products (wireless equipment, tactical radios, avionics and electronic systems, night vision equipment, and both terrestrial and spaceborne antennas). It has specialisms in surveillance solutions, microwave weaponry and electronic warfare. The company was formed in June 2019 with the merger of L3 Technologies (formerly L-3 Communications) and Harris Corporation, making it the sixth-largest defence contractor in the US.
NAIT’s manager initiated a position in L3Harris in October 2020 and the trust benefitted both as the company’s share price strengthened during 2021 and then again at the beginning of 2022 as defence stocks rallied in response to Russia’s invasion of Ukraine. However, the company has been impacted by supply chain issues throughout the year, which has weighed on its share price, and its third quarter 2022 earnings fell short of what both the company and markets had expected.
NAIT’s manager thinks that the challenges faced by the company are short-term in nature and that the markets’ reaction to the earnings miss was overdone, creating a buying opportunity. The manager thinks that the company is exposed to a number of longer-term structural growth trends, not least the heightened awareness of security concerns following the war in Ukraine, and notes that L3Harris raised its payout last year by 20%, giving it a circa 2% dividend yield.
Performance
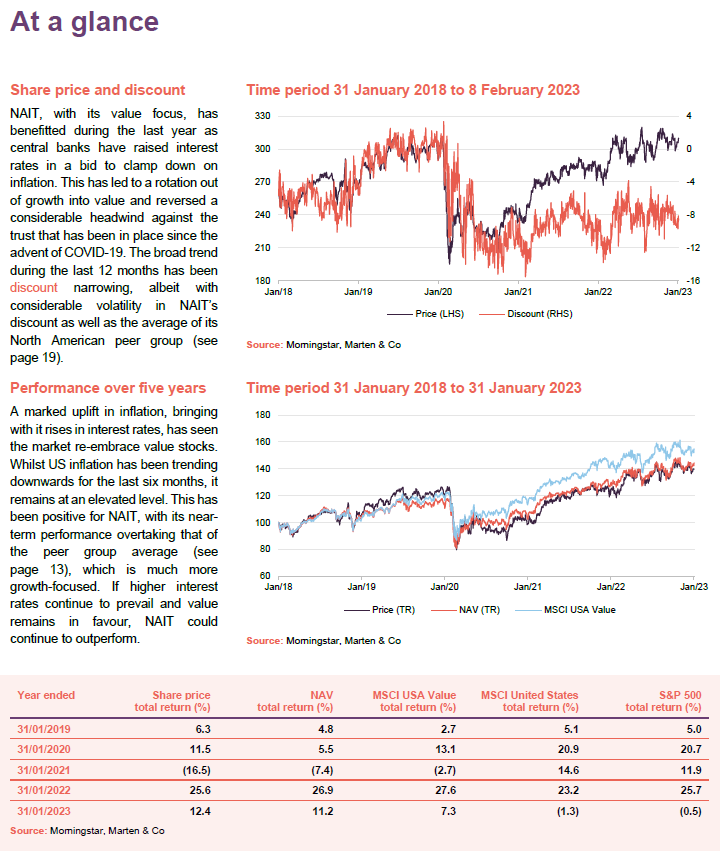
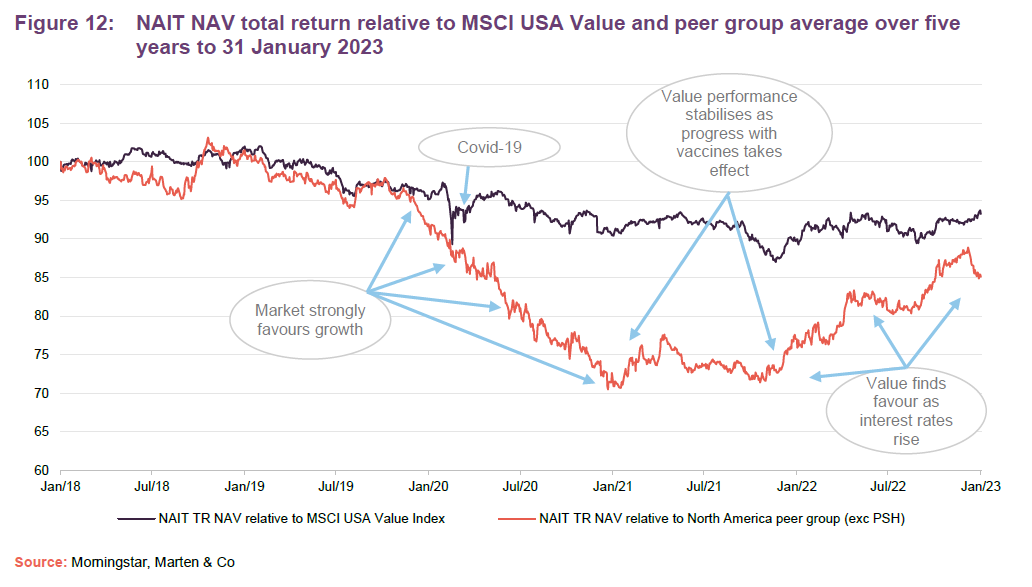
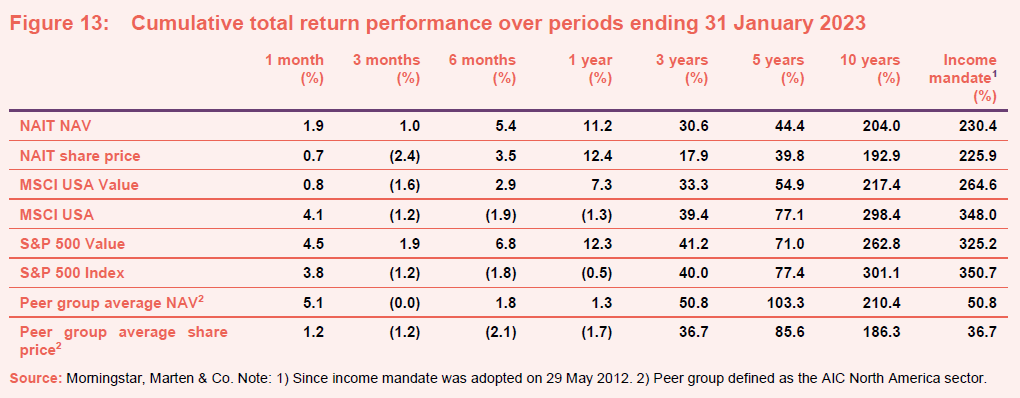
When we last published in August 2022, we commented that, while previously NAIT’s relative performance had been held back by the overwhelming outperformance of growth against value and the impact of the pandemic, a marked uplift in inflation – bringing with it rises in interest rates as central banks tried to bring inflation back under control – saw the market re-embrace value stocks.
This trend has continued in the second half of the year and, whilst US inflation has been trending downwards for the last six months, it remains at an elevated level. This has been positive for NAIT, with its near-term performance overtaking that of the peer group average. This is illustrated in Figure 12. Figure 12 possibly gives some insight into what NAIT’s performance relative to peers might look like if higher interest rates continue to prevail and value remains in favour.
Peer group
Up to date information on NAIT and its peer group is available on the QuotedData website.
NAIT is a member of the AIC’s North America sector, which comprises seven members. All of these were members of the peer group when we last wrote about NAIT, although Pershing Square Holdings was a relatively new addition and so we excluded it from our analysis at that time, but we have included it in full in this peer group analysis. Canadian General Investments has been excluded from our comparison, as Morningstar has ceased to provide coverage. Members of the North America sector will typically have:
- over 80% invested in quoted North American shares;
- an investment objective/policy to invest in North American shares;
- a majority of investments in medium to giant cap companies; and
- a North American benchmark.
As we have cautioned in our previous notes, the peer group as a whole does not provide an ideal comparison for NAIT. This is because, of the six funds we include here, only BlackRock Sustainable American Income (BRSA) follows a similar strategy to NAIT. Baillie Gifford US Growth and JPMorgan American are growth-focused; Canadian & General (excluded) and Middlefield Canadian Income allocate predominantly to Canada – the latter allocates primarily to Canadian banks, oil and real-estate, while Pershing Square Holdings (PSH) is a complex beast that provides exposure to American billionaire investor and hedge fund manager Bill Ackman. PSH previously resided in the Hedge Fund sector and aspects of its strategy reflect this.
As we have explained in our previous notes, the growth-focused funds led the peer group over 2020 and 2021, but NAIT has benefitted from the rotation into value over 2022 as interest rates have risen. This is clearly illustrated in Figure 14, which shows a marked improvement in the ranking of NAIT’s NAV total return performance versus its peers over the last year, with it ranking first or second overall of the periods provided up to and including one year.
Over three and five years, which covers the negative impact on performance associated with both the market rout and rotation into growth associated with COVID-19, NAIT moves down the peer group rankings, with NAV total return performance noticeably below that of the peer group average. However, it should be noted that PSH, which made good use of hedging strategies, performed exceptionally well during the pandemic, and this has the effect of distorting the peer group averages. If PSH is excluded from the peer group, NAIT still underperforms the peer group averages over three and five years, but the impact is much more muted. NAIT returns 30.6% over three years, while the peer group excluding PSH returns 35.1%; over five years, NAIT returns 44.4%, while the peer group excluding PSH returns 56.8%.
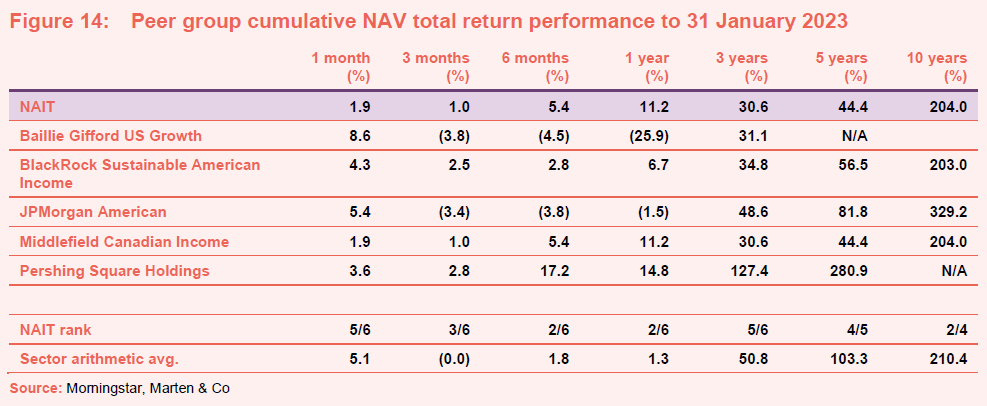
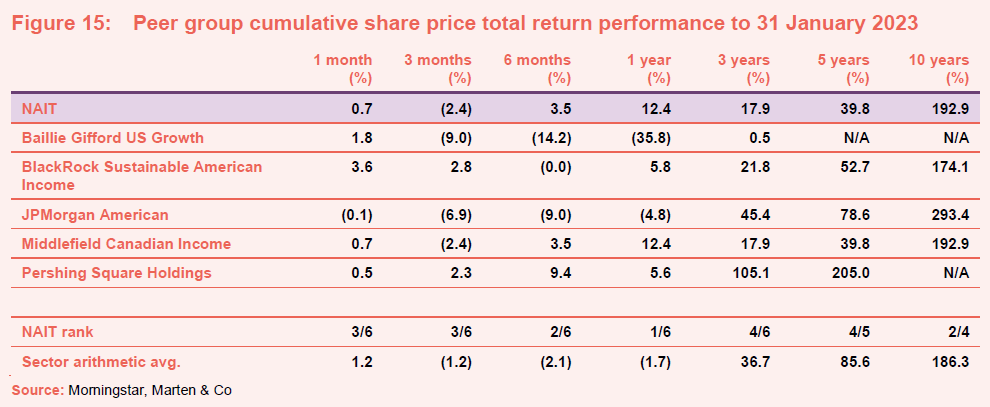
Figure 15 illustrates a similar story for share price total return, with NAIT’s rankings for share price total return mirroring those of its NAV very closely. The differences in NAV versus share price total return performance reflect movements in discounts over the various periods. As we note elsewhere, NAIT and its peers’ discounts have been pretty volatile during the last few years. NAIT’s NAV total performance has been markedly superior to its share price total return performance over the last three years. This illustrates the marked impact of the discount widening that NAIT has subject to over this period (as noted on page 19, NAIT had been trading at a sensible premium prior to the pandemic and has since moved to a marked discount and has yet to fully recover, perhaps creating an opportunity).
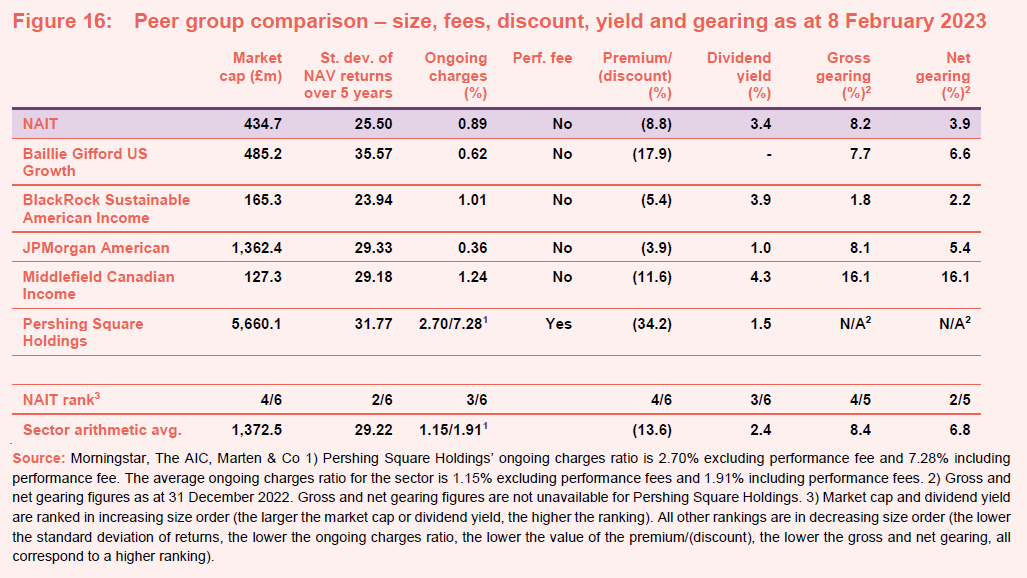
Looking at Figure 16, it can be seen that, in terms of size, the peer group is distorted by the behemoth that is PSH. The distortion is such that even the next-largest fund, JPMorgan American, is still below the peer group average. If PSH is excluded, the average market cap is £518m and whilst NAIT is a still around £80m below this, it is relatively close to the average.
PSH has a similarly distorting effect on the average ongoing charges ratio for the peer group. Despite its colossal size, it has by far and away the highest ongoing charges ratio for the peer group, even if its performance fee element is excluded (PSH is the only fund within the North America sector that charges a performance fee, and its impact has been significant). If PSH is excluded, the average ongoing charges ratio for the sector is 0.83% and NAIT’s ongoing charges ratio is around 0.6% above this.
The volatility of NAIT’s NAV returns is the second-lowest in the peer group (only BRSA’s are modestly lower) and noticeably below the peer group average.
The table also shows that NAIT’s trailing 12-month dividend yield is above the sector average, although currently lower than either BRSA or Middlefield Canadian Income. However, the adoption of BRSA’s sustainable mandate has led to a reduction in its revenue income and, unlike NAIT, it has been paying dividends out of capital (for the year ended 31 October 2021 the most recent full-year results currently available – BRSA paid a dividend of 8p on revenue earnings of 4.06p per share). As discussed on page 19, NAIT’s dividend income is projected to provide high single-digit growth and so it may be in a better position to grow its dividend than BRSA.
NAIT’S discount is below the sector average, although this is distorted by PSH. If PSH’s discount is excluded, the sector average is a discount of 9.5%, which is marginally wider than NAIT’s. NAIT’s gross gearing (borrowings as a proportion of shareholders equity) is broadly in line with the sector average but its net gearing (borrowings less cash, as a proportion of shareholders equity) is around three percentage points below, arguably reflecting the current uncertain environment. On this basis, we continue to think that NAIT is a reasonably-priced solution for investors looking for income in the US stock market, and where value can be found should the discount narrow or it returns to a premium rating.
Quarterly dividend payments
NAIT pays dividends quarterly, with the first interim dividend paid out in August. The second, third and fourth interim distributions are paid in October, February and June. For the full year to 31 January 2022, NAIT paid a dividend of 10.3p per share, a 3% increase from the previous year’s 10.0p per share.
NAIT achieved ‘next generation dividend hero’ status this year.
Although not a formal aspect of NAIT’s dividend policy, the total annual dividend has increased every year since NAIT adopted its income mandate in 2012. This means that NAIT now qualifies as an AIC next generation dividend hero (funds with 10 years of consecutive dividend increases).
For the current financial year, NAIT’s board has declared the first three interim dividends at 2.5p per share and has said that it expects to pay the fourth quarterly interim dividend at a rate of at least 3.1p. This suggests that NAIT’s total dividend for the year to 31 January 2023 will be at least 10.6p, which is a yield of 3.4% on NAIT’s share price of 310.0p per share as at 8 February 2023.
NAIT’s board has said that the amount of the fourth quarterly dividend will be determined once the results for the financial year are known, but it is looking to continue to build on NAIT’s track record of 10 consecutive years of dividend growth and to pay dividends more evenly over the year.
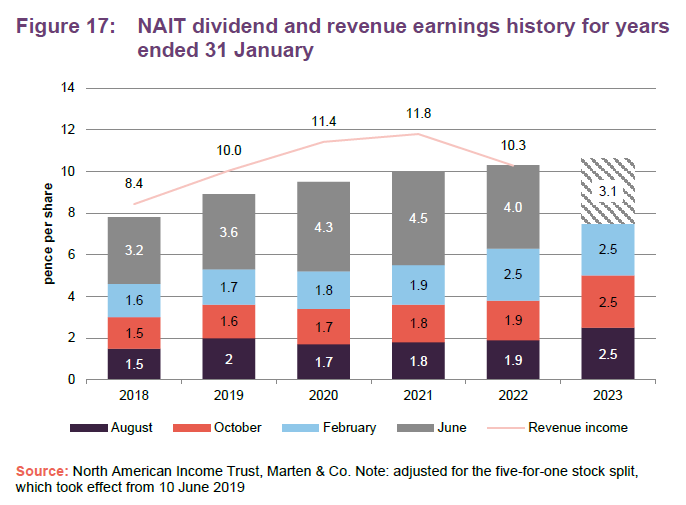
As Figure 17 illustrates, NAIT has a track record of growing its annual dividend and this has been supported by the build-out of its revenue reserves, with dividends having been consistently covered by earnings. As at 31 July 2022, NAIT had revenue reserves totalling £23.095m, equivalent to 16.46p per share or 1.55x the full year dividend of 10.6p per share (31 January 2022: £23.653m, equivalent to 16.81p per share).
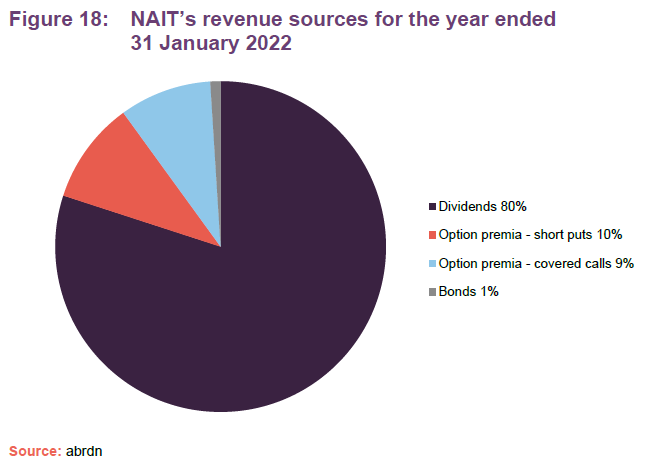
Figure 18 illustrates the sources of NAIT’s revenue income for the last financial year (ended 31 January 2022). This illustrates that the bulk of NAIT’s income is derived from dividends, with option premium providing a significant element and bonds a very minor contribution. However, in a climate of higher interest rates, the bond income may expand and in an environment of higher volatility, there may be more opportunities to generate premia from writing options.
NAIT’s manager models out the trust’s dividend income and this model is suggesting high single-digit dividend growth. This suggests that NAIT might be able to pay a progressive dividend, irrespective of the income from option premia.
Premium/(discount)
As is illustrated in Figure 19, the broad trend during the last 12 months has been discount narrowing, albeit with considerable volatility in NAIT’s discount as well as the average of its North American peer group. NAIT, with its value focus, has benefitted during the last year as central banks have raised interest rates in a bid to clamp down on inflation. This has led to a well-documented rotation out of growth into value and reversed a considerable headwind against the trust that has been in place since the advent of COVID-19. Anecdotally, NAIT also benefitted from the vaccine rally in November 2020 and has benefitted at other times where markets have become more risk-on; something we have discussed in our previous notes (see page 20 of this note).
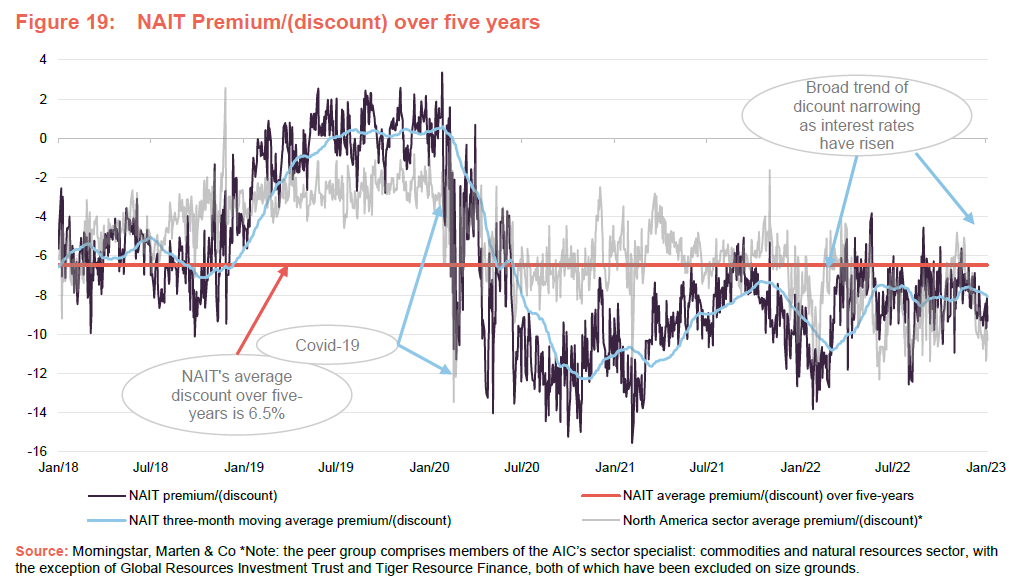
As is also illustrated in Figure 19, NAIT traded at a premium during much of 2019, while also trading at a marked premium to its peer group average discount. This was a period where value was in favour. The onset of COVID saw NAIT and its peer group derate, but the discount widening was much more pronounced for NAIT, with its value focus, as the peer group average was held up by the more growth-focused funds (and in a low-growth, low interest rate world, investors favoured growth).
It is noteworthy that while the market is now more favourable to value-focused investments than it has been in recent years, both NAIT and its peer group are still trading at discounts that are significantly wider than their pre-COVID levels and offer substantial discount narrowing potential from here. A further shift towards value, possibly due to a period of heightened or rising interest rates is one potential catalyst for a rerating.
Over the 12 months, NAIT’s has traded with a discount range of 3.8% to 13.8%, with an average discount of 8.5%. This is similar, albeit modestly wider than its peer group, which has traded at discounts between 4.1% and 12.3%, with an average of 8.1%. As at 8 February 2023, NAIT was trading at a discount of 8.8%, which is wider than its one-, three- and five-year averages of 8.5%, 8.7% and 6.5% – although it is modestly narrower than the peer group average of 13.6%.
Selective repurchases
NAIT is authorised to repurchase up to 14.99% and issue up to 10% of its issued share capital, which gives the board a mechanism with which it can influence the premium/discount. This authority was renewed at the most recently-held annual general meeting (AGM) in June 2022. The board uses this discount control mechanism as a tool to reduce volatility in the premium or discount to underlying NAV, while also making a small positive contribution to the NAV.
Reflecting the high level of uncertainty in the aftermath of COVID, NAIT’s board suspended share repurchase activity in 2020 but resumed these in 2021 as vaccination programmes brought greater visibility and markets settled. These continued into the first half of 2022, but ceased in May, most likely because NAIT’s discount had narrowed significantly since its previous low at that time.
Fund profile
NAIT’s objective is to provide investors with above-average dividend income and long-term capital growth through active management of a portfolio consisting predominantly of S&P 500 US equities. NAIT may also invest in Canadian stocks and US mid- and small-cap companies as a way of accessing diversified sources of income. Up to 20% of NAIT’s gross assets may be invested in fixed-income investments, which may include non-investment grade debt.
For more information, visit: www.northamericanincome.co.uk.
The company maintains a diversified portfolio of investments, typically comprising around 40 equity holdings and no more than 10 fixed interest investments
(which tend to be much smaller positions), but without restricting the company from holding a more- or less-concentrated portfolio from time to time.
NAIT benchmarks itself against the Russell 1000 Value Index but we have used the MSCI USA Value, MSCI USA and S&P 500 indices as comparators for the purposes of this report.
abrdn Fund Managers Limited acts as NAIT’s alternative investment fund manager (AIFM). The day-to-day management of the portfolio is delegated to abrdn Inc. The lead manager is Fran Radano, who sits on the equities team based in Philadelphia and Boston.
Previous publications
Readers interested in further information about NAIT, such as investment process, fees, capital structure, trust life and the board, may wish to read our annual overview note Next generation dividend hero, published on 8 August 2022, as well as our previous update notes and our initiation note (details are provided in Figure 20 below). You can read the notes by clicking on them in Figure 20 or by visiting our website.
Readers interested in further information about NAIT, such as investment process, fees, capital structure, trust life and the board, may wish to read our annual overview note Next generation dividend hero, published on 8 August 2022, as well as our previous update notes and our initiation note (details are provided in Figure 20 below). You can read the notes by clicking on them in Figure 20 or by visiting our website.
| Figure 20: QuotedData’s previously published notes on NAIT
Source: Marten & Co |
Legal
Marten & Co (which is authorised and regulated by the Financial Conduct Authority) was paid to produce this note on The North American Income Trust Plc.
This note is for information purposes only and is not intended to encourage the reader to deal in the security or securities mentioned within it.
Marten & Co is not authorised to give advice to retail clients. The research does not have regard to the specific investment objectives financial situation and needs of any specific person who may receive it.
The analysts who prepared this note are not constrained from dealing ahead of it, but in practice, and in accordance with our internal code of good conduct, will refrain from doing so for the period from which they first obtained the information necessary to prepare the note until one month after the note’s publication. Nevertheless, they may have an interest in any of the securities mentioned within this note.
This note has been compiled from publicly available information. This note is not directed at any person in any jurisdiction where (by reason of that person’s nationality, residence or otherwise) the publication or availability of this note is prohibited.
Accuracy of Content: Whilst Marten & Co uses reasonable efforts to obtain information from sources which we believe to be reliable and to ensure that the information in this note is up to date and accurate, we make no representation or warranty that the information contained in this note is accurate, reliable or complete. The information contained in this note is provided by Marten & Co for personal use and information purposes generally. You are solely liable for any use you may make of this information. The information is inherently subject to change without notice and may become outdated. You, therefore, should verify any information obtained from this note before you use it.
No Advice: Nothing contained in this note constitutes or should be construed to constitute investment, legal, tax or other advice.
No Representation or Warranty: No representation, warranty or guarantee of any kind, express or implied is given by Marten & Co in respect of any information contained on this note.
Exclusion of Liability: To the fullest extent allowed by law, Marten & Co shall not be liable for any direct or indirect losses, damages, costs or expenses incurred or suffered by you arising out or in connection with the access to, use of or reliance on any information contained on this note. In no circumstance shall Marten & Co and its employees have any liability for consequential or special damages.
Governing Law and Jurisdiction: These terms and conditions and all matters connected with them, are governed by the laws of England and Wales and shall be subject to the exclusive jurisdiction of the English courts. If you access this note from outside the UK, you are responsible for ensuring compliance with any local laws relating to access.
No information contained in this note shall form the basis of, or be relied upon in connection with, any offer or commitment whatsoever in any jurisdiction.
Investment Performance Information: Please remember that past performance is not necessarily a guide to the future and that the value of shares and the income from them can go down as well as up. Exchange rates may also cause the value of underlying overseas investments to go down as well as up. Marten & Co may write on companies that use gearing in a number of forms that can increase volatility and, in some cases, to a complete loss of an investment.