
On the right side of AI
The rapid progress of AI (especially agentic AI) has raised legitimate concerns over the business models of some companies within the software sector, affecting several private equity trusts exposed to these sorts of businesses. We believe these concerns are overstated for the companies in Oakley Capital Investments’ (OCI) portfolio. These appear well positioned to benefit from the next phase of AI adoption.
OCI’s portfolio is focused on businesses that benefit from having proprietary data (that the business owns or controls access to), specialist information, and deep sector expertise. For portfolio companies such as vLex, IU Group, and TechInsights, OCI’s manager believes AI is more likely to be an accelerant than a disruptor, increasing the value of the underlying business. OCI is also building direct exposure to AI businesses through its partnership with Touring Capital.
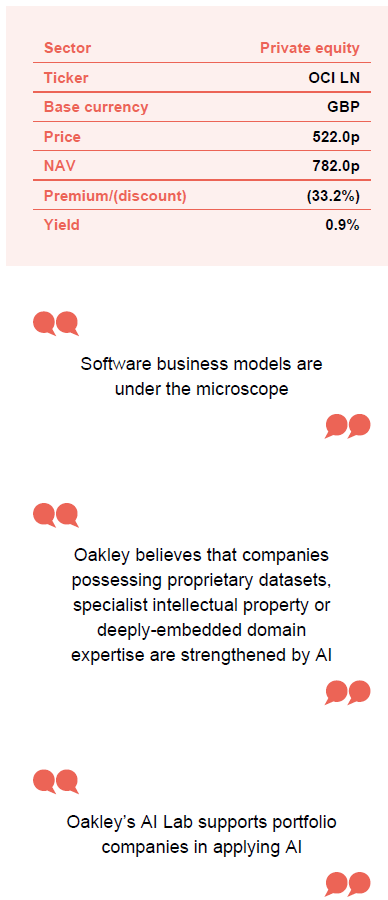
Portfolio performance remains strong, with NAV total return of 6.0% in the first half of 2026 (80% of the underlying portfolio performance was driven by earnings growth), despite challenging economic and geopolitical conditions. We believe resilient earnings growth, continued capital deployment, AI-related value creation, and ongoing share buybacks provide a compelling basis for a narrowing of OCI’s share price discount to NAV, which has widened to 33.2%.
Consistent long-term returns from private equity
OCI aims to deliver consistent long-term returns above the FTSE All-Share Index by providing exposure to private equity, where value is driven by market growth, consolidation and performance improvement.
At a glance
Share price and discount
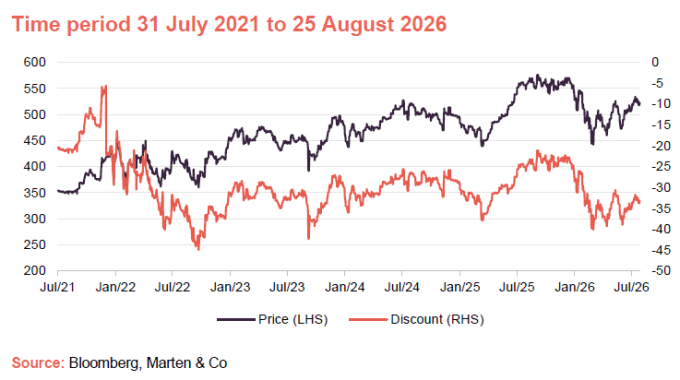
Over the 12 months ended 31 July 2026, OCI’s share price discount to NAV ranged between 40.1% and 21.1%, averaging 29.1% and it has widened since.
Concerns about the disruptive impacts of AI and the conflict in the Middle East have played a part in this.
Performance over five years
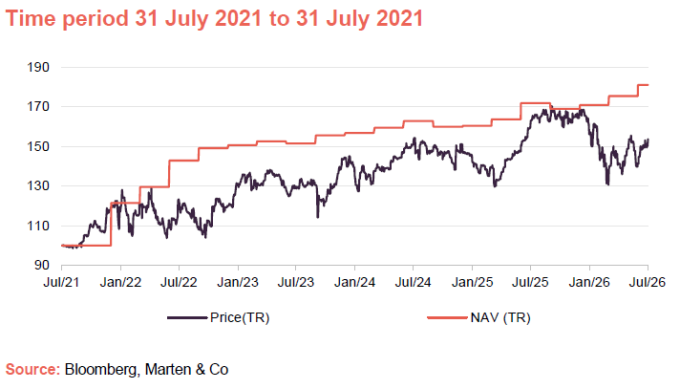
OCI has one of the best track records of NAV growth in the listed private equity sector. However, its share price has been volatile this year for the reasons mentioned above.
Last year, OCI’s shares performed strongly after “Liberation Day” in April 2025 as activity in private equity markets picked up and the pace of exits grew.
| Year ended | Share price total return (%) | NAV total return (%) | LPX Europe total return (%) | MSCI UK total return (%) | MSCI World total return (%) |
|---|---|---|---|---|---|
| 31/07/2022 | 23.3 | 42.9 | (21.3) | 12.0 | 3.9 |
| 31/07/2023 | 4.4 | 6.0 | (5.5) | 6.8 | 8.0 |
| 31/07/2024 | 19.2 | 7.5 | 21.1 | 13.5 | 19.1 |
| 31/07/2025 | 6.3 | 5.5 | 2.6 | 12.7 | 12.8 |
| 31/07/2026 | (5.8) | 5.4 | (6.9) | 23.6 | 18.7 |
About OCI
OCI gives shareholders access to private equity investments made by Oakley Capital (Oakley), which focuses on high-growth European companies with enterprise values of €100m-€1bn+. Oakley has delivered strong returns, with NAV and share price growth of around 90% and 110%, respectively, over the five years to end-2025. Performance has been driven by earnings growth, with average portfolio EBITDA increasing 11% in 2025, following 15% in 2024.
Partnering with business founders in four key sectors – technology, consumer, education and business services
Oakley takes controlling stakes in companies across four sectors: technology, consumer, education, and business services. It targets businesses that it considers are benefitting from structural trends including digital complexity, AI adoption, regulation, outsourcing, and rising demand for quality education.
Oakley primarily partners with business founders, with 77% of investments still being led by their original founder. This provides deal flow that is unique to Oakley, with 72% of investments being completed without a competitive auction, helping avoid high entry valuations. Founders and management have also invested more than €250m alongside Oakley, aligning their interests with OCI.
First through the door
Oakley is often the first institutional investor in its portfolio companies, combining capital with operational expertise to accelerate growth. Control positions enable value creation through bolt-on acquisitions (more than 350 completed), stronger management, business transformation and more recurring revenues. An in-house portfolio team provides support across areas including capital markets, data analytics, AI, talent and sustainability analytics.
Sharing ideas in areas such as AI
OCI also invests in Oakley’s Touring Fund, which targets AI-enabled software businesses at the Series B and C stages. Insights from these investments are shared across the wider portfolio, helping identify new growth opportunities.
OCI’s NAV grew 6% in 2025 (3% excluding foreign exchange), reflecting Oakley’s conservative valuations and a relatively young portfolio. Around 35% of year-end NAV is in investments made over the past two years, which should deliver stronger EBITDA growth and valuation uplifts as they mature.
Market backdrop
Software business models under the microscope
Rapid progress in the capability of reasoning models and AI agents, heightened by the launch of Anthropic’s Claude Cowork in early 2026, has put the strength of software companies’ business models under the microscope. Enterprise software companies have created value by digitising business processes and embedding themselves within customers’ daily workflows. Increasingly, however, AI models can navigate those workflows directly, completing complex tasks autonomously. Investors are therefore questioning whether some application-layer software (the topmost layer of software that users interact with) risks are becoming commoditised.
Software stocks’ share price performance has become increasingly polarised. Businesses whose competitive advantage rests primarily on workflow automation face growing doubts over long-term pricing power. By contrast, companies possessing proprietary datasets, specialist intellectual property or those that are deeply-embedded and have expert knowledge of the sectors and businesses that they serve, appear strengthened. OCI’s manager argues that AI increases customers’ reliance on enterprise data, enhancing the value of these businesses. Software companies’ share prices may not reflect this, but the manager believes they should start to once it is clear that they are making money from their “AI accelerant” characteristics.
Software sector polarised, with the value of proprietary data, specialist info or market expertise enhanced by AI
Much of OCI’s software exposure, which makes up about 20% of the wider portfolio, has a competitive advantage from proprietary content, specialist information or expertise in specific markets. The manager believes these advantages are increasingly valuable in an AI-enabled world.
vLex
Portfolio company vLex is a good example. LegalTech valuations fell after the Claude Cowork release earlier this year, as legal research appeared vulnerable to generative AI. Instead, OCI’s manager insists, AI has strengthened firms with the deepest proprietary legal datasets.
AI transformed vLex’s proprietary dataset into powerful competitive moat
vLex’s legal library exceeds one billion documents, helped by the 2022 acquisition of Fastcase. Under Oakley’s stewardship, it launched Vincent AI, an AI-powered legal workflow platform built on that proprietary content. Its value lies not in the underlying large language model, but in the unique structured legal data.
Lawyers use Vincent AI to prepare cases faster, build arguments, and test multiple legal strategies across jurisdictions. VLex serves the majority of the Am Law 100 (a ranking of the largest American law firms). Its sale to Clio at a US$1bn valuation showed the strategic value of combining proprietary information with AI-enabled workflows.
IU Group
AI being deployed to improve educational outcomes
A similar trend is evident across OCI’s portfolio. At IU Group, AI supports personalised learning, student engagement and operational efficiency, complementing rather than replacing education. Trusted content, accreditation and human interaction remain central.
IU launched its AI-powered learning companion, Syntea, in April 2022. The platform combines adaptive learning, personalised tutoring, instant feedback and progress tracking. Its latest version recognises students’ work environments, preferences and study goals, guiding them through courses using multiple formats and AI agents. It has improved both student retention and progress.
TechInsights
As investment in AI infrastructure has accelerated, demand for semiconductor intelligence has increased
TechInsights represents another beneficiary of this shift. The company reverse engineers and analyses the technical workings of advanced chips. As investment in AI infrastructure accelerates, demand for semiconductor intelligence has grown. Its value lies not in AI applications, but in information that becomes more valuable as technology grows more complex.
As AI evolves, competitive advantage may shift from businesses controlling user interfaces towards those with unique data, trusted content and specialist expertise.
On this basis, OCI’s portfolio appears well positioned, with many investments holding proprietary datasets, specialist intellectual property, regulated content and long-standing customer relationships. AI could make some software applications interchangeable, but businesses controlling the underlying information may become more valuable as adoption rises. OCI’s strategy appears positioned to benefit from this trend.
Tapping into AI expertise across the portfolio
Touring Capital invests in native AI businesses
OCI invests in AI-native businesses through Touring Capital, a Silicon Valley venture capital manager focused on AI-powered software companies, where OCI is the largest limited partner. Investments include CuspAI, which uses AI to accelerate materials discovery, and Parasail, which is developing cloud infrastructure for AI-native computing.
Portfolio company CuspAI has seen its value quintuple in less than a year
CuspAI uses generative AI and computational chemistry to identify materials with specific properties, including for semiconductors, batteries and carbon capture. It raised $450m in a July 2026 Series B funding (the second major stage of venture capital financing) round at a $2.6bn valuation. Existing investors, including Touring Capital, which first invested in June 2024, joined new backers including Bezos Expeditions, Kleiner Perkins, NEA, AMD Ventures and the UK’s Sovereign AI Venture Fund. The valuation was five times higher than in its September 2025 funding round.
Oakley’s AI Lab supports portfolio companies in applying AI
Oakley has established AI Lab to help portfolio companies identify practical AI uses, alongside AI forums involving Nvidia, Google and Anthropic.
Management is also developing AI tools for internal operations, including investment sourcing and market research, which it believes will improve decision-making across the investment process.
Asset allocation
Figure 1: Look-through geographic split of portfolio at 30 June 2026
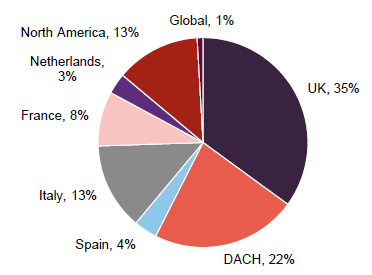
Figure 2: Look-through sector split of private equity funds and direct investment portfolio at 30 June 2026
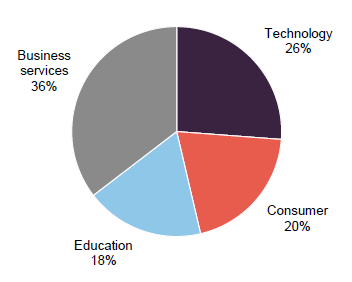
At 30 June 2026, OCI had net assets of £1,289m. It had £81m of cash and £74m undrawn credit facilities. At the end of 2025, the underlying portfolio was valued at an average EV/EBITDA ratio of 16.3x (in line with 2024); the EBITDA growth on the portfolio over 2025 was 11% on average; and the net debt/EBITDA ratio was 4.1x (Oakley points out that the industry average is about 5-6x).
Funds
Figure 3: OCI by fund at 31 December 2025
| Total size m | Year launched | Overall gross money multiple | Overall gross IRR | OCI commitment €m | OCI outstanding commitment £m | |
|---|---|---|---|---|---|---|
| Fund III | €800 | 2016 | 4.0x | 50% | 326 | 24 |
| Fund IV | €1,460 | 2019 | 2.2x | 24% | 400 | 79 |
| Origin I | €458 | 2021 | 2.0x | 28% | 129 | 15 |
| Fund V | €2,851 | 2022 | 800 | 318 | ||
| Fund VI | €4,500 | 2025 | 500 | 387 | ||
| PROfounders III | €77 | 2022 | 30 | 16 | ||
| Touring | $255 | 2023 | 98 | 26 | ||
| Origin II | €791 | 2023 | 190 | 128 | ||
| Total | 992 |
Figure 3 provides detail on OCI’s commitments by fund – both the original commitment and the amount outstanding at end December 2025, and (where appropriate) the realised returns generated. As at 30 June 2026, OCI’s outstanding commitments had reduced to £940m. The board believes that about £300m of this is not likely to be drawn. The balance should be deployed over the course of the next five years.
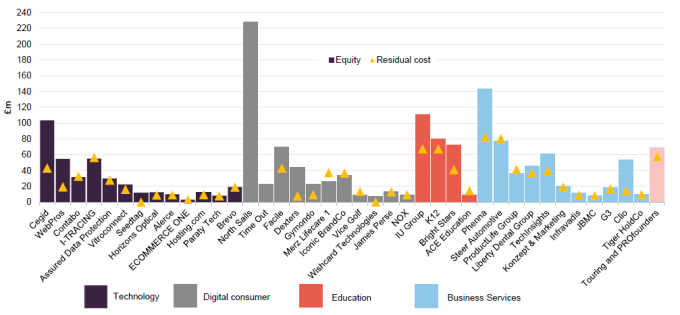
Figure 4: Portfolio split by company as at 31 December 2025
Recent new transactions
Oakley had an extremely busy end to 2025 (which we covered in our previous note). It has been a much quieter 2026 so far. Here, we profile its most recent deals.
Groupe Senef
Oakley announced in March that Origin II had agreed to invest in Groupe Senef, a French provider of cloud-based software for people-intensive services businesses. OCI’s look-through contribution was around £9m.
Founded in 2010 by Momar Mbaye and Tariq Hamadouch, Senef provides mission-critical software to around 2,000 customers in commercial cleaning, home care, security and hospitality. Its products cover administration, workforce management, payroll, compliance and invoicing. These regulated, labour-intensive sectors are increasingly adopting modern software and AI automation to improve efficiency.
Oakley will support product innovation, including AI, and selective acquisitions to broaden Senef’s offering and reach. The founders will continue to lead the business, with former TotalMobile CEO Jim Darragh joining the board. The investment further strengthens Oakley’s presence in the French software market, following previous investments including Brevo and I-Tracing.
XTEL
Oakley announced in May that Fund VI had agreed to acquire a majority stake in XTEL, a provider of revenue management and trade promotion software for consumer packaged goods companies. OCI’s look-through contribution via Fund VI is expected to be up to £33m.
XTEL helps food, beverage and household goods companies plan and improve retailer promotions using sales, pricing, customer and financial data. It serves more than 400 global brands, including Unilever, PepsiCo and Johnson & Johnson, and supports over €350bn of annual trade spend. The company operates in an estimated $11bn market, supported by retailer consolidation, greater data availability and wider use of AI. It has delivered around 40% annualised growth over the past three years.
Oakley will support international expansion, particularly in Latin America and Asia-Pacific, and investment in AI, products, sales and acquisitions. CEO Rob Mullen will remain in charge, having led XTEL’s move to a SaaS platform and recent organic and acquisition-led growth.
Performance
Figure 5: OCI performance over the five years ended 31 July 2026
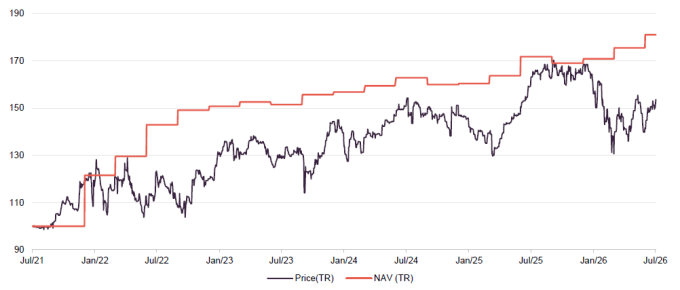
OCI’s share price has been volatile this year, with the Iran war hitting investor sentiment towards private equity exit landscape and the indiscriminate agentic-AI-related software sell-off weighing on valuations. Last year, OCI’s shares performed strongly after “Liberation Day” in April 2025 as activity in private equity markets picked up and the pace of exits grew.
Figure 6: Cumulative performance over various time periods ended 31 July 2026
| 3 months(%) | 6 months(%) | 1 year(%) | 3 years(%) | 5 years(%) | |
|---|---|---|---|---|---|
| Share price | 8.8 | (1.5) | (5.8) | 19.4 | 53.6 |
| NAV | 3.2 | 6.0 | 5.4 | 19.5 | 81.0 |
| Peer group share price median | 3.4 | (2.7) | 1.2 | 19.1 | 42.8 |
| Peer group NAV median | 0.8 | 1.6 | 1.6 | 12.5 | 41.9 |
| LPX Europe1 | 4.6 | (5.8) | (6.9) | 15.7 | (13.9) |
| MSCI UK | 5.2 | 9.1 | 23.6 | 58.1 | 89.0 |
| MSCI World | 5.3 | 10.3 | 18.7 | 59.5 | 79.0 |
Trading update for six months ended 30 June 2026
6% NAV total return in H1 2026
The company delivered a NAV total return of 6.0% (44p), or 6.5% (48p) excluding the impact of foreign exchange, while total shareholder return was -16%, reflecting discount widening during the first quarter. The NAV uplift was underpinned by continued strong portfolio fundamentals, with 80% of portfolio performance driven by sustained earnings growth and the remaining 20% by valuation multiple expansion. We think this demonstrates the resilience and increasing maturity of the portfolio, despite macroeconomic and geopolitical uncertainty.
The largest contributors to performance were Phenna, North Sails, TechInsights and Exaforce, supported by broad-based value creation across the portfolio and successful buy-and-build strategies, particularly within business services.
OCI made look-through investments of £43m during the period, comprising £19m of new platform investments (including Senef, GB1 and Infinity) and £24m of follow-on investments (including K&M, ProductLife Group and ECOMMERCE ONE) to support continued growth across the portfolio.
OCI’s look-through share of proceeds from exits and refinancings totalled £10m during the period. The company also continued to deploy capital through its share buyback programme, repurchasing and cancelling 1.9m shares for £9.4m, enhancing NAV per share by 2.9p, while ending the period with £155m of available liquidity and approximately £640m of investment commitments expected to be drawn over the next five years.
Premium/discount
29.1% average discount over 12 months
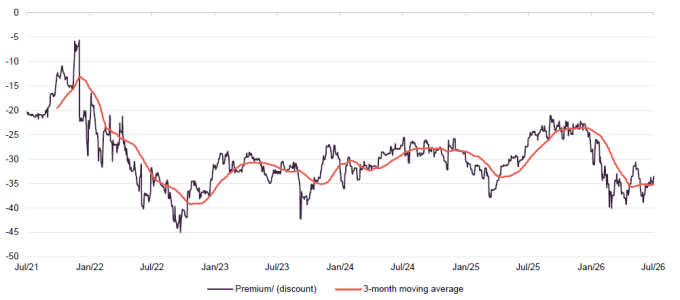
Over the 12 months ended 31 July 2026, OCI’s share price discount to NAV ranged between 40.1% and 21.1%, averaging 29.1%. At the time of publishing, the discount was 33.2%.
As noted earlier, concerns about the disruptive impacts of AI and the conflict in the Middle East have weakened market sentiment and widened OCI’s discount from 22.5% at the start of the year.
Figure 7: OCI discount over five years ended 31 July 2026
OCI last paid a dividend in April 2025. The board believes shareholders would benefit more if these funds were used for share buybacks. It committed to buy back at least £20m of shares annually, repurchasing and cancelling £50m in 2025. In the first six months of 2026, it acquired and cancelled 1.9m shares for £9.4m.
SWOT and bull vs. bear analysis
Figure 8: SWOT analysis
| Strengths | Weaknesses |
|---|---|
| Manager’s long-term track record, focus on businesses and sectors benefitting from structural trends where the manager has deep expertise, and differentiated investment sourcing. | Weak sentiment to the private equity sector could undermine the buy case for OCI. |
| Robust portfolio earnings growth. | Exposure to software companies perceived to be under threat from AI. |
| Opportunities | Threats |
| Deployment into attractive vintages with lower valuations caused by heightened uncertainty. | The threat of AI to the software sector proves founded, to the detriment of valuations. |
| An improving exit environment. | The exit landscape remains challenged for an extended period of time. |
Figure 9: Bull versus bear case
| Bull | Bear | |
|---|---|---|
| Performance | Strong NAV growth driven by operational improvements, disciplined acquisitions and a differentiated sourcing model. Proven track record of realisations above carrying value supports valuation credibility. | NAV growth slows if portfolio earnings weaken or exit markets remain constrained. Valuations may prove optimistic if market multiples contract further. |
| Dividends | The shift from a nominal dividend to systematic share buybacks should be more accretive to NAV per share while the shares trade at a significant discount. | The removal of the dividend narrows the trust’s appeal to income-focused investors and increases reliance on capital appreciation. If the discount remains wide despite buybacks, shareholders may question whether capital is being deployed in the most effective way. |
| Outlook | Structural growth sectors, an experienced manager and significant dry powder position the portfolio to benefit as deal activity and exits recover. | Higher interest rates, macroeconomic uncertainty and subdued M&A activity could delay exits, suppress valuations and weigh on NAV growth. |
| Discount | A sustained record of NAV growth, successful exits and shareholder-friendly capital allocation could drive a narrowing of the discount. | The discount could remain persistently wide if investor sentiment towards listed private equity remains weak, regardless of underlying portfolio performance. |
Previous publications
You can read these notes by clicking the links or visiting our website, quoteddata.com.
Figure 10: QuotedData’s previously published notes on OCI
| Title | Note type | Date |
|---|---|---|
| The best-performing UK-listed private equity fund | Initiation | 4 April 2023 |
| Walking the walk | Update | 15 December 2023 |
| Getting down to business | Update | 2 April 2024 |
| In a class of its own | Update | 19 September 2024 |
| Primed for future NAV growth | Update | 28 March 2025 |
| Southern Europe strategy plays to strengths | Update | 12 February 2026 |
IMPORTANT INFORMATION
Marten & Co (which is authorised and regulated by the Financial Conduct Authority) was paid to produce this note on Oakley Capital Investments Limited.
This note is for information purposes only and is not intended to encourage the reader to deal in the security or securities mentioned within it.
Marten & Co is not authorised to give advice to retail clients. The research does not have regard to the specific investment objectives financial situation and needs of any specific person who may receive it.
The analysts who prepared this note are not constrained from dealing ahead of it but, in practice, and in accordance with our internal code of good conduct, will refrain from doing so for the period from which they first obtained the information necessary to prepare the note until one month after the note’s publication. Nevertheless, they may have an interest in any of the securities mentioned within this note.
This note has been compiled from publicly available information. This note is not directed at any person in any jurisdiction where (by reason of that person’s nationality, residence or otherwise) the publication or availability of this note is prohibited.
Accuracy of Content: Whilst Marten & Co uses reasonable efforts to obtain information from sources which we believe to be reliable and to ensure that the information in this note is up to date and accurate, we make no representation or warranty that the information contained in this note is accurate, reliable or complete. The information contained in this note is provided by Marten & Co for personal use and information purposes generally. You are solely liable for any use you may make of this information. The information is inherently subject to change without notice and may become outdated. You, therefore, should verify any information obtained from this note before you use it.
No Advice: Nothing contained in this note constitutes or should be construed to constitute investment, legal, tax or other advice.
No Representation or Warranty: No representation, warranty or guarantee of any kind, express or implied is given by Marten & Co in respect of any information contained on this note.
Exclusion of Liability: To the fullest extent allowed by law, Marten & Co shall not be liable for any direct or indirect losses, damages, costs or expenses incurred or suffered by you arising out or in connection with the access to, use of or reliance on any information contained on this note. In no circumstance shall Marten & Co and its employees have any liability for consequential or special damages.
Governing Law and Jurisdiction: These terms and conditions and all matters connected with them, are governed by the laws of England and Wales and shall be subject to the exclusive jurisdiction of the English courts. If you access this note from outside the UK, you are responsible for ensuring compliance with any local laws relating to access.
No information contained in this note shall form the basis of, or be relied upon in connection with, any offer or commitment whatsoever in any jurisdiction.
Investment Performance Information: Please remember that past performance is not necessarily a guide to the future and that the value of shares and the income from them can go down as well as up. Exchange rates may also cause the value of underlying overseas investments to go down as well as up. Marten & Co may write on companies that use gearing in a number of forms that can increase volatility and, in some cases, to a complete loss of an investment.