
Back this horse
Vietnam has largely overcome the effects of US tariffs and is pushing ahead with reforms to support its target of double-digit annual GDP growth through to 2030. While one of Vietnam Holding (VNH)’s comparator indices rose 28% in 2025, more than half of this was due to a single company that VNH does not hold.
Despite strong growth prospects, most of the Vietnamese market is still attractively priced, with VNH’s portfolio trading at a forecast P/E of just 9.5x at the end of December 2025. This is partly because foreign investors have not yet returned in force. Progress towards emerging market status continues, with FTSE Russell set to upgrade Vietnam from September this year.
The year of the Fire Horse begins on 17 February 2026, seen as a lucky period by some. For others, Vietnam’s strong fundamentals remain a solid reason for optimism.
Capital growth from a concentrated portfolio of high growth Vietnamese companies
VNH aims to provide investors with long-term capital appreciation by investing in a portfolio of high-growth companies in Vietnam. These should come at an attractive valuation and demonstrate strong environmental, social, and corporate governance awareness.
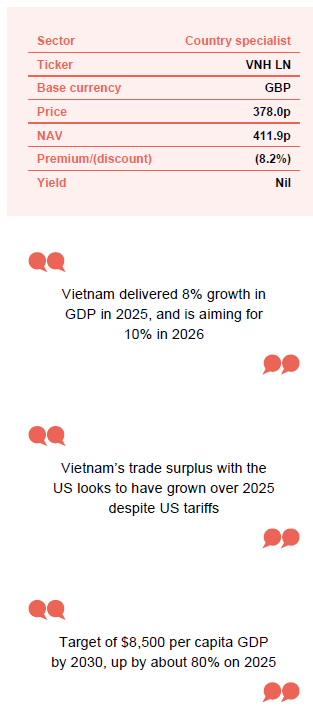
At a glance
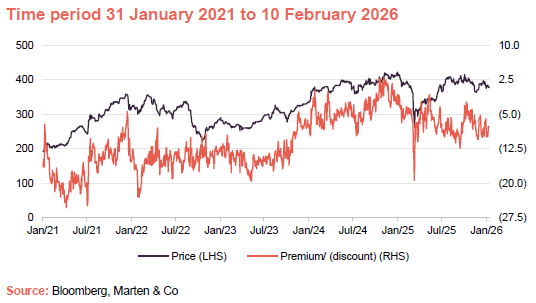
Share price and discount
Over the 12 months to January 2026, VNH’s shares traded at a discount to net asset value (NAV) of between 0.7% and 19.4%, averaging 6.8%. On 10 February 2026, the discount was 8.2%.
The board aims to keep the discount narrow and eventually issue new shares at a premium if investor demand returns. In January 2025, a small number of shares were issued.
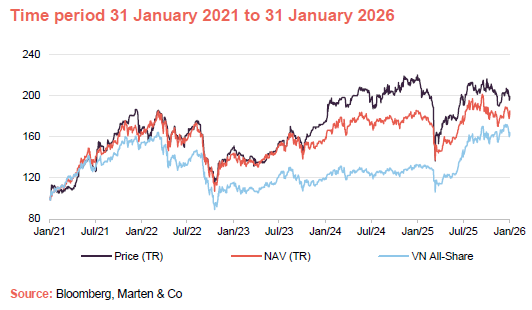
Performance over five years
VNH has recently underperformed the VNAS, which has affected its longer-term returns. This is mainly due the manager’s decision not to hold Vingroup, which is discussed on page 7. Vingroup’s high valuation has been a key factor.
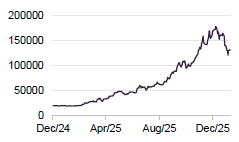
We believe Vingroup’s rapid growth, which Figure 5 shows has already stalled (see page 7), may reverse and improve VNH’s relative performance.
| Year ended | Share price total return (%) | NAV total return (%) | Vietnam All-Share total return (%) | MSCI Emerging Marketstotal return (%) |
|---|---|---|---|---|
| 31/01/2022 | 67.7 | 64.0 | 54.4 | (5.1) |
| 31/01/2023 | (9.9) | (12.2) | (25.1) | (3.9) |
| 31/01/2024 | 15.5 | 9.3 | 2.4 | (5.6) |
| 31/01/2025 | 23.0 | 17.4 | 11.8 | 17.7 |
| 31/01/2026 | (7.3) | (0.0) | 23.8 | 30.4 |
Source: Bloomberg, Marten & Co
Fund profile – listed Vietnamese equities with strong ESG focus
Further information on VNH can be found at the company’s website: www.vietnamholding.com
VNH is a closed-end fund based in Guernsey, aiming for long-term capital growth by investing in a focused portfolio of high-growth Vietnamese companies with strong ESG standards. It mainly invests in publicly traded companies in Vietnam, but can also invest up to 25% of its assets in foreign companies with most of their business in Vietnam. The fund may hold equity-like securities, such as convertible bonds, and up to 20% in private companies.
VNH does not have an official benchmark, but the manager usually compares it to the VN All-Share and MSCI Emerging Markets Index in its literature.
Macroeconomic outlook
Vietnam delivered 8% growth in GDP in 2025
Vietnam’s GDP grew by 8% in 2025, up from 7.1% in 2024, with growth picking up during the year due to government reforms and its efforts to stimulate the economy. On 19 December 2025, 148 new infrastructure projects were launched and 86 more were formally opened, together worth $129bn. Major projects include Long Thanh International Airport, set to open later this year with capacity for 100 million passengers (Heathrow handled 84.5 million in 2025), the 400km Lao Cai–Hanoi–Hai Phong railway, three metro lines, and a new Olympic park in Hanoi.
Tourism also performed strongly, with international arrivals rising 20% in 2025 to a record 21.2 million, mostly from other Asian countries, especially China and South Korea.
Tariffs – not as bad as feared
Vietnam’s trade surplus with the US looks to have grown over 2025 despite US tariffs
Our last update on VNH was on 29 April 2025, just after “Liberation Day,” when Trump introduced steep tariffs on Vietnamese imports, starting at 46%. Following a market backlash, the US temporarily reduced the rate to 10%. Vietnam responded quickly and was one of only two countries to secure a trade deal with the US before the 9 July deadline. The deal is uneven, with Vietnamese exports to the US facing a 20% tariff, while US goods enter Vietnam tariff-free. Despite this, Vietnam’s trade surplus with the US appears to have increased in 2025. VNH’s manager notes that electronics and computers played a major role, highlighting Vietnam’s move towards higher-value manufacturing.
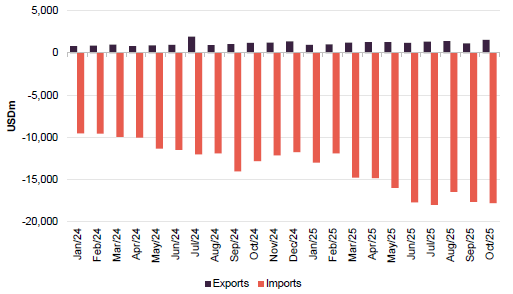
Figure 1 using US Census Bureau data, shows that by the end of October 2025, the US had imported $158bn of goods from Vietnam, resulting in a trade deficit of $146bn.
Figure 1: US exports/imports to/from Vietnam
Source: The US Census Bureau
Vietnamese figures show that Vietnam’s total exports are expected to reach $475bn in 2025, a 17% increase from the previous year. Exports to the US are projected at $153bn. Despite some differences in reported figures, the main point is that US tariffs have had less impact on Vietnam than expected. Vietnam also benefits from trade agreements with key partners like China.
Inflation, interest rates, and currency
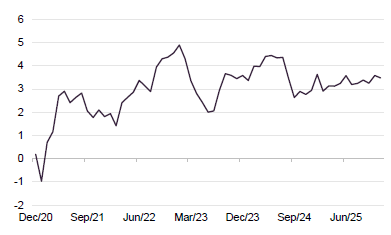
Figure 2: Vietnam CPI
Source: Bloomberg
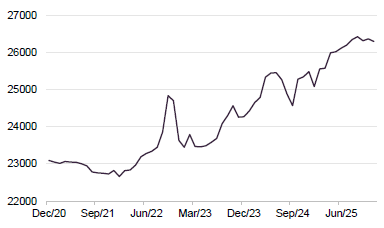
Figure 3: Vietnamese Dong US dollar exchange rate
Source: Bloomberg
Figure 2 shows that inflation is stable and at a comfortable level. The official interest rate has stayed at 4.5% since June 2023, while lending rates rose by 1 percentage point towards the end of 2025, which the manager considers manageable. Credit growth was strong in 2025, rising 19% year-on-year. The government is running a budget surplus and there has also been commitments to foreign direct investment of $38.4bn, with $27.6bn disbursed. Despite this, the Vietnamese Dong has weakened slightly against the US dollar and more significantly against sterling (see page 10).
Politics – driving an ambitious growth agenda
Target of $8,500 per capita GDP by 2030, up by about 80% on 2025
The 14th Party Congress concluded without drama, confirming Tô Lâm as General Secretary for another five years. To reach its goal of becoming a high-income country by 2045, Vietnam is aiming for 10% GDP growth in 2026 and hopes to keep this pace until 2030. The target is to reach per capita GDP of $8,500 by 2030, up from about $4,700 in 2024. For context, China’s per capita GDP in 2025 was about $13,800. As household wealth rises and the middle class grows, this is expected to boost retail sales and the services sector. The manager notes strong political backing for the economy, highlighting two key “Resolutions”.
Resolution 68
In May 2025, Resolution 68 recognised the private sector as the main driver of Vietnam’s economic growth. The plan aims to double the number of private businesses to 2 million by 2030, then reaching 3 million by 2045. It also targets the creation of at least 20 large Vietnamese companies with strong brands that can compete globally and support industrial growth. Some see this as an effort to replicate the success of South Korea’s major business groups like Samsung and Hyundai, which has helped boost Vin Group’s share price.
The government wants to see 10%–12% annual growth in the private sector. To achieve this, it is working to cut bureaucracy, improve access to finance, reform taxes, and stop favouring state-owned and foreign companies over local private firms. This is expected to lead to more initial public offerings (IPOs) and privatisations.
Resolution 79
Creating national champions to become leading Asian companies
In January 2026, Resolution 79 built on Resolution 68 by setting a target for at least 50 state-owned enterprises (SOEs) to be among Asia’s 500 largest companies by 2030. The aim is that this growth will also benefit the private businesses that support these SOEs. The resolution also wants three state-owned commercial banks to be ranked among Asia’s top 100 banks by 2030.
Importantly, SOEs are expected to reach these goals without special state support and to adopt governance standards in line with the OECD.
Markets
EM status
FTSE Russell upgraded Vietnam to emerging market status last year, with the change set for review in March and, assuming all goes well, the upgrade will be implemented in September. However, the impact may be limited as most investors and tracker funds tend to prefer MSCI indices. MSCI is also expected to reassess Vietnam’s status. Vietnam now accounts for over 30% of MSCI’s frontier markets index and has daily trading volumes averaging over $1bn, surpassing many emerging markets. There are also reports that Vanguard may launch funds focused on Vietnam.
Valuations and the Vingroup problem
Figure 4: Valuation data
| Historic P/E (x) | Current P/E (x) | Forecast P/E (x) | |
|---|---|---|---|
| Vietnam Ho Chi Minh VN All-Share (VNAS) | 13.2 | 11.1 | 9.2 |
| Vietnam Ho Chi Minh Stock Index (VNI) | 14.8 | 13.1 | 10.9 |
| MSCI Vietnam | 16.7 | 15.3 | 12.8 |
| MSCI Emerging Markets | 17.8 | 17.0 | 13.3 |
| MSCI ACWI | 22.5 | 22.1 | 19.3 |
Source: Bloomberg as at 9 February 2026
VNH compares its returns to the Vietnam Ho Chi Minh VN AllShare (VNAS), while peers use the more large-cap focused Vietnam Ho Chi Minh Stock Index (VNI). The MSCI Vietnam Index is even more concentrated. All three indices have significant exposure to Vingroup, which VNH does not hold due to concerns about its fundamentals, low liquidity, and governance. Vingroup owns a range of businesses, including resorts, robotics, cybersecurity, the NASDAQ-listed VinFast Auto, and Vinhomes, which is in VNH’s top 10 holdings.
Figure 5: Vingroup (VND)
Source: Bloomberg
As shown in Figure 5, Vingroup’s share price performed very strongly in 2025. The manager attributes this to a small free float and strong domestic demand, partly linked to hopes it will be a leading group under Resolution 68. This has pushed its valuation up, with a P/E ratio of 79x at publication. At December 2025, Vingroup and related companies made up about a quarter of the Ho Chi Minh Stock Exchange’s market capitalisation. Vingroup alone was 25.3% of the MSCI Vietnam Index, with Vinhomes at 8.3%. VNAS is adjusted for free float, but the manager believes that, due to Vingroup’s large size, none of these indices are valid or replicable benchmarks.
Vingroup has distorted the performance of VNH’s benchmark comparator
As a result, the Vietnamese market appears more expensive, and indices performed better in 2025 than they otherwise would have. For example, Vingroup made up about half of the VNI’s return.
A growing market in Vietnamese corporate bonds
The equity market is strong, with IPO activity returning after seven years – three IPOs raised $1.5bn in 2025, with more expected this year. VNH’s manager notes the government aims to grow Vietnam’s corporate bond market to provide more capital for expanding companies. According to FiinRatings, VND644.3trn of corporate bonds were issued by 122 issuers in 2025, bringing the market total to VND1,413trn across 321 issuers. This represents about 11.4% of GDP, well below the government’s 20% target for 2025, and is small compared to other markets and Vietnam’s equity market.
New rules limiting financial leverage to five times debt-to-equity should boost credit quality, while a Ministry of Finance decision allowing new investment funds is expected to direct more domestic savings into the bond market.
Asset allocation
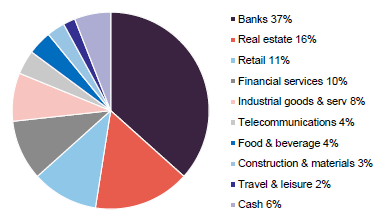
As at 31 December 2025, VNH’s portfolio held 25 securities, up from 23 at 31 March 2025. These holdings were valued at an average of 9.5 times expected earnings, with potential for 18% earnings growth. The top 10 holdings made up 63.7% of the portfolio at year-end, down slightly from 65.6%.
Figure 6: VNH portfolio sectoral allocation as at 31 December 2025
Source: Dynam Capital, Marten & Co
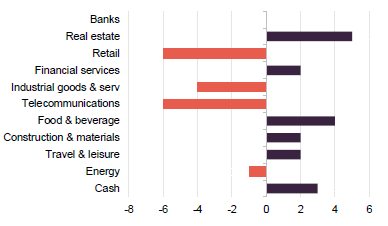
Figure 7: VNH change in portfolio sectoral allocation since 31 March 2025
Source: Dynam Capital, Marten & Co
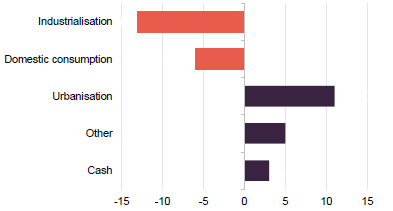
There has been a shift towards more real estate and urbanisation exposure, reflecting a stronger residential property market and a rise in Vinhome’s share price.
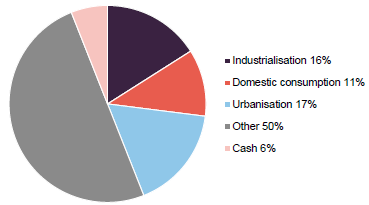
Figure 8: VNH portfolio by theme as at 31 December 2025
Source: Dynam Capital, Marten & Co
Figure 9: VNH change to split of portfolio by theme since 31 March 2025
Source: Dynam Capital, Marten & Co
Top 10 holdings
Since our last report using data from March 2025, Sacombank, Sai Gon VRG Investment, FPT Digital Retail, and Phu Nhuan Jewelry have left the top 10 holdings. They have been replaced by VP Bank, Vinhomes, VietinBank, and SSI Securities.
Figure 10: Top 10 holdings as at 31 December 2025
| Stock | Sector | Portfolio weight 31 Dec 2025 (%) | Portfolio weight 31 Mar 2025 (%) | Change(%) |
|---|---|---|---|---|
| Mobile World | Retail | 10.0 | 8.2 | 1.8 |
| MB Bank | Banks | 8.5 | 7.3 | 1.2 |
| Hoa Phat Group | Industrials | 7.4 | 6.1 | 1.3 |
| VPBank | Banks | 6.4 | 6.6 | (0.2) |
| Techcombank | Banks | 6.4 | 8.7 | (2.3) |
| Vinhomes | Real estate | 6.1 | 3.9 | 2.2 |
| Asia Commercial Bank | Banks | 5.4 | 7.3 | (1.9) |
| VietinBank | Banks | 5.4 | 5.7 | (0.3) |
| SSI Securities | Financials | 4.5 | 4.4 | 0.1 |
| FPT Group | Telecommunications | 3.6 | 9.8 | (6.2) |
| Total of top 10 | 63.7 | 65.6 |
Source: Vietnam Holding Limited, Marten & Co
Mobile World
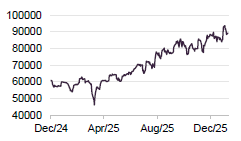
Figure 11: Mobile World share price (VND)
Source: Bloomberg
Mobile World Investment Corporation (mwg.vn) is Vietnam’s top multi-category retailer, operating over 6,000 stores and a fast-growing ecommerce business, with a joint venture expanding into Indonesia. Phones and accessories make up 38% of revenue, but its range also includes food, consumer goods, electronics, pharmaceuticals, and mother & baby products. In 2025, revenue rose 16% to over VND156 trillion, beating its target by 4% and outpacing Vietnam’s retail sales growth of 9.2%.
For 2026, Mobile World is aiming for 18% revenue growth and 30% profit growth, aided by supportive government policy along with plans to use AI to cut costs, boost productivity, and improve efficiency. The company’s in-house warehousing, logistics, delivery, installation, and after-sales services also support these goals.
VNH’s manager is optimistic about rising consumer spending and Mobile World’s growth prospects.
VPBank
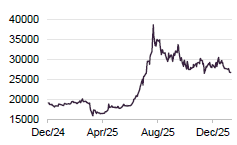
Figure 12: VPBank share price (VND)
Source: Bloomberg
The manager notes that Vietnam’s banks are generally strong, supported by favourable monetary policy, robust credit growth, low bad debts, and healthy provisions. The real estate market recovery is also benefiting the sector. The manager expects bank share prices to rise further in 2026.
Vietnam Prosperity Joint-Stock Commercial Bank, or VPBank (vpbank.com.vn/en), aims to be among Asia’s 100 largest banks, though as a private bank it does not count towards Resolution 79 targets. In the fourth quarter of 2025, VPBank reported 35% year-on-year loan growth, a 52% rise in profit before tax, and a 52% increase in earnings per share, driven by strong credit growth and lower provisions. Analysts also note improving asset quality.
Vinhomes
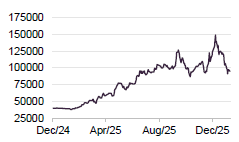
Figure 13: Vinhomes share price (VND)
Source: Bloomberg
Vinhomes (vinhomes.vn/en) is one of Vietnam’s largest property developers. In 2025, it saw a strong recovery in sales after a tough period for the residential market. Pre-sales of new homes are at record highs, prices are rising, and margins are improving. The company is targeting 27% revenue growth and 20% profit growth for 2025.
Vinhomes has a large residential landbank of over 17,000 hectares; more than 10 times larger than its nearest competitor. It also has a 1,970-hectare industrial landbank and 379,000 square metres of office space, with 75% occupancy.
Its development pipeline includes major projects such as the Olympics Village in Hanoi, supporting Vietnam’s bid to host the Asian Games and potentially the Olympics.
VietinBank
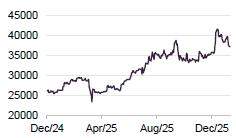
Figure 14: VietinBank share price (VND)
Source: Bloomberg
The manager describes The Vietnam Joint Stock Commercial Bank for Industry and Trade or VietinBank (vietinbank.vn/en) as a well-run, state-owned bank with strong performance. It has a high return on equity of 21.6% expected in 2025, a low cost-to-income ratio of around 27%, and low bad debts with a non-performing loan ratio of about 1%. The bank has achieved over 25% annual profit growth in recent years, supported by reduced bad debts. Its valuation is appealing at about 1.6 times book value and 8.3 times earnings. As a State-owned bank, VietinBank also helps finance government infrastructure projects. Headquartered in Hanoi, it operates nationwide.
SSI Securities
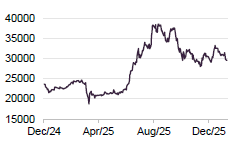
Figure 15: SSI Securities share price (VND)
Source: Bloomberg
SSI Securities (ssi.com.vn/en) is one of Vietnam’s top three brokers, holding a 12.5% market share at the end of 2025. In 2025, revenue rose 54% and profits increased 46% compared to 2024, driven by higher trading volumes, growth in margin lending and fund management, and new product launches. Over 800,000 new trading accounts were opened in the fourth quarter of 2025. SSI also has a strong position in bond underwriting, which it should benefit from if the corporate bond market grows as expected.
Performance
VNH reports its NAV in US dollars, but for Figure 16 we have converted returns into sterling. As shown in Figure 3, the Vietnamese Dong fell by about 3% against the US dollar in 2025. Against sterling, the Dong’s drop was steeper, down about 12% over the 12 months to January 2026.
Figure 16: Cumulative total return performance over periods ending 31 January 2026
| 3 months(%) | 6 months (%) | 1 year (%) | 3 years(%) | 5 years(%) | Since 31 Mar 191 (%) | 10 years(%) | |
|---|---|---|---|---|---|---|---|
| VNH NAV | (8.0) | 4.1 | (7.3) | 31.7 | 99.0 | 111.0 | 210.1 |
| VNH share price | (0.9) | 5.3 | (0.0) | 28.3 | 85.0 | 102.7 | 183.4 |
| VN All-Share | 2.0 | 14.3 | 23.8 | 41.7 | 63.9 | 80.9 | 208.0 |
| MSCI Emerging Markets | 4.9 | 19.6 | 30.4 | 44.9 | 32.3 | 65.8 | 184.5 |
Source: Bloomberg, Marten & Co. Note 1) We are using the 31 March 2019 as a cut off for when VNH’s board and manager had completed their remedial measures (largely corporate governance- and investment management-related) as part of the major overhaul that was undertaken to address failings on the part of the previous board and investment manager (see page 4 of our December 2019 note for more details of these).
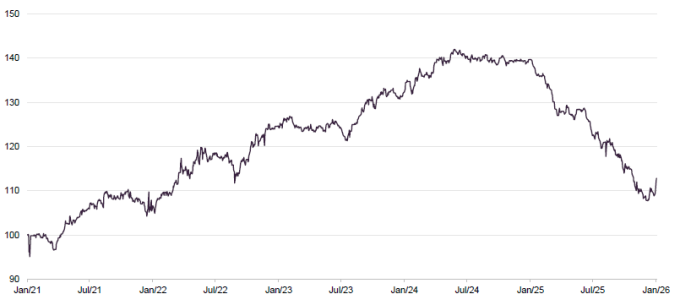
As shown in Figure 17, VNH has recently underperformed the VNAS, which has affected its longer-term returns. This is mainly due to not holding Vingroup, as discussed earlier. Vingroup’s high valuation has been a key factor.
We believe Vingroup’s rapid growth, which Figure 5 shows has already stalled, may reverse, aiding VNH’s relative performance in the process.
This shift in relative performance is clear from February 2025 onwards.
Figure 17: VNH’s NAV performance relative to the VN All-Share over five years to 31 January 2026
Source: Bloomberg, Marten & Co
Premium/(discount)
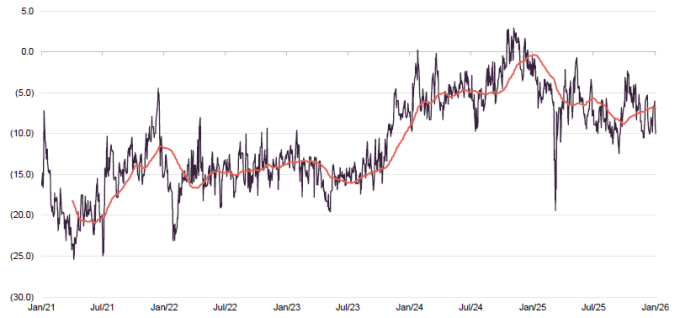
Over the 12 months to January 2026, VNH traded at a discount between 0.7% and 19.4%, averaging 6.8%. On 10 February 2026, the discount was 8.2%.
The board aims to keep the discount narrow with the hope of issuing new shares at a premium if investor demand returns. In January 2025, a small number of shares were issued.
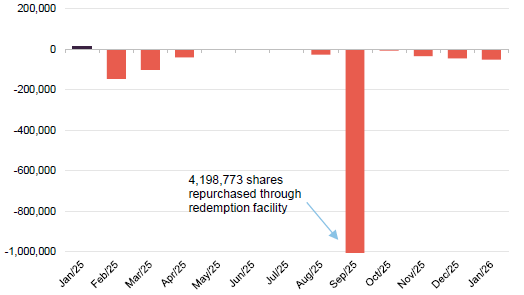
Alongside regular share buybacks, VNH runs an annual redemption facility, first used in September 2024 after being announced in late 2023. About 12% of shares were redeemed in the first round. This facility has helped keep the discount tight. To take part, shareholders must have held their shares for at least six months, which discourages short-term trading.
Figure 18: VNH premium/(discount) over five years
Source: Bloomberg, Marten & Co
In 2025, investors chose to redeem around 4.2 million shares, representing about 17.9% of VNH’s shares in issue.
Figure 19: VNH share repurchases over the past year
Source: Vietnam Holding
SWOT and bull versus bear analysis
Figure 20: SWOT analysis for VNH
| Strengths | Weaknesses |
|---|---|
| Great long-term track record of NAV and share price growth | Lack of exposure to Vingroup has damaged track record in the short term |
| Tough on discount control, including provision of annual redemption facility | Annual redemption opportunity creates risk that the company may become too small to be viable, especially if it coincides with a period of difficult markets |
| Small enough to be nimble in what can still be an illiquid market | Small size pushes up expense ratio and reduces liquidity in VNH’s shares |
| Opportunities | Threats |
| Vietnamese market and stocks in VNH’s portfolio are cheap, especially considering their growth potential | Unpredictable White House could double down if US/Vietnam trade deficit widens further |
| When foreign investor confidence returns, VNH is positioned to re-expand | |
| Vingroup’s bubble might burst to the benefit of VNH’s relative performance |
Source: Marten & Co
Figure 21: Bull versus bear case for VNH
| Aspect | Bull case | Bear case |
|---|---|---|
| Performance | Good long-term | Vingroup weighs on short-term numbers |
| Dividends | N/A | N/A |
| Outlook | Vietnam’s government has its foot on the economy’s accelerator, which should feed through into positive share price performance | Unpredictable White House could impose new tariffs; any slowdown in the global economy could weigh on Vietnam’s exports |
| Discount | Strong discount control has been achieved through shrinking the trust, but renewed appetite for the shares could see it trading at a premium and issuing stock | Continued shrinkage makes VNH’s shares less liquid, which could exacerbate discount problem |
Source: Marten & Co
Previous publications
Readers interested in further information about VNH, such as investment process, fees, capital structure, life and the board, may wish to read our note – Cheap stocks, bold reforms, big ambitions – published on 29 April 2025, as well as our previous notes (details are provided in Figure 22 below). You can read the notes by clicking on them in Figure 22 or by visiting our website.
Figure 22: QuotedData’s previously published notes on VNH
| Title | Note type | Publication date |
|---|---|---|
| Silent revolution | Initiation | 11 December 2019 |
| Early mover advantage | Update | 22 May 2020 |
| Leveraging Asia’s rising star | Annual overview | 17 March 2021 |
| Asia’s emerging champion | Update | 14 December 2021 |
| A real growth story that remains intact | Annual overview | 15 December 2022 |
| Building on firmer foundations | Update | 20 June 2023 |
| Bringing you redemption | Annual overview | 15 December 2023 |
| Stellar performance with plenty of potential | Update | 12 June 2024 |
| Cheap stocks, bold reforms, big ambitions | Annual overview | 29 April 2025 |
Source: Marten & Co
IMPORTANT INFORMATION
Marten & Co (which is authorised and regulated by the Financial Conduct Authority) was paid to produce this note on Vietnam Holding Limited.
This note is for information purposes only and is not intended to encourage the reader to deal in the security or securities mentioned within it. Marten & Co is not authorised to give advice to retail clients. The research does not have regard to the specific investment objectives financial situation and needs of any specific person who may receive it.
The analysts who prepared this note are not constrained from dealing ahead of it but, in practice, and in accordance with our internal code of good conduct, will refrain from doing so for the period from which they first obtained the information necessary to prepare the note until one month after the note’s publication. Nevertheless, they may have an interest in any of the securities mentioned within this note.
This note has been compiled from publicly available information. This note is not directed at any person in any jurisdiction where (by reason of that person’s nationality, residence or otherwise) the publication or availability of this note is prohibited.
Accuracy of Content: Whilst Marten & Co uses reasonable efforts to obtain information from sources which we believe to be reliable and to ensure that the information in this note is up to date and accurate, we make no representation or warranty that the information contained in this note is accurate, reliable or complete. The information contained in this note is provided by Marten & Co for personal use and information purposes generally. You are solely liable for any use you may make of this information. The information is inherently subject to change without notice and may become outdated. You, therefore, should verify any information obtained from this note before you use it.
No Advice: Nothing contained in this note constitutes or should be construed to constitute investment, legal, tax or other advice.
No Representation or Warranty: No representation, warranty or guarantee of any kind, express or implied is given by Marten & Co in respect of any information contained on this note.
Exclusion of Liability: To the fullest extent allowed by law, Marten & Co shall not be liable for any direct or indirect losses, damages, costs or expenses incurred or suffered by you arising out or in connection with the access to, use of or reliance on any information contained on this note. In no circumstance shall Marten & Co and its employees have any liability for consequential or special damages.
Governing Law and Jurisdiction: These terms and conditions and all matters connected with them, are governed by the laws of England and Wales and shall be subject to the exclusive jurisdiction of the English courts. If you access this note from outside the UK, you are responsible for ensuring compliance with any local laws relating to access.
No information contained in this note shall form the basis of, or be relied upon in connection with, any offer or commitment whatsoever in any jurisdiction.
Investment Performance Information: Please remember that past performance is not necessarily a guide to the future and that the value of shares and the income from them can go down as well as up. Exchange rates may also cause the value of underlying overseas investments to go down as well as up. Marten & Co may write on companies that use gearing in a number of forms that can increase volatility and, in some cases, to a complete loss of an investment.