
20 years on, potential undiminished
Vietnam Holding (VNH) has just marked its 20th anniversary. Both VNH and Vietnam have made significant progress over the past two decades, with successes and some challenges along the way. Over the long term, VNH’s investment strategy has outperformed local benchmarks. Recently, however, its focus on quality growth and ESG has been less popular. While its companies continue to post strong results, supported by Vietnam’s robust economy, this is not yet reflected in their valuations.
Vietnam’s growth potential remains strong, with government targets that could drive major economic change. VNH’s portfolio is well positioned to benefit, and this should be recognised by investors, especially if foreign investment returns. Vietnam’s upcoming inclusion in the FTSE Russell index series may support this.
Capital growth from a concentrated portfolio of high growth Vietnamese companies
VNH aims to provide investors with long-term capital appreciation by investing in a portfolio of high-growth companies in Vietnam. These should come at an attractive valuation and demonstrate strong environmental, social, and corporate governance awareness.
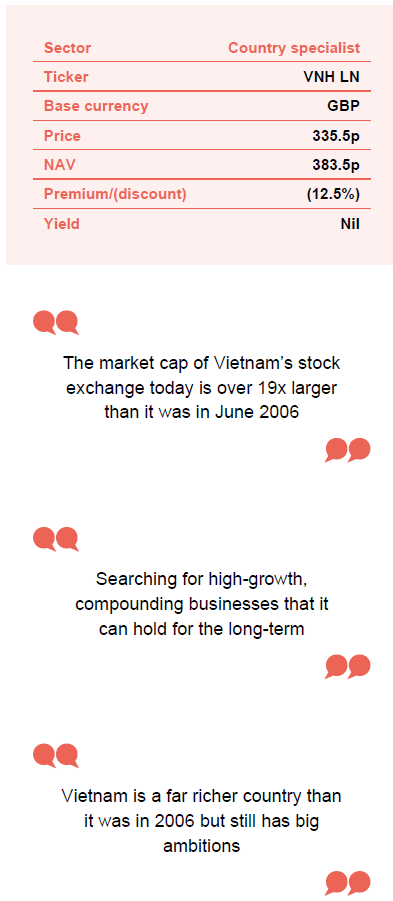
At a glance
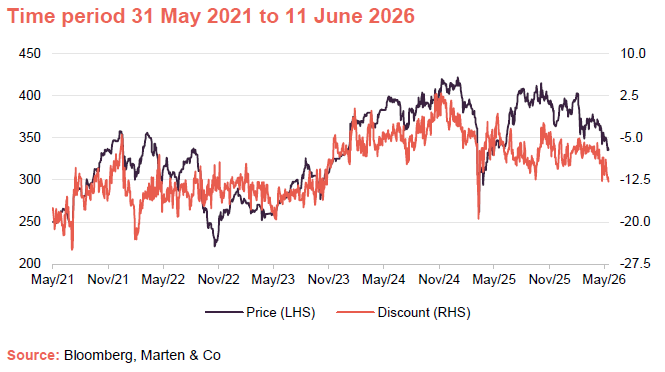
Share price and discount
Over the 12 months to the end of May 2026, VNH’s shares traded in a range of a 0.7% premium share price to net asset value (NAV) and a 12.7% discount to NAV. The average was a 7.4% discount. As at 11 June 2026, VNH was trading on a discount of 12.5%
VNH’s board is keen to keep the discount tight, with the ultimate aim of re-expanding the company.
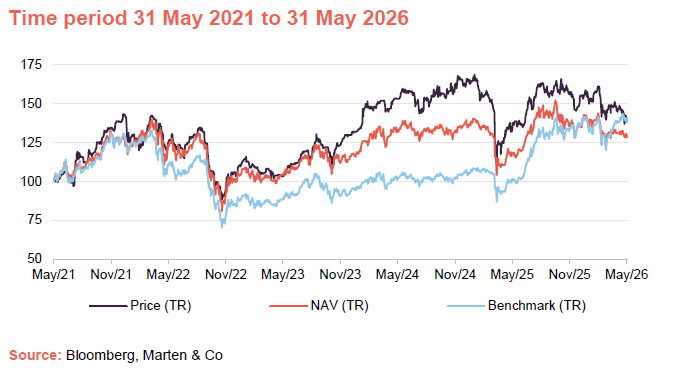
Performance over five years
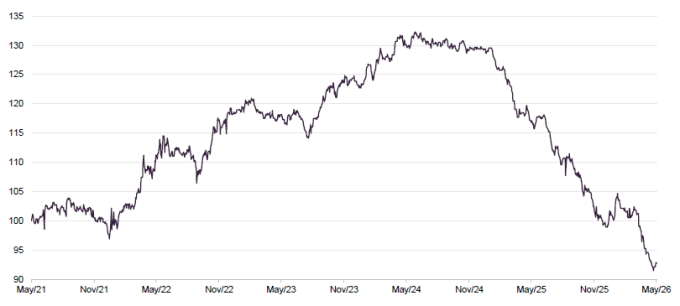
VNH’s strong run of relative outperformance of its benchmark faltered early in 2025 and VNH has given up all of this since. Foreign investors have been pulling money out of the market. The local retail investors who now dominate trading are less focused on corporate governance concerns and more prone to momentum investing. This is not an environment that suits VNH’s investment approach. It says that on average its companies are still delivering the sales and profits uplifts that the manager is anticipating but this is not reflected in their valuations.
| Year ended | Share price total return (%) | NAV total return (%) | Vietnam All-Sharetotal return (%) | MSCI Emerging Marketstotal return (%) |
|---|---|---|---|---|
| 31/05/2022 | 26.4 | 22.7 | 10.9 | (8.5) |
| 31/05/2023 | (18.2) | (14.2) | (19.5) | (6.4) |
| 31/05/2024 | 48.2 | 25.8 | 14.2 | 9.7 |
| 31/05/2025 | (10.2) | (11.0) | (1.3) | 7.4 |
| 31/05/2026 | 1.2 | 9.1 | 37.7 | 55.0 |
Fund profile – listed Vietnamese equities with strong ESG focus
Further information on VNH can be found at the company’s website: www.vietnamholding.com
VNH is a closed-end fund based in Guernsey, aiming for long-term capital growth by investing in a focused portfolio of high-growth Vietnamese companies with strong ESG standards. While it mainly invests in publicly traded Vietnamese firms, it can also invest up to 25% of its assets in foreign companies with most of their operations in Vietnam, and up to 20% in private companies. The fund may also hold equity-like securities such as convertible bonds.
VNH does not use a formal benchmark, but performance is often compared to the VN All-Share and MSCI Emerging Markets Index. The portfolio is managed by Dynam Capital, which seeks high-growth businesses with attractive valuations for long-term holding. Dynam uses both top-down and bottom-up strategies: top-down to identify key sectors, and bottom-up to select the best companies through detailed research.
Dynam Capital is searching for high-growth, compounding businesses that it can hold for the long-term.
Dynam Capital (dynamcapital.com) is looking for high-growth, compounding businesses that it can hold for the long term. This can be summarised as growth at an attractive valuation.
ESG incorporated into all investment and monitoring procedures
ESG analysis is at the core of Dynam’s approach and has been integral from the start. Vu Quang Thinh, Dynam’s CIO, is highly respected in this field. He helped found and previously chaired the Vietnam Institute of Directors (VIOD), which was set up in April 2018 as Vietnam’s first private, independent body to promote top standards in corporate governance. Further details on VNH’s investment approach can be found in our April 2025 note.Further details on VNH’s investment approach can be found in our April 2025 note.
A 20-year growth story…
VNH launched in April 2006, joined AIM in June 2006, and moved to the main market in March 2019. A £1,000 investment at launch would have grown to £3,140 by the end of May 2026.
Figure 1: Total return in sterling of VNH (NAV terms) and local indices since VNH’s launch
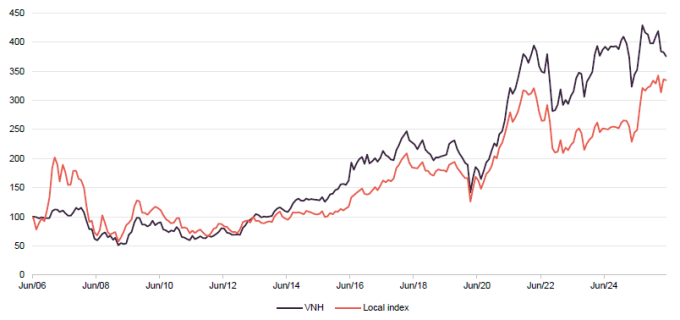
The market cap of Vietnam’s stock exchange today is over 19x larger than it was in June 2006
Back in 2006, Vietnam’s economy was growing at about 7.5% a year, and the manager anticipated the country joining the World Trade Organization (WTO). The fund initially focused on former State-Owned Enterprises (SOEs), following a government plan to list 178 SOEs on the Vietnam Stock Exchange.
At the time, Ms Min Hwa Hu Kupfer, VNH’s first chair, said: “This is a historically important period for Vietnam, as the country prepares its accession to the WTO. The announced wave of privatizations is expected to provide attractive investment opportunities for the global investment community. VNH is excited about being able to contribute to Vietnam’s economic growth through its strategic investments.”
Vietnam’s market grew quickly. Market capitalisation rose from $2.8bn in June 2006 to $16.9bn by June 2007, and reached about $347.5bn by April 2026. FTSE Russell has now upgraded Vietnam to emerging market status, and there is hope MSCI will do the same.
…with a long way to run
Vietnam is a far richer country than it was in 2006 but still has big ambitions
Over the past 20 years, Vietnam has become much wealthier, mainly due to strong growth in manufactured exports. However, its GDP per capita still trails well behind China. The government aims to close this gap, targeting 10% annual GDP growth from 2026 to 2030, with a goal of reaching $8,500 GDP per capita by 2030.
The World Bank is less optimistic, forecasting 6.8% growth for 2026 and 7.1% for 2027, having lowered its estimates in May 2026 to reflect potential impacts from the Iran war.
Vietnam benefits from favourable demographics, with a stable proportion of under-15s, unlike China’s ageing population. Education standards are high, and there are plans for students to be bilingual in Vietnamese and English. Urbanisation continues, but with 60% of the population still in rural areas, there is further room for growth. While Vietnam is much richer than in 2006, it still has ambitious goals.
Figure 2: GDP per capita in US dollars
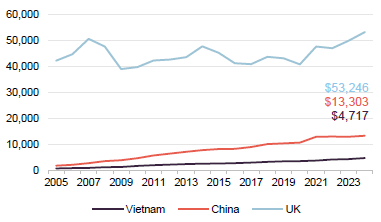
Figure 3: Real GDP growth rate (%)
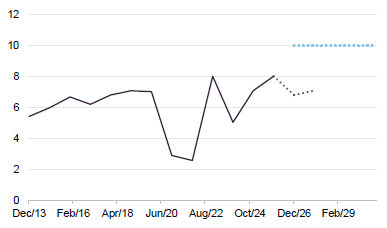
Figure 4: Population
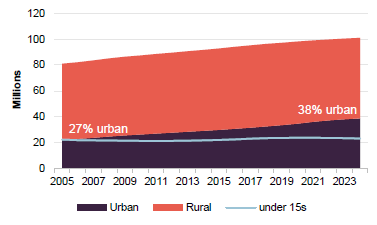
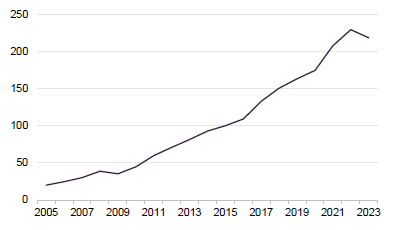
Figure 5: Index of value of exports (2015 = 100)
Economic growth remained strong in 2025, with Q1 GDP up 7.8%, despite last year’s US tariff announcements. US exports to Vietnam reached $15.7bn (up 20%), while imports were $193.8bn (up 42%), widening the US trade deficit by 44.3%.
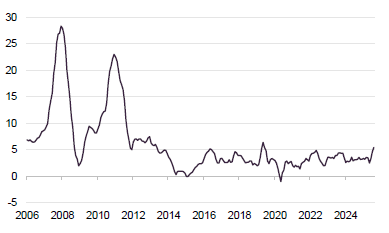
Vietnam’s exports have shifted from commodities to higher-value goods, partly as manufacturers move from China to avoid US trade controls. The weakening Dong has made exports more competitive. Inflation is better managed than in the past but is still above the State Bank’s 4.5% target.
Figure 6: US dollar / Vietnamese Dong exchange rate
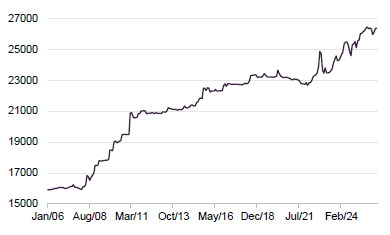
Figure 7: Inflation rate (%)
Significant infrastructure investment underway
Vietnam’s government debt is about 33% of GDP (according to Moody’s) and the budget deficit for 2026 is forecast at about 4.2% of GDP. The government is pushing ahead with its $129bn infrastructure investment plan, which we discussed in our last note, alongside government resolutions 68 and 79, which are designed to support the growth of private businesses.
New government pushing to accelerate growth of digital economy
In April 2026, Le Minh Hung became Prime Minister, and with Tô Lâm as President, both are seen as business-friendly leaders. In May, Le Minh Hung issued a decree prioritising 70 technologies and over 100 high-tech products for investment, following a digital technology plan targeting $300bn in revenue by 2030.
A key enabler is “Project 6,” a government digitisation programme running until 2030. By year-end, all citizens will have a biometric digital ID under the VNeID scheme, supporting rapid growth in areas like e-payments.
Bold plans and long-term vision, including major infrastructure projects, have shaped Vietnam’s economy over the past 20 years. The country has faced challenges such as real estate cycles and the $44bn Saigon Commercial Bank (SCB) fraud, but the government has taken strong action against corruption, initially handing out death sentences in the SCB case.
Figure 8: Number of mobiles and fixed broadband connections per 100 people
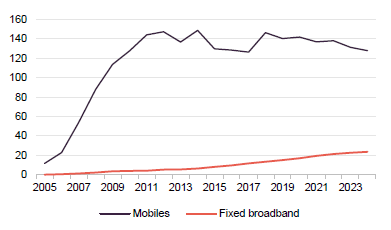
Figure 9: International tourist arrivals
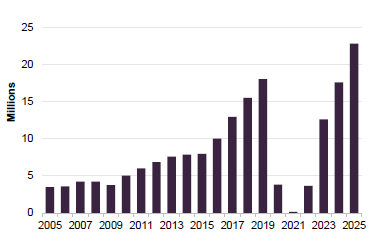
A surge in tourist arrivals over 2025 was good news. This sector is an increasingly important contributor to GDP.
Figure 10: Vietnam energy generation by type
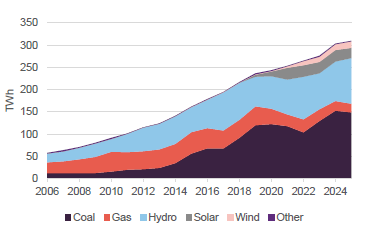
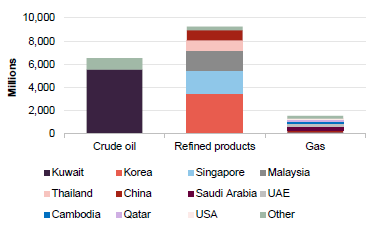
Figure 11: Oil & gas imports by value (in millions of dollars)
Iran war could have an impact
One risk ahead is the potential impact of the Iran war on energy costs. The government’s focus on renewable energy should help soften this effect. Although the data in Figure 11 is a bit dated, it highlights the risk of depending on Kuwait for crude oil, which may need to be sourced from other suppliers. The impact on Asian refineries that supply products to the country is still unclear.
This all suggests heightened inflationary pressures, but Vietnam will not be alone in this, which could have a secondary effect on global demand for Vietnamese exports. Higher air fares might have an effect on tourism.
Valuations of Vietnamese stocks are depressed
Valuations of Vietnamese stocks are already low compared to international peers. Foreign investors have been pulling money out, now holding only 14.5% of the market, while retail investors – over 12 million – now dominate trading. This shift has led to market distortions, such as the high valuation of Vingroup, which VNH continues to avoid due to concerns about governance and valuations.
Figure 12: Valuation data
| Historic P/E (x) | Current P/E (x) | Forecast P/E (x) | |
|---|---|---|---|
| Vietnam Ho Chi Minh VN All-Share (VNAS) | 12.3 | 10.8 | 8.9 |
| Vietnam Ho Chi Minh Stock Index (VNI) | 15.0 | 12.5 | 10.7 |
| MSCI Vietnam | 19.3 | 15.5 | 13.2 |
| MSCI Emerging Markets | 18.8 | 13.3 | 11.0 |
| MSCI ACWI | 22.7 | 19.3 | 16.9 |
One thing that is evident in Figure 12 is the wide range of valuations for different Vietnamese indices. In our last note, we noted how sharp price changes in the Vingroup conglomerate have distorted these indices. The different index valuations mainly reflect how much weight they give to these companies. VNH has less exposure to the conglomerate, which has limited its returns compared to other indices in recent months.
Asset allocation
As of 30 April 2026, VNH’s portfolio held 25 securities, unchanged since 31 December 2025. These holdings were valued at an average of 10.1 times expected earnings, with the potential for 18.6% earnings growth. The top 10 holdings made up 63.2% of the portfolio.
Figure 13: VNH portfolio sectoral allocation as at 30 April 2026
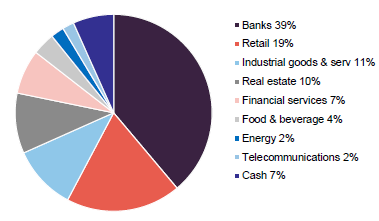
Figure 14: VNH change in portfolio sectoral allocation since 31 December 2025
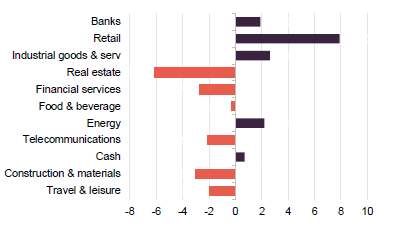
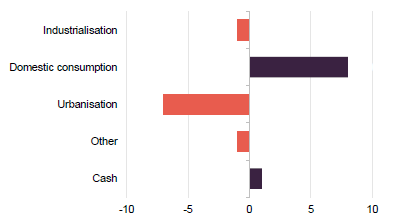
Since December 2025, there has been a shift from real estate to retail, and from urbanisation to domestic consumption. This partly reflects the manager taking profits after Vinhomes’s share price rose, and a positive outlook for the domestic economy. Retail sales increased by 12.1% year-on-year in April and 11.1% for the first four months of 2026.
Figure 15: VNH portfolio by theme as at 30 April 2026
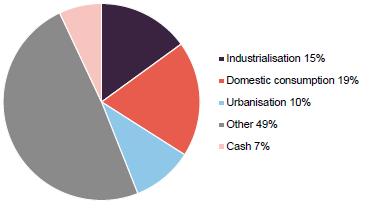
Figure 16: VNH change to split of portfolio by theme since 31 December 2025
Top 10 holdings
Since we last published using data at the end of December 2025, SSI Securities and FPT have fallen out of the top 10, to be replaced by longstanding holding Phu Nhuan Jewelry and the conglomerate Masan Group.
Figure 17: Top 10 holdings as at 30 April 2026
| Stock | Sector | Portfolio weight 30 Apr 2026 (%) | Portfolio weight 31 Dec 2025 (%) | Change(%) |
|---|---|---|---|---|
| Mobile World | Retail | 10.0 | 10.0 | – |
| Hoa Phat Group | Industrials | 9.5 | 7.4 | 2.1 |
| MB Bank | Banks | 9.2 | 8.5 | 0.7 |
| VPBank | Banks | 6.8 | 6.4 | 0.4 |
| Techcombank | Banks | 6.7 | 6.4 | 0.3 |
| VietinBank | Banks | 5.5 | 5.4 | 0.1 |
| Vinhomes | Real estate | 4.7 | 6.1 | (1.4) |
| Asia Commercial Bank | Banks | 3.7 | 5.4 | (1.7) |
| Masan | Conglomerate | 3.7 | n/a | n/a |
| Phu Nhuan Jewelry | Retail | 3.4 | n/a | n/a |
| Total of top 10 | 63.2 | 63.7 |
Masan Group
Figure 18: Masan Group share price (VND)
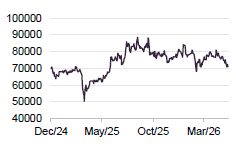
Masan Group (masangroup.com) is a conglomerate that was incorporated in 2004 as Ma San Shipping and now encompasses a number of companies in retail, branded FMCG, food, and beverages (including chilled meat and tea & coffee), financial services, and high-tech materials.
Masan holds a stake in Techcombank, another VNH top 10 holding, with its share of Techcombank’s profits rising 11.8% year-on-year in Q1 2026. Its WinCommerce chain runs over 4,800 supermarkets and minimarts, adding 225 new stores in Q1 2026. Masan Consumer Holdings, one of Vietnam’s largest FMCG companies, is aiming for 11%-15% revenue growth in 2026. Masan MEATDeli, its chilled and processed meat business, saw revenue up 19.8% year-on-year in Q1 2026. Phuc Long Heritage operates 205 tea and coffee shops and plans to open 40-50 more this year. Masan High-Tech Materials is a major producer of fluorspar and bismuth and owns the world’s largest tunpports plans to build a fully integrated tungsten business.
Performance
VNH reports its NAV in US dollars, but we have converted its returns into sterling for the figures shown in Figure 19.
Figure 19: Cumulative total return performance over periods ending 31 May 2026
| 3 months(%) | 6 months (%) | 1 year (%) | 3 years(%) | 5 years(%) | |
|---|---|---|---|---|---|
| VNH share price | (13.6) | (11.0) | 1.2 | 34.6 | 39.2 |
| VNH NAV | (10.3) | (5.5) | 9.1 | 22.1 | 28.5 |
| VN All-Share | (1.8) | 3.5 | 37.7 | 55.3 | 38.6 |
| MSCI Emerging Markets | 9.4 | 27.3 | 55.0 | 82.7 | 56.5 |
VNH’s strong performance faded in early 2025, with all gains since lost. While net foreign direct investment remains solid, foreign investors have withdrawn funds, partly due to new tariffs announced in April 2025 and concerns about the Iran war. Retail investors, focused more on momentum than governance, have also influenced the market. This environment does not favour VNH’s investment style. Although VNH’s companies continue to deliver expected sales and profit growth, this is not yet reflected in their share prices.
Figure 20: VNH’s NAV performance relative to the VN All-Share over five years to 31 May 2026
Premium/(discount)
Over the 12 months to May 2026, VNH traded at a discount between 0.7% and 12.7%, averaging 7.4%. On 11 June 2026, the discount was 12.5%.
VNH’s board aims to keep the discount narrow and eventually grow the company by issuing shares at a premium when investor interest in Vietnam returns. The company managed to issue a small number of shares in January 2025.
Alongside regular share buybacks, VNH also runs an annual redemption facility. Announced in late 2023 and first used in September 2024, this facility saw about 12% of shares redeemed and has helped keep the discount tight. Shareholders must hold their shares for at least six months before redeeming, which discourages short-term trading.
In the 2025 redemption, investors holding around 4.2 million shares, or about 17.9% of VNH’s shares, chose to redeem.
Figure 21: VNH premium/(discount) over five years
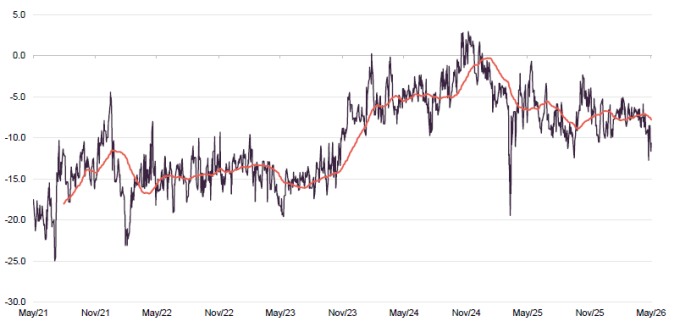
Figure 22: SWOT analysis for VNH
| Strengths | Weaknesses |
|---|---|
| Great long-term track record of NAV and share price growth | Lack of exposure to Vingroup and other momentum-driven retail favourites has damaged track record in the short term |
| Tough on discount control, including provision of annual redemption facility | Annual redemption opportunity creates risk that the company may no longer be viable, especially if it coincides with a period of market instability |
| Small enough to be nimble in what can still be an illiquid market | Small size pushes up expense ratio and reduces liquidity in VNH’s shares |
| Opportunities | Threats |
| Vietnamese market and stocks in VNH’s portfolio are cheap, especially considering their growth potential | Economic disruption from the Iran war could worsen and weigh on Vietnam’s exports with knock-on effects on the domestic economy |
| When foreign investor confidence returns, VNH is positioned to re-expand | |
| Vingroup’s bubble might burst to the benefit of VNH’s relative performance |
Figure 23: Bull versus bear case for VNH
| Aspect | Bull case | Bear case |
|---|---|---|
| Performance | Good long-term | One-year relative performance has been poor |
| Dividends | N/A | N/A |
| Outlook | Vietnam’s government has its foot on the economy’s accelerator, which should feed through into positive share price performance | Macroeconomic events could hold back Vietnam’s growth ambitions |
| Discount | Strong discount control has been achieved through shrinking the trust, but renewed appetite for the shares could see it trading at a premium and issuing stock | Continued shrinkage makes VNH’s shares less liquid, which could exacerbate discount problem |
Previous publications
For more details on VNH, including its investment process, fees, capital structure, life, and board, see our note – Cheap stocks, bold reforms, big ambitions – published on 29 April 2025. You can read the notes by clicking on them in Figure 24 or by visiting our website.
Figure 24: QuotedData’s previously published notes on VNH
IMPORTANT INFORMATION
Marten & Co (which is authorised and regulated by the Financial Conduct Authority) was paid to produce this note on Vietnam Holding Limited.
This note is for information purposes only and is not intended to encourage the reader to deal in the security or securities mentioned within it.
Marten & Co is not authorised to give advice to retail clients. The research does not have
regard to the specific investment objectives financial situation and needs of any specific person who may receive it.
The analysts who prepared this note are not constrained from dealing ahead of it but, in practice, and in accordance with our internal code of good conduct, will refrain from doing so for the period from which they first obtained the information necessary to prepare the note until one month after the note’s publication. Nevertheless, they may have an interest in any of the securities mentioned within this note.
This note has been compiled from publicly available information. This note is not directed at any person in any jurisdiction where (by reason of that person’s nationality, residence or otherwise) the publication or availability of this note is prohibited.
Accuracy of Content: Whilst Marten & Co uses reasonable efforts to obtain information from sources which we believe to be reliable and to ensure that the information in this note is up to date and accurate, we make no representation or warranty that the information contained in this note is accurate, reliable or complete. The information contained in this note is provided by Marten & Co for personal use and information purposes generally. You are solely liable for any use you may make of this information. The information is inherently subject to change without notice and may become outdated. You, therefore, should verify any information obtained from this note before you use it.
No Advice: Nothing contained in this note constitutes or should be construed to constitute investment, legal, tax or other advice.
No Representation or Warranty: No representation, warranty or guarantee of any kind, express or implied is given by Marten & Co in respect of any information contained on this note.
Exclusion of Liability: To the fullest extent allowed by law, Marten & Co shall not be liable for any direct or indirect losses, damages, costs or expenses incurred or suffered by you arising out or in connection with the access to, use of or reliance on any information contained on this note. In no circumstance shall Marten & Co and its employees have any liability for consequential or special damages.
Governing Law and Jurisdiction: These terms and conditions and all matters connected with them, are governed by the laws of England and Wales and shall be subject to the exclusive jurisdiction of the English courts. If you access this note from outside the UK, you are responsible for ensuring compliance with any local laws relating to access.
No information contained in this note shall form the basis of, or be relied upon in connection with, any offer or commitment whatsoever in any jurisdiction.
Investment Performance Information: Please remember that past performance is not necessarily a guide to the future and that the value of shares and the income from them can go down as well as up. Exchange rates may also cause the value of underlying overseas investments to go down as well as up. Marten & Co may write on companies that use gearing in a number of forms that can increase volatility and, in some cases, to a complete loss of an investment.