Review 2024
Annual roundup | Investment companies | January 2024
Kindly sponsored by abrdn
Hold your nerve
After the battering that it took in 2024, it would be easy to be despondent about the health of the UK investment companies market. On page 17 we show a list of 30 investment companies that left the sector over 2024, at least as many are actively selling off assets for a managed wind down or have already committed to deals that will see them exit. Then, at the end of the year, seven trusts were targeted by a US vulture investor. Vast amounts of stock were bought back, yet average discounts did not budge. The IPO market is non-existent, and the last budget did serious harm to sentiment towards the UK stock market while providing none of the hoped-for measures to stem its decline. This has been topped off by the calamitous handling of the misleading cost disclosure problem, which allowed platforms to make up the rules as they went along.
However, on the plus side, despite the continued domination of the magnificent seven AI-related stocks within global indices, most sectors and over 70% of investment companies made money for investors in 2024. In addition to the standout winners listed on page 12, there are big, solid, trusts such as F&C, Temple Bar, and JPMorgan Global Growth and Income, that are beating benchmarks, and trusts that had been disappointing but are turning around their performance, such as Scottish Mortgage and Monks.
The cost disclosure issue and a lack of attention, so far, from activist investors, means that the alternative income sectors also offer some real bargains – very wide discounts and double-digit yields. Surely that situation cannot persist.
At QuotedData, we:
- Commenced coverage of some exciting new clients including Caledonia, Impax Environmental, and Seraphim Space;
- Launched our Investors’ Choice Awards;
- We became a regular contributor to the Questor column in the Telegraph; and
- Expanded the range of private investor shows that we work with.
At a glance
All investment companies median discount
Discounts continued to widen from already wide levels and hit a low point in April. The tightest discounts were seen in August, but from then on, ratings slipped again, finishing the year wider than they had started.
Figure 1: 1 January 2024 to 31 December 2024
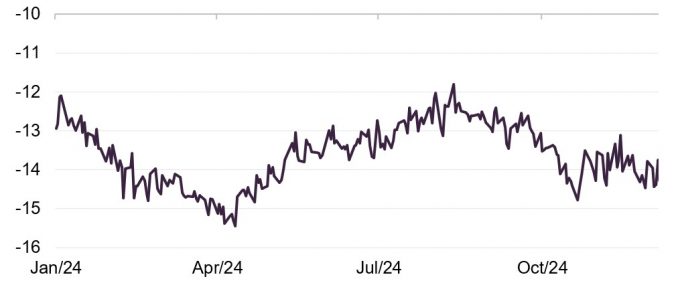
Source: Morningstar, QuotedData
MSCI indices in sterling, rebased to 100
US equities continued to dominate, but within that, the US index was heavily influenced by the returns of mega cap, AI-related stocks. Worst-performing in sterling terms was MSCI Europe ex UK, which ended the year slightly lower than it started. The UK market remained in the doldrums. The year also saw rising bond yields and a record gold price.
Figure 2: 1 January 2024 to 31 December 2024
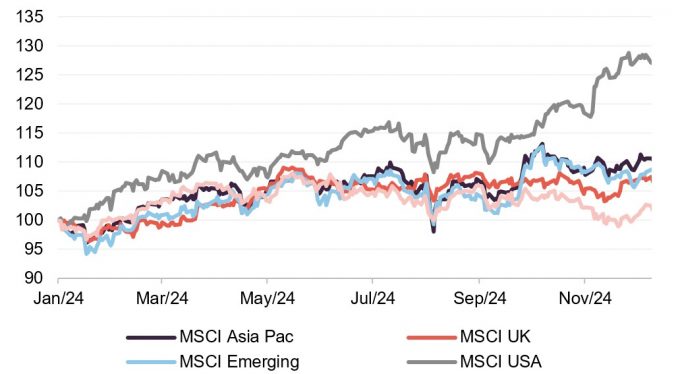
Source: Morningstar, QuotedData
Figure 3: Currency, commodity, and bond movements over 2024
| 31/12/2024 | 31/12/2023 | Change y-o-y (%) | |
|---|---|---|---|
| GBP / USD | 1.2516 | 1.2731 | (1.7) |
| USD / EUR | 1.2085 | 1.1535 | 4.8 |
| USD / JPY | 157.20 | 141.04 | 11.5 |
| USD / CHF | 0.9074 | 0.8414 | 7.8 |
| USD / CNY | 7.2993 | 7.1000 | 2.8 |
| Oil (Brent) | 74.64 | 77.04 | (3.1) |
| Gold | 2624.50 | 2062.98 | 27.2 |
| US Treasuries 10-year yield | 4.57 | 3.88 | 17.8 |
| UK Gilts 10-year yield | 4.57 | 3.54 | 29.1 |
| German government bonds (Bunds) 10-year yield | 2.36 | 2.02 | 17.0 |
Investment company notes published in 2024
Figure 4: Notes published in 2024
| Polar Capital Technology – The AI’s have it | Urban Logistics REIT – Full year results analysis |
| Urban Logistics REIT – A re-rating candidate | Herald Investment Trust – Heralding in the age of AI |
| JPMorgan Japanese Investment Trust – Are we there yet? | Polar Capital Technology – AI caramba! |
| Ecofin Global Utilities and Infrastructure Trust – Strong outlook as macro gloom lifts | Caledonia Investments – Time, well invested |
| Gulf Investment Fund – In good hands | JLEN Environmental Assets – Vote against discontinuation |
| GCP Infrastructure – Don’t look back in anger | AVI Japan Opportunity – Pushing on an opening door |
| Chrysalis Investments – Turned a corner | GCP Infrastructure – Crystallising unrealised value |
| Edinburgh Worldwide – “The opportunity is as exciting as ever” | Baillie Gifford UK Growth Trust – Light at the end of the tunnel |
| Tritax EuroBox – Calmer waters | Seraphim Space Investment Trust – Science fiction becoming science fact |
| AVI Japan Opportunity – The sun has risen | Rights and Issues Investment Trust – Lights and tunnels |
| Polar Capital Global Healthcare – Healthy returns and a rosy outlook | Montanaro European Smaller Companies – Primed for ignition |
| Pantheon Infrastructure – Compelling opportunity | Geiger Counter Limited – Dawn of a new era for uranium |
| NextEnergy Solar Fund – High- and growing-income opportunity | Henderson High Income – London’s finally calling |
| Aquila European Renewables – Powering through | Alliance Trust – A new powerhouse |
| Temple Bar – Foundations for success | Oakley Capital Investments – In a class of its own |
| Oakley Capital Investments – Getting down to business | Gulf Investment Fund – Please don’t go |
| abrdn Private Equity Opportunities – On the way to greener pastures | JPMorgan Japanese Investment Trust – Conviction drives returns |
| HydrogenOne Capital Growth – Momentum building despite discount | Temple Bar – Historic opportunity |
| Bluefield Solar Income Fund – Fundamentals shine despite discount | European Opportunities Trust – Geared to growth, built in resilience |
| CQS Natural Resources Growth and Income – Poised for the starting gun | Lar España Real Estate – Undervalued by offer |
| Grit Real Estate Income Group – Building on steadier ground | Bluefield Solar Income Fund – Compelling opportunity |
| Lar España Real Estate – 10-up and more growth to come | Seraphim Space Investment Trust – Entering orbit |
| Downing Renewables and Infrastructure Trust – Fundamental story to drive returns | Pantheon Infrastructure – Powering up |
| Impax Environmental Markets – Sustainable long-term growth | Polar Capital Global Healthcare – Vital signs are good |
| AVI Global Trust – Thriving under pressure | Foresight Environmental Infrastructure – Looking to bounce back |
| BlackRock Throgmorton Trust – get it while the price is good | Impax Environmental Markets – Delayed but not derailed |
| Vietnam Holding Limited – Stellar performance with plenty of potential | AVI Global Trust – Building on solid foundations |
| Ecofin Global Utilities and Infrastructure Trust – Momentum building | Caledonia Investments – Addressing the discount |
| Polar Capital Global Financials Trust – Handful of themes to drive performance | HydrogenOne Capital Growth – Cordiant Capital to purchase investment adviser |
| Montanaro UK Smaller Companies – A coiled spring? | Polar Capital Global Financials – Taking advantage of a favourable landscape |
| RIT Capital Partners – Change in fortunes on the horizon | Ecofin Global Utilities and Infrastructure Trust – Virtues of diversification |
| CQS New City High Yield Fund – Riding the wave of shifting interest rates |
State of play at the end of 2024
Figure 5: Split of the investment company market by AIC sector, as at 31 December 2024
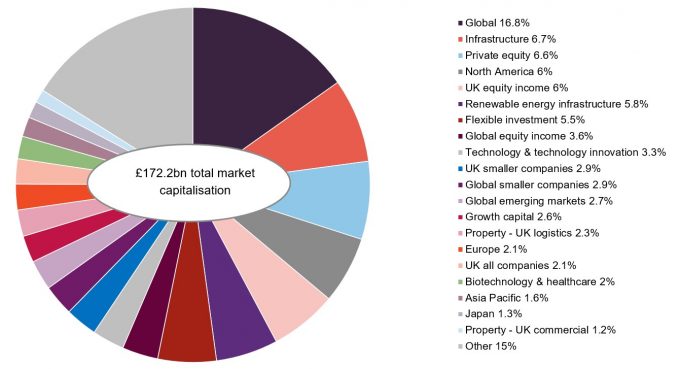
Source: Morningstar, QuotedData. Note: this does not include 3i.
The investment companies sector shrank from £178.9bn to £172.2bn over 2024 in market capitalisation terms, driven by market by widening discounts and the loss of several trusts. Figure 5 displays the relative composition of the industry by sector.
As we list on page 17, 30 funds were lost in 2024 and just one new fund entered the sector, Aberforth Geared Value and Income, which was a rollover vehicle for Aberforth Split Level Income.
Figure 6: Change in total market cap across selected sectors
| Market cap 31/12/2024 (£m) | Market cap 31/12/2023 (£m) | Change (£m) |
Change (%) |
|
|---|---|---|---|---|
| Global | 28,954 | 27,193 | 1,761 | 6.5 |
| Technology & technology innovation | 5,715 | 4,361 | 1,354 | 31.0 |
| Growth capital | 4,553 | 3,213 | 1,340 | 41.7 |
| Global equity income | 6,205 | 5,251 | 955 | 18.2 |
| North America | 10,462 | 9,529 | 933 | 9.8 |
| UK equity income | 10,356 | 10,936 | (580) | (5.3) |
| Biotechnology & healthcare | 3,508 | 4,093 | (585) | (14.3) |
| Debt – direct lending | 1,192 | 1,875 | (683) | (36.4) |
| Infrastructure | 11,593 | 12,700 | (1,107) | (8.7) |
| Renewable energy infrastructure | 10,057 | 13,701 | (3,644) | (26.6) |
Rising markets in the US helped global, US-focused, and technology sectors to increase in value. Narrowing discounts were the main reason for the increase in the market cap of the growth capital sector.
Buybacks shrank the UK equity income sector. Flat NAVs and widening discounts weighed on the biotech and healthcare sector. Many of the constituents of the debt – direct lending sector are in wind-up. Discounts continue to widen on infrastructure and renewable energy trusts.
Performance data
Magnificent Seven still dominate indices
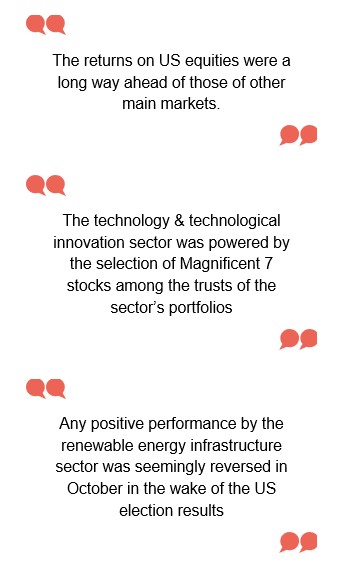
The returns on US equities were a long way ahead of those of other main markets. However, it is worth highlighting that, without the ‘Magnificent Seven’, the US indices growth would have been considerably lower. In fact, without the group of tech giants the S&P 500 would have returned just 6.3% in US dollar price terms over 2024 versus 23.3% if they are included. They make up around one third of that index’s market cap, but it is also worth pointing out that they accounted for over 75% of the S&P 500’s earnings growth across the year. Despite concerns in July that AI could be in a bubble, these stocks weathered occasional volatility and were fuelled by high investor confidence in AI investment. This will explain the expansion of momentum and growth indices too, which also reflect the strength of other large caps.
Figure 7: MSCI indices in sterling by region
Figure 8: MSCI indices in sterling by style
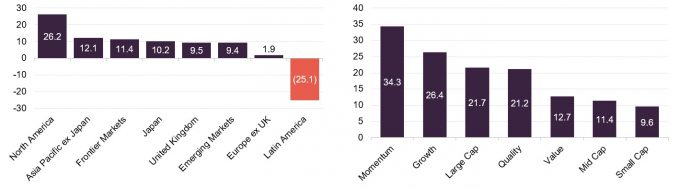
Source: Morningstar, QuotedData
Source: Morningstar, QuotedData
Signified by its first trade surplus in over fourteen years, Argentina led the country growth indices list, as its new president Javier Milei’s aggressive austerity measures created a sharp drop in inflation and added to investor optimism. Conversely, the largest economy in South America, Brazil, suffered market woes brought on by significant depreciation of the country’s currency and the underperformance of major stocks, trailing behind emerging markets indices by some distance. Similar to Argentina’s indices, Pakistani economic reforms allowed for growth in particular sectors such as in energy, whilst Pakistan’s share of frontier indices was increased, prompting improved outsider investor interest.
The topical growth of AI investment contributed to indices growth in Taiwan, which continued to dominate the semiconductor industry. At the forefront of this sector is the Taiwan Semiconductor Manufacturing Company (TSMC), which not only saw its revenue growth exceed expectations, but the company also built on its staggering
Figure 9: Performance of a selection of MSCI indices over 2024 in GBP terms
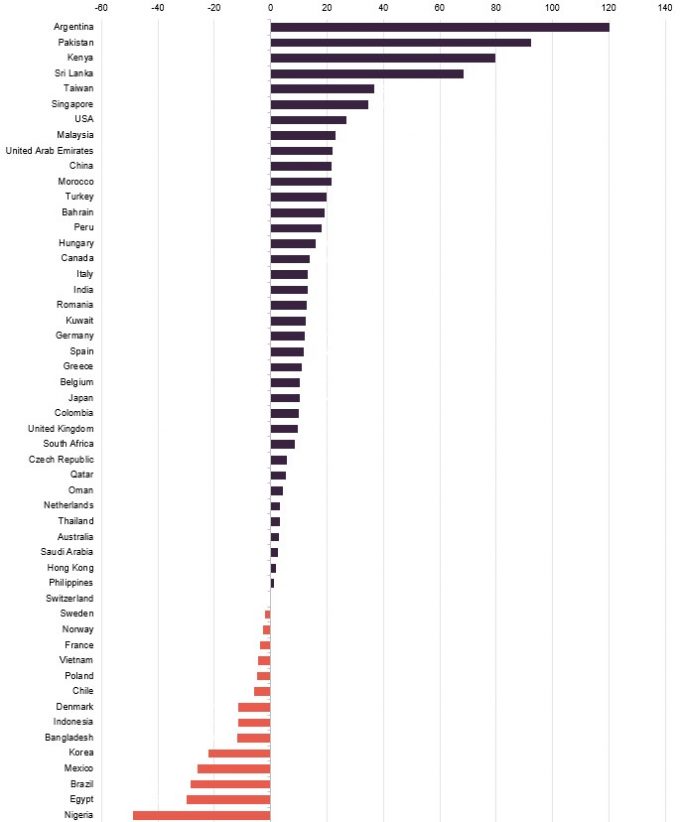
Source: Morningstar, QuotedData
64% market share of the global foundry market. Across the South China Sea, Singapore experienced its best stock market growth in over ten years, with the main Singapore Straits Times Index closing the year on a seventeen year high. Steering the increases were the country’s banks, supported by the effect of US rate cuts.
In the case of China, a continued property crisis, marked at the beginning of the year by the liquidation of the developer giant Evergrande, had a significant negative effect on the country’s economy. Even though government stimuli saw Chinese focused funds outperform many other sectors in certain months, other factors like worries over trade conflicts with the US weakened consumer demand. This would be a drag for Asian Pacific indices, yet other markets such as Japan countered weakened economies. The benchmark Nikkei 225 ended 2024 with a 19% annual rise, an all-time high. This came in spite of a crisis-like-crash in August, brought on by a surging yen and reactions to US interest rate expectations. A surprise call for a election by Prime Minister Shigeru Ishiba created another less serious wobble in Q4, but consumer behaviour is adapting to rising prices and corporate governance reforms were effective.
The UK sits around the middle of the table. Here the election result was well received, but the subsequent budget knocked confidence in the market.
Performance by sector and fund
Positives
Topping Figure 10, the growth capital sector was upheld by individual gains by trusts like Petershill Partners, which holds stakes in a range of asset management companies and which profited from its sale of its stake in Accel-KKR, in particular.
Similarly, Chrysalis investments, which had share price increases following the sale of its stake in Featurespace to Visa.
The technology & technological innovation sector was powered by the selection of Magnificent 7 stocks among the trusts of the sector’s portfolios. As discussed, these stocks demonstrated impressive gains, with Allianz Technology having exposure to six out of the seven companies, in addition to the Taiwanese manufacturing industry which rallied across the year.
Aircraft leasing companies experienced a strong recovery, as those with exposure to Airbus A380s rallied following the sale of Doric Nimrod Air Two’s remaining planes to Emirates. In addition, the problems in the Red Sea increased chart rates for the shipping leasing companies.
The debt – structured finance sector was boosted by news of the impending demise of BlackRock Loan Financing. Its wind down process was accelerated when it agreed to sell 100% of its Profit Participating Notes (PPNs), speeding up the fund’s liquidation process, but some investors were unhappy about the price achieved. However, it was persistent high interest rates without any serious accompanying problem with defaults that buoyed the wider sector.
North American focused funds enjoyed the rallies of the US’ large caps, with some including the already mentioned Magnificent 7. The best performer of the sector was Baillie Gifford US Growth, which is also a beneficiary of the soaring value of SpaceX.
For funds exposed to India, the election win of Narendra Modi’s BJP party stabilised the political issues that had been hampering the region’s equity markets. This seemed to reverse previous negative performance and even produced a rally in the wider Asia Pacific and Asia Pacific equity income sectors. Interestingly, large cap trusts beat the small cap ones in this market.
Despite the aforementioned Japanese stock volatility over the summer, Japanese smaller companies were somewhat shielded by their lower exposure to exporters and the yen carry trade. However, AVI Japan Opportunity stood out on the back of its success with its attempts to improve corporate governance within its portfolio.
Unfortunately, the environmental sector earns its place in the table as a result of the decisions by Menhaden Resource Efficiency and Jupiter Green to wind up.
Figure 10: Best and worst performers by sector in total price return terms over 2024
| Sector | Sector median total price return % |
Best performing trust in named sector |
Total price return % |
Worst performing trust in named sector |
Total price return % |
|---|---|---|---|---|---|
| Growth capital | 39.0 | Petershill Partners | 68.9 | Jade Road Investments | (89.9) |
| Technology & technology innovation | 36.2 | Allianz Technology | 38.1 | Polar Capital Technology | 34.3 |
| Leasing | 32.3 | Amedeo Air Four Plus | 60.0 | DP Aircraft 1 | (2.3) |
| Debt – structured finance | 31.2 | Blackstone Loan Financing | 41.5 | Twenty Four Income | 12.9 |
| North America | 18.3 | Baillie Gifford US Growth | 56.0 | Pershing Square Holdings | 5.8 |
| Insurance & reinsurance strategies | 17.6 | Life Settlement Assets | 17.6 | n/a | |
| India/Indian subcontinent | 17.5 | abrdn New India | 23.6 | India Capital Growth | 11.3 |
| Japanese smaller companies | 16.8 | AVI Japan Opportunity | 21.6 | Baillie Gifford Shin Nippon | (14.2) |
| Environmental | 16.4 | Menhaden Resource Efficiency | 52.2 | Impax Environmental Markets | (2.6) |
| Debt – loans & bonds | 15.5 | NB Distressed Debt Extended Life | 37.3 | NB Distressed Debt | (8.0) |
| Global emerging markets | 15.4 | JPMorgan Emerging Europe, Middle East & Africa | 48.3 | Utilico Emerging Markets | (3.1) |
| Asia Pacific equity income | 15.3 | Henderson Far East Income | 19.2 | abrdn Asian Income | 12.0 |
| Global | 14.7 | Manchester & London | 35.7 | Lindsell Train | (1.2) |
| Financials & financial innovation | 13.9 | Polar Capital Global Financials | 31.8 | Augmentum Fintech | (4.0) |
| North American smaller companies | 13.5 | JPMorgan US Smaller Companies | 18.7 | Brown Advisory US Smaller Co.s | 8.3 |
| Asia Pacific smaller companies | 13.1 | Scottish Oriental Smaller Co.s | 14.0 | Fidelity Asian Values | 0.9 |
| Hedge funds | 12.6 | Alternative Liquidity Fund | 36.7 | Gabelli Merger Plus+ | 1.9 |
| Global smaller companies | 12.2 | Herald | 26.4 | North Atlantic Smaller Companies | (3.1) |
| Asia Pacific | 11.9 | Asia Dragon | 22.0 | Pacific Assets | (2.9) |
| UK all companies | 11.1 | Henderson Opportunities | 20.6 | Aurora UK Alpha | (5.7) |
| UK equity & bond income | 10.8 | Henderson High Income | 10.8 | n/a | |
| UK equity income | 10.6 | Temple Bar | 19.1 | Murray Income | (1.2) |
| Global equity income | 9.7 | British & American | 41.7 | Scottish American | (4.1) |
| China / greater China | 8.6 | Baillie Gifford China | 13.7 | JPMorgan China Growth and Income | 6.5 |
| Japan | 8.4 | JPMorgan Japanese | 16.2 | Fidelity Japan | (5.7) |
| Debt – direct lending | 8.1 | GCP Asset Backed Income | 26.1 | VPC Speciality Lending | (50.3) |
| Country specialist | 7.9 | VietNam Holding | 24.6 | Weiss Korea Opportunity | (17.0) |
| UK smaller companies | 6.7 | Crystal Amber | 42.2 | Invesco Perpetual UK Smaller | (7.1) |
| Flexible investment | 6.6 | Livermore Investments | 75.2 | Riverfort Global Opportunities | (43.0) |
| Property – debt | 6.4 | Alpha Real Trust | 73.3 | Acuity RM Group | (56.8) |
| European smaller companies | 6.2 | JPMorgan European Discovery | 8.3 | European Assets | (3.5) |
| Property – UK commercial | 5.6 | abrdn Property Income | 33.7 | Regional REIT | (62.4) |
| Commodities & natural resources | 3.2 | GRIT Investment Trust | 47.1 | Geiger Counter | (16.2) |
| Private equity | 2.8 | HgCapital Trust | 25.7 | LMS Capital | (28.0) |
| Property – UK residential | 1.3 | PRS REIT | 30.8 | Ground Rents Income | (28.8) |
| Property – UK healthcare | 1.1 | Target Healthcare REIT | 4.3 | Care REIT | (2.1) |
| Infrastructure | 0.4 | Cordiant Digital Infrastructure | 24.0 | Digital 9 Infrastructure | (36.5) |
| Property – Europe | (0.3) | Globalworth Real Estate | 7.0 | Schroder European Real Estate | (2.4) |
| Europe | (1.3) | JPMorgan European Growth and Income | 5.8 | European Opportunities | (10.1) |
| Biotechnology & healthcare | (1.6) | International Biotechnology | 10.9 | Syncona | (14.4) |
| Infrastructure securities | (4.6) | Ecofin Global Utilities & Infrastructure | 5.9 | Premier Miton Global Renewables | (15.2) |
| Property – UK logistics | (14.1) | Warehouse REIT | (7.7) | Tritax Big Box REIT | (17.4) |
| Renewable energy infrastructure | (17.1) | Triple Point Energy Transition | 11.8 | Gresham House Energy Storage | (57.9) |
| Property – rest of world | (22.6) | Aseana Properties | 10.8 | Macau Property Opportunities | (38.4) |
| Latin America | (34.1) | BlackRock Latin American | (34.1) | n/a |
Negatives
The property – rest of world sector, made up of a few funds focused on particular and relatively unrelated regions, was stricken by poor performance due to generally thin traded strategies with country specific issues. Among these funds was Ceiba Investments, which was continually affected by macro factors involving Cuba’s difficult relationship with the US and the troubling economic situation of the country.
Any positive performance by the renewable energy infrastructure sector was seemingly reversed in October in the wake of the US election results and rising government bond yields both here in the UK and in the US. Fears of a U-turn on climate policy, exacerbated by the potential abolition of the Inflation Reduction Act, hit the share prices of several funds, as certain renewable projects were put at risk of being banned. Even the sector’s best performing fund of the year, Triple Point Energy Transition, had a double digit negative share price return. However, the fund’s performance will have been largely affected by TENT’s wind down process.
The rising bond yields and a slower pace to expected interest rate cuts also weighed on the property – UK logistics sector, particularly as a result of October’s budget.
Despite the opportunity presented by technological developments, the biotechnology and healthcare sector was impacted by investors focusing on other sectors that seemed less defensive, resulting in budget reductions for many companies. However, outliers included International Biotechnology Trust, which outperformed its reference index by 0.6%, although its discount continued to widen.
It was not the best year for European exposed trusts either, with the regions’ benchmark indices facing declines in relation to disappointing large cap results. Weak economic growth also inhibited investor confidence, in addition to concerns over looming trade disputes with the US.
Best performing trusts
Figure 11: Best performing trusts in price terms in 2024
| Sector | Return (%) | |
|---|---|---|
| Livermore Investments | Flexible investment | 75.2 |
| Alpha Real Trust | Property – debt | 73.3 |
| Petershill Partners | Growth capital | 68.9 |
| Amedeo Air Four Plus | Leasing | 60.0 |
| Seraphim Space Investment Trust | Growth capital | 58.1 |
| Baillie Gifford US Growth | North America | 56.0 |
| Menhaden Resource Efficiency | Environmental | 52.2 |
| Schiehallion Fund | Growth capital | 49.9 |
| JPMorgan Emerg E, ME & Africa Sec | Global emerging markets | 48.3 |
| Baker Steel Resources | Commodities & natural resources | 43.0 |
Livermore’s underlying portfolio of structured debt investments did well. However, it was the revaluation of its stake in airline AI-pricing engine Fetcherr that pushed Livermore to the top of this table.
In December, the share price of Alpha Real Trust (ARTL) jumped after it announced that it would delist, justifying the move by highlighting the lack of liquidity of its shares. ARTL offered a tender offer to minority shareholders that would not be interested in holding the fund as a private company at an attractive price.
Petershill Partners’ unique asset management investment strategy, better than expected fundraising by Petershill’s private holdings, and some profitable disposals helped drive a leap in its share price. From a broader view, this exhibits the share price’s rebound from its lows of 2021.
Amedeo was discussed above. It helped that lessee Thai Airlines is becoming profitable again, with the airline receiving monetary support from Thailand’s government.
Seraphim Space Investment Trust was a beneficiary of the substantial uplift in investment in the space technology sector in 2024. The sector was subject to a 25% year on year growth from 2023, with ‘seed stage’ activity, SSIT’s area of investment, comprising more than half of the increase. Much of the fund’s portfolio can take advantage of the success of SpaceX, although SSIT does not directly invest in the company. In the case of Baillie Gifford US Growth however, a primary allocation to SpaceX allowed the trust to benefit from the company’s jumps in valuation, which consisted of rumours of a tender offer that placed SpaceX’s value at $350bn in December. This also helped Schiehallion.
The recently proposed wind-down of Menhaden Resource Efficiency, precipitated by a widening discount, instigated a rally of its share price. Earlier on in July, Menhaden announced the recommencement of its share buyback programme, adding to its share price growth.
JPMorgan Emerging Europe Middle East and Africa remains volatile, a result of speculation of how the trust’s Russian assets might be valued under a Trump presidency, which manifested in a share price hike once Trump was elected. Although at times this was countered by litigation in Russia aimed at seizing its Russian assets. Baker Steel Resources was assisted by the announcement of the sale of its stake of Nussir ASA (the owner of a copper project in Norway) to Blue Moon.
Figure 12: Best performing trusts in NAV terms in 2024
| Sector | Return (%) | |
|---|---|---|
| Doric Nimrod Air Three | Leasing | 59.2 |
| Crystal Amber | UK smaller companies | 56.8 |
| Manchester & London | Global | 51.5 |
| JPMorgan Emerg E, ME & Africa Sec | Global emerging markets | 41.2 |
| Allianz Technology Trust | Technology & technology innovation | 36.9 |
| Doric Nimrod Air Two | Leasing | 36.5 |
| Castelnau Group | Flexible investment | 35.0 |
| Polar Capital Technology | Technology & technology innovation | 34.9 |
| Baillie Gifford US Growth | North America | 33.5 |
| JPMorgan American | North America | 30.6 |
Looking at figure 12 for the top performers in NAV, Doric Nimrod Air Three’s gains reflect its sister fund Doric Nimrod Air Two’s Emirates A380 deal.
Crystal Amber’s (CRS) performance was fuelled by the development of portfolio company Morphic. As CRS was undergoing its wind-up process, the increasing concentration of the portfolio meant that Morphic accounted for nearly 50% of the trust’s NAV in June.
As one of the best performing trusts of the year, Manchester & London was able to capitalise on its exposure to investments in artificial intelligence. The portfolio has very large exposures to Nvidia and Microsoft, which account for over half its assets. This enabled it to beat the two tech-focused trusts over the year.
Castlenau Group absorbed the funeral services business Dignity. It later acquired the will writing service Farewill from fellow investment trust Augmentum Fintech.
The US market’s dominance over 2024 is reflected in the impressive returns of JPMorgan American.
Worst performing trusts
Share price moves
In terms of the negatively performing trusts, Regional REIT (RGL) led the pack as it has struggled to fully recover from the effect of the pandemic on office property sales. The trust needed to restructure its debt and so in an effort to salvage itself, RGL announced a capital raising programme through a fully underwritten placing.
Figure 13: Worst performing funds in price terms in 2024
| Sector | Return (%) | |
|---|---|---|
| Regional REIT | Property – UK commercial | (62.4) |
| Gresham House Energy Storage | Renewable energy infrastructure | (57.9) |
| HydrogenOne Capital Growth | Renewable energy infrastructure | (56.4) |
| VPC Specialty Lending Investments | Debt – direct lending | (50.3) |
| Ecofin US Renewables Infrastructure | Renewable energy infrastructure | (43.6) |
| Gore Street Energy Storage Fund | Renewable energy infrastructure | (40.4) |
| Macau Property Opportunities | Property – rest of world | (38.4) |
| Life Science REIT | Property – UK commercial | (36.7) |
| Digital 9 Infrastructure | Infrastructure | (36.5) |
| BlackRock Latin American | Latin America | (34.1) |
As mentioned, the renewable energy infrastructure sector was hit hard in 2024. However, the battery storage funds were hit particularly badly. Gresham House Energy Storage experienced a difficult start to the year after forecasting lower earnings on the back of underutilisation of its assets by the National Grid. Gore Street Energy Storage Fund was affected by the same issue, but its US business, which should have been a source of strength was affected by negative sentiment around Trump’s energy policies.
Despite a raft of positive news coming from much of its portfolio, HydrogenOne Capital Growth was hit by the failure of portfolio company HH2E, which was unable to find a financing partner to progress its first hydrogen plant.
Having begun its wind-up process in 2023, VPC Speciality Lending was affected by a widening discount, and some reductions in the estimated value of its portfolio. Also undergoing a slow wind-up process is Macau Property Opportunities, which was affected by slower residential property sales and weaker prices.
Ecofin US Renewables Infrastructure’s year was marked by the call for its wind up as the fund was unable to find a buyer for its assets, causing a substantial fall in its share price.
Citing an uncertain macroeconomic environment, Life REIT cut its dividend at the end of the first quarter. Despite laboratory spaces proving relatively resilient to these headwinds, offices remain weak.
Digital 9 Infrastructure’s struggle to find buyers for its assets during its wind-up weighed but the poor price achieved for the sale of its subsea cable business put the nail in the coffin. Things have gone from bad to worse since.
The aforementioned weakness in Brazilian markets was a major detractor for BlackRock Latin American as the trust has an overweight allocation to the country. Moreover, the result of the Mexican presidential elections led to a depreciation of the Mexican peso and corresponded with volatility in the country’s stock market.
NAV moves
Regional REIT’s NAV decline reflects moves in its underlying portfolio valuation and the dilutive effect of the equity raised during the year.
Figure 14: Worst performing funds in NAV terms in 2024
| Sector | Return (%) | |
|---|---|---|
| Regional REIT | Property – UK commercial | (57.3) |
| Digital 9 Infrastructure | Infrastructure | (44.6) |
| Phoenix Spree Deutschland | Property – Europe | (38.6) |
| BlackRock Latin American | Latin America | (35.2) |
| Riverstone Energy | Commodities & natural resources | (27.1) |
| Premier Miton Glb Renewables Trust | Infrastructure securities | (25.8) |
| Macau Property Opportunities | Property – rest of world | (25.0) |
| ICG-Longbow Senior Sec. UK Prop Debt Inv | Property – debt | (25.0) |
| Ground Rents Income Fund | Property – UK residential | (23.3) |
| VPC Specialty Lending Investments | Debt – direct lending | (22.6) |
Digital 9’s NAV was slashed on the grounds that the previous valuation had been assuming growth that it could not finance.
Phoenix Spree Deutschland’s year started with the ending of its funding for one of its projects in Berlin. This was due to the decrease of property valuations in the area and the higher costs associated with development.
Among Riverstone Energy’s holdings, companies such as Permian Resources showed falling valuations, contributing to a NAV reduction.
Money in and out
2024 saw significant shrinkage of the sector with a rollover the only new vehicle launched. 30 trusts left the sector but about the same number again are headed for the exit.
Money coming into existing funds
Outperforming its benchmark for much of the year, JPMorgan Global Growth and Income was the biggest issuer of stock, in part as a result of its merger with JPMorgan Multi Asset Growth and Income (see below).
Regional REIT’s capital raising permitted the trust to fully pay off its £50m retail bond. The move also created room for its loan covenants, as RGL’s loan to value was reduced to 40.6% from 56.8%.
Even though Ashoka India underperformed its benchmark, the company issued shares whilst demonstrating another year of strong results, even closing the year at a 1.6% premium.
Globalworth Real Estate’s issuances related to scrip dividends.
As interest rates remained higher for longer, funds investing in loans and bonds were in demand for the income that they offered. Two UK small cap funds with a focus on backing stocks that a private equity investor might find attractive performed well and attracted investors. Income seekers also alighted upon Law Debenture, which has also been performing well.
Figure 15: Money raised in 2024
| Sector | £m | |
|---|---|---|
| JPMorgan Global Growth and Income | Global equity income | 441.9 |
| Regional REIT | Property – UK commercial | 110.5 |
| Ashoka India Equity | India/Indian subcontinent | 105.9 |
| Globalworth Real Estate | Property – Europe | 89.2 |
| Invesco Bond Income Plus | Debt – loans and bonds | 36.9 |
| TwentyFour Select Monthly Income | Debt – loans and bonds | 26.0 |
| CQS New City High Yield | Debt – loans and bonds | 23.1 |
| Odyssean Investment Trust | UK smaller companies | 21.7 |
| Rockwood Strategic | UK smaller companies | 20.1 |
| Law Debenture | UK equity income | 12.3 |
Money going out of existing funds
Figure 16: Money returned in 2024
| Sector | £m | |
|---|---|---|
| Scottish Mortgage | Global | (1,321.6) |
| Smithson Investment Trust | Global smaller companies | (414.2) |
| Finsbury Growth and Income | UK equity income | (384.7) |
| Bellevue Healthcare | Biotechnology & healthcare | (312.2) |
| European Opportunities | Europe | (294.7) |
| Monks | Global | (293.0) |
| F&C Investment Trust | Global | (280.9) |
| Capital Gearing | Flexible investment | (206.5) |
| Worldwide Healthcare | Biotechnology & healthcare | (194.8) |
| Personal Assets | Flexible investment | (193.2) |
It should not come as a surprise that Scottish Mortgage was the largest returner of stock by far. The trust continued to operate its £1bn buyback programme, partly in response to Elliot Associates’ activism in the company’s share register. Its sister trust Monks also shrank.
Poor performance relative to peers and indices meant that Smithson Investment Trust and Finsbury Growth and Income regularly appeared on money returned tables throughout 2024.
Due to a challenging year for biotechnology stocks, trusts such as Bellevue Healthcare and Worldwide Healthcare have continually attempted to narrow their widening discounts. Bellevue offered a redemption opportunity that was taken up quite enthusiastically.
European Opportunities was targeted by Saba and responded with a 25% tender offer. It continued to buyback stock as the year progressed.
F&C Investment Trust has generated fairly decent returns and the pace of its buybacks has been slowing.
Capital Gearing and Personal Assets both disappointed investors as three-year returns failed to keep pace with inflation, undermining their absolute return credentials.
Corporate actions
In 2024, we said goodbye to 30 investment companies:
- Aberforth Split Level Income – reconstructed to become Aberforth Geared Value and Income
- abrdn China Investment – merged into Fidelity China Special Situations
- Artemis Alpha – merged with Aurora to become Aurora UK Alpha.
- Asia Energy Impact – liquidated after an Indian solar investment went wrong
- Atrato Onsite Energy – liquidated after growth stalled
- Balanced Commercial Property – bid for by Starwood
- Boussard & Gavaudan Holding – failed a discount-triggered continuation vote
- CatCo Reinsurance Opportunities – long-term wind down reached its conclusion
- Ediston Property – portfolio sold to a US REIT and the company liquidated
- Foresight Sustainable Forestry – to a bid by Averon Park
- Gulf Investments – suffered death by a thousand cuts as a consequence of six-monthly 100% exit opportunities
- Henderson Diversified Income – merged into Henderson High Income
- Henderson EuroTrust merged with Henderson European Focus to become Henderson European Trust
- Hipgnosis Songs Fund – to a bid by Blackstone
- Infrastructure India – succumbed to ever-increasing debt pile
- The four Invesco Select portfolios were merged together into Invesco Global Equity Income
- JPMorgan Japan Small Cap Growth and Income – merged with JPMorgan Japanese
- JPMorgan Mid Cap – merged into JPMorgan UK Smaller Companies to become JPMorgan UK Small Cap Growth and Income
- JPMorgan Multi-Asset Growth & Income – merged into JPMorgan Global Growth and Income
- LXI REIT – merged into LondonMetric Property
- Marble Point Loan Financing – was shrinking too fast
- NB Global Monthly Income – to a managed wind down
- Pollen Street – rejig of capital structure and reclassification as a trading company
- SLF Realisation (the former SQN Asset Finance) to a long term wind down
- Tritax EuroBox – to a bid by Brookfield
- Troy Income & Growth – merged into STS Global Income and Growth
- UK Commercial Property Trust to a bid by Tritax Big Box REIT
- Witan – merged with Alliance Trust to become Alliance Witan
Significant ratings changes
Figure 17: Median discounts on all investment companies and investment companies investing in equities over 2024
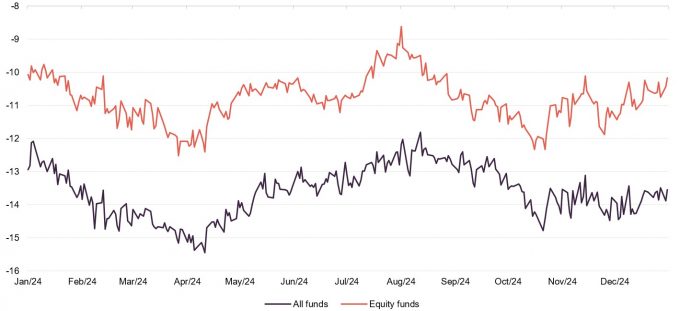
Source: Morningstar, QuotedData
Figure 18: Median discount on growth capital funds
Figure 19: Median discount on renewable energy funds
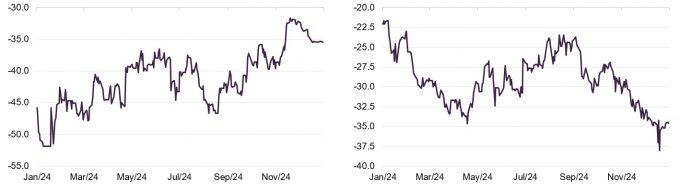
Source: Morningstar, QuotedData
Source: Morningstar, QuotedData
Figure 20: Percentage point changes to discounts and premiums by sector over 2024
| Sector | Premium/ (discount) 31/12/24 (%) |
Change in discount (%) | Biggest rating riser in named sector | Change in discount (%) |
Biggest rating faller in named sector | Change in discount (%) |
|---|---|---|---|---|---|---|
| Debt – structured finance | (17.6) | 12.8 | Blackstone Loan Financing | 17.5 | TwentyFour Income | (3.7) |
| Growth capital | (35.4) | 10.4 | Petershill Partners | 26.2 | Schroder British Opportunities | (3.9) |
| Environmental | (10.2) | 9.4 | Menhaden Resource Efficiency | 25.0 | Impax Environmental Markets | (2.7) |
| Debt – loans & bonds | 0.2 | 6.9 | NB Distressed Debt Extended | 19.3 | NB Distressed Debt | (7.6) |
| Commodities & natural resources | (13.5) | 6.0 | Baker Steel Resources | 18.1 | BlackRock World Mining | (2.3) |
| Leasing | (29.4) | 5.5 | Amedeo Air Four Plus | 20.3 | Doric Nimrod Air Three | (20.1) |
| Property – UK residential | (41.9) | 5.0 | Residential Secure Income | 12.8 | Ground Rents Income | (3.3) |
| Global smaller companies | (9.1) | 4.4 | Edinburgh Worldwide | 14.3 | North Atlantic Smaller Companies | (6.7) |
| North American smaller companies | (5.7) | 4.2 | JPMorgan US Smaller Companies | 6.6 | Brown Advisory US Smaller Companies | 1.7 |
| Private equity | (31.4) | 3.7 | HgCapital Trust | 16.6 | Symphony International | (13.3) |
| Infrastructure securities | (11.9) | 2.9 | Premier Miton Global Renewables | 10.8 | Ecofin Global Utilities and Infrastructure | (5.0) |
| North America | (9.5) | 2.3 | Baillie Gifford US Growth | 14.7 | Pershing Square Holdings | (4.3) |
| Debt – direct lending | (16.5) | 1.7 | GCP Asset Backed Income | 13.1 | VPC Speciality Lending | (35.8) |
| European smaller companies | (10.7) | 1.6 | The European Smaller Companies Trust | 7.7 | European Assets | (7.5) |
| Japanese smaller companies | (3.0) | 1.3 | Nippon Active Value | 1.3 | Baillie Gifford Shin Nippon | (4.6) |
| Global | (8.0) | 1.0 | Brunner | 12.1 | Manchester & London | (9.5) |
| Technology & technology innovation | (9.4) | 0.7 | Allianz Technology | 1.8 | Polar Capital Technology | (0.3) |
| Property – debt | (11.2) | 0.6 | Alpha Real Trust | 39.7 | Real Estate Credit Investments | (5.0) |
| Country specialist | (12.2) | 0.5 | VietNam Holding | 4.8 | VinaCapital Vietnam Opportunity | (5.6) |
| Hedge funds | (18.2) | 0.3 | Alternative Liquidity Fund | 24.2 | Gabelli Merger Plus+ | 0.3 |
| Financials & financial innovation | (20.1) | (0.1) | Polar Capital Global Financials | 4.2 | Augmentum Fintech | (4.5) |
| UK all companies | (10.1) | (0.1) | Henderson Opportunities | 14.2 | Aurora UK Alpha | (1.7) |
| UK smaller companies | (11.5) | (0.6) | Rights and Issues | 3.7 | Crystal Amber | (9.7) |
| UK equity income | (6.9) | (0.9) | CT UK Capital & Income | 4.2 | Schroder Income Growth | (5.1) |
| Asia Pacific equity income | (9.3) | (1.0) | Henderson Far East Income | 8.4 | JPMorgan Asia Growth and Income | (1.0) |
| Europe | (10.0) | (1.3) | JPMorgan European Growth and Income | 0.7 | European Opportunities | (4.6) |
| Sector | Premium/ (discount) 31/12/24 (%) |
Change in discount (%) | Biggest rating riser in named sector | Change in discount (%) |
Biggest rating faller in named sector | Change in discount (%) |
|---|---|---|---|---|---|---|
| Global emerging markets | (12.8) | (1.5) | JPMorgan Emerging Europe Middle East and Africa | 88.5 | Mobius Investment Trust | (2.6) |
| Flexible investment | (20.0) | (1.8) | Livermore Investments | 31.1 | abrdn Diversified Income & Growth | (21.1) |
| India/Indian subcontinent | (12.2) | (2.1) | Ashoka India Equity | (0.2) | India Capital Growth | (3.5) |
| Property – rest of world | (68.1) | (2.4) | Macau Property Opportunties | (2.4) | Ceiba Investments | (9.3) |
| Asia Pacific smaller companies | (15.8) | (3.0) | Scottish Oriental Smaller Co.s | (3.0) | abrdn Asia Focus | (4.5) |
| China / greater China | (12.9) | (3.3) | Baillie Gifford China | (1.4) | JPMorgan China Growth and Income | (4.3) |
| Japan | (13.1) | (3.6) | Schroder Japan | (2.9) | Baillie Gifford Japan | (4.0) |
| Asia Pacific | (12.0) | (3.6) | Asia Dragon | 5.8 | Pacific Assets | (9.4) |
| Biotechnology & healthcare | (12.5) | (4.0) | Bellevue Healthcare | 0.1 | Syncona | (6.6) |
| Property – UK commercial | (22.6) | (4.4) | Schroder Real Estate | 10.1 | Life Science REIT | (28.2) |
| Property – Europe | (38.1) | (4.6) | Globalworth Real Estate | 7.4 | Schroder European Real Estate | (4.7) |
| Global equity income | (8.9) | (7.1) | Invesco Global Equity Income | 3.2 | Scottish American | (9.9) |
| Property – UK healthcare | (29.6) | (7.8) | Target Healthcare REIT | (5.5) | Care REIT | (10.0) |
| Infrastructure | (21.7) | (8.7) | Cordiant Digital Infrastructure | 4.6 | BBGI Global Infrastructure | (11.3) |
| Renewable energy infrastructure | (34.6) | (12.5) | Harmony Energy Income | 3.7 | Gresham House Energy Storage | (42.9) |
| Property – UK logistics | (34.9) | (14.0) | Warehouse REIT | (11.9) | Tritax Big Box REIT | (18.8) |
Figure 17 shows that discounts did not narrow over 2024, but discounts on conventional equity trusts remained narrower than the sector as a whole. Figure 18 highlights the narrowing discounts on the growth capital sector, where trusts such as Petershill, Chrysalis and Seraphim saw improving ratings. By contrast, discounts on renewable energy trusts, which already looked overly wide at the start of 2024, actually widened, as Figure 19 shows.
Figure 20 breaks the investment companies universe down by sector and looks at the biggest rating improvements and deteriorations over the course of 2024 within each sector. With just 19 of 43 sectors in a better position at end December 2024 than at the start of the year, discounts widening was a prevailing theme for the year, however much of these were driven by individual stocks.
Although the re-rating of growth-focused strategies was good news, it has some way to go yet as discounts are still very wide on these funds.
The commodities and natural resources sector enjoyed a rebound, helped by positive news from Baker Steel’s portfolio. For trusts exposed to gold, most notably Golden Precious Metals, an all-time high price of gold delivered impressive returns. Elsewhere in the sector, it was a negative year for the uranium market. Nevertheless, Geiger Counter’s discount narrowed.
Better ratings for the UK residential sector reflect Residential Secure Income’s announcement of a wind-up and events at PRS REIT that seem set to result in a bid for that company or its portfolio.
On the less positive side, rising government bond yields and slower than expected interest rate cuts hit interest rate sensitive sectors such as property, renewables, and infrastructure, with the hardest hit being the Property – UK logistics sector. Demand was stifled as investors looked to areas that provided faster returns.
Battery funds were hit by poor revenues in the UK. Some renewables trusts have exposure to the US market. Here, and in some other sectors, the US election result had an impact, as investors flocked to other sectors that were expected to profit from Trump’s win and away from those that might be affected by his policies.
QD views from 2024
Our weekly opinion pieces
- Our analysts’ top picks for 2024 – 5 Jan
- Should I stay or should I go? – 13 Jan
- The REIT entry point – 20 Jan
- So long MATE – 26 Jan
- VIP access at bargain prices – 2 Feb
- Inflation Scare – 16 Feb
- Clash of the titans – 8 Mar
- What goes down must come up? – 28 Mar
- Navigating a sticky situation – 12 Apr
- Our search for income – a deep dive presentation on the renewable and infrastructure sectors – 18 Apr
- Hot stuff – 19 Apr
- Vietnam, big on ambition – 26 April
- Higher for longer – 3 May
- Growth utilities – 10 May
- Family fortunes – 17 May
- Signals turn green for real estate – 24 May
- We must put our trust in Labour – 7 Jun
- Think different – 14 Jun
- Reaping what you sow – 21 Jun
- Going off piste in search of yield – 28 Jun
- Spotlight on democracy – 12 July
- The first cut is the deepest – 2 Aug
- Bubble trouble? – 9 Aug
- Gold medals and UK growth – 16 Aug
- It’s a wonderful (Vanguard) Life – 30 Aug
- The future of private equity – 6 Sep
- Real estate’s Rocky moment? – 13 Sep
- Much more to Europe than dynamic duo – 20 Sep
- Lift off in China – 4 Oct
- What’s growth got to do with it? – 11 Oct
- MAGA or TINA, the only way is up? – 22 Nov
- QuotedData’s review of the year 2024 – 22 Dec
Source: Visit www.quoteddata.com or more on these and other stories plus in-depth analysis on some funds, the tools to compare similar funds and basic information, key documents and regulatory news announcements on every investment company quoted in London

Manager interviews from 2024
Click on the company name to view the interview, or visit our youtube channel.
Manager interviews from the weekly show
| 12 January | Tim Levene | Augmentum |
| 19 January | Purvi Sapre | Energy Efficiency Income Trust |
| 26 January | Nick Montgomery & Bradley Biggins | Schroder Real Estate Investment Trust |
| 2 February | Ross Grier | NextEnergy Capital |
| 9 February | Kartik Kumar | Artemis Alpha Trust |
| 16 February | Richard Hulf | HydrogenOne Capital |
| 23 February | Gurpreet Gujral | Atrato Onsite Energy |
| 1 March | Charles Jillings | Utilico Emerging Markets |
| 8 March | Richard Aston | CC Japan Income & Growth Trust |
| 15 March | Steven Tredget | Oakley Capital |
| 22 March | James Hart, Nish Patel & Jonathan Brown | QuotedData’s weekly news show special: Has the tide turned? |
| 5 April | Simon Farnsworth | Life Science REIT |
| 12 April | Phil Waller | JPMorgan Global Core Real Assets |
| 19 April | Jean-Hugues de Lamaze | Ecofin Global Utilities and Infrastructure |
| 26 April | Ken Wotton | Strategic Equity Capital |
| 3 May | Laura Foll | Lowland Investment Company |
| 10 May | Richard Pindar | Literacy Capital |
| 17 May | Mark Sheppard | Manchester & London IT |
| 24 May | Edward Hunt | HICL Infrastructure |
| 31 May | Nick Brind | Polar Capital Global Financials |
| 7 June | Olivia Macdonald | Majedie Investments |
| 14 June | Luciano Suana | Menhaden Capital Management |
| 21 June | Nick Greenwood, Peter Hewitt & Ben Ritchie | QuotedData’s weekly news show special: Big discounts |
| 28 June | Nick Train | Finsbury Growth & Income |
| 5 July | James Baker & David Horner | The Investment Company |
| 12 July | Kenneth MacKenzie | Target Fund Managers |
| 19 July | Chris Clothier | Capital Gearing |
| 26 July | Henry Butt | AEW UK REIT |
| 2 August | Peter Hewitt | Columbia Threadneedle |
| 9 August | Matt Cable | Rights and Issues |
| 16 August | Ian Lance | Temple Bar Investment Trust |
| 23 August | Craig Baker | Alliance Trust |
| 30 August | James Harries | STS Global Income & Growth Trust |
| 6 September | Randall Sandstrom | Sequoia Economic Infrastructure Income Fund |
| 13 September | Jon Forster | Impax Environmental Markets |
| 20 September | David Bird, Neil Hermon, Georgina Brittain & Duncan Ball | QuotedData’s weekly news show special: New government, new opportunities |
| 27 September | Paul Niven | F&C Investment Trust |
| 4 October | Richard Brown | Castelnau Group |
| 11 October | James Armstrong | Bluefield Solar Income Fund |
| 18 October | Katie Potts | Herald Investment Trust |
| 25 October | Helen Steers | Pantheon International Plc |
| 1 November | Job Curtis | City of London Investment Trust |
| 8 November | Ian ‘Franco’ Francis | CQS New City High Yield |
| 15 November | Sebastian Lyon | Personal Assets Trust |
| 22 November | Alex Crooke | Bankers Investment Trust |
| 29 November | Thomas Moore, David Moss & Ben Green | QuotedData’s weekly news show special: Investing for income |
| 6 December | David Smith | Henderson High Income |
| 13 December | Craig Baker | Alliance Witan |
Outlook for 2025
Here are some recent comments from managers and directors drawn from our latest economic and political summary that you may find interesting.
On the investment companies sector
Nick Greenwood and Charlotte Cuthbertson, MIGO Opportunities Trust: “Investor focus remains on the “Magnificent 7” in the US and precious little else; it has not broadened as we had hoped. In the words of the Scottish poet Charles Mackay “Men, it has been well said, think in herds; it will be seen that they go mad in herds, while they only recover their senses slowly, one by one.” It is too soon to judge whether the lofty valuations for these companies constitute a bubble, or if they will continue to grow at the rates demanded by the market.”
Our January 2025 economic and political roundup has much more detail and many more comments on sectors including Europe, Japan, private equity, biotechnology & healthcare and renewable energy infrastructure.
On the UK
Robbie Robertson, Lowland: “A meaningful re-rating of the UK market, and smaller companies in particular, has not really happened.
We had hoped that a decisive UK election result would remove the uncertainty isnherent in a Conservative Government with a propensity to self-destruct but the new Labour Government seems pre-occupied with painting an Armageddon-like picture of the economy it inherited. Ours is a bottom-up approach to investing, but the economic landscape in which our companies are operating is disappointing given initial optimism after the UK election. The long build-up to the budget, and its eventual content, were not helpful, with many facing substantial cost increases as a result of the increase in the minimum wage and National Insurance costs. The prospects for inflation and interest rates are less benign than they had appeared. Confidence, optimism and economic growth have suffered, and the uncertainties implicit in the result of the US election have not helped.
Despite this backdrop, we believe good, well managed UK companies will continue to prosper. A revaluation of the UK market, and particularly a portfolio such as ours, may be further deferred, but should come in time with a material capital uplift when the fundamentals of UK equities are more widely appreciated.”
On Asia
Sir Richard Stagg, chair, JPMorgan Asia Growth and Income: “The global landscape is currently marked by significant unpredictability. A growing number of political leaders are moving away from the Bretton Woods consensus and the belief that free trade is a key driver of global economic growth. The President-elect of the United States has indicated plans to implement a series of tariffs on imports, with a particular emphasis on China. Meanwhile, the conflict in Ukraine persists and uncertainty in the Near East has been further exacerbated by recent events in Syria (however potentially welcome) , while recent developments in Korea caught markets unaware. Additionally, President Xi’s public declarations suggest a steadfast commitment to the reunification of China and Taiwan, by any means deemed necessary.
Nonetheless, I believe the prospects for Asian economies remain positive – more so when compared to the relatively lacklustre growth projections of developed markets. The Chinese government’s autumn stimulus packages suggest that it is becoming more serious about boosting consumer spending and supporting the still ailing property sector. If these measures are effective, they have the potential to provide fresh impetus to growth across the region. So too does monetary easing by Asian central banks, which appears imminent. The US Federal Reserve cut rates by more than expected in September, and further cuts can be expected this year and in 2025. This would open the way for Asian central banks to follow suit.”
On Europe
Jon Ingram, Jack Featherby & Jules Block, JPMorgan European Discovery: “When considering the outlook for European financial markets, one uncomfortable reality is that political uncertainty is escalating, especially given the perceived binary nature of many national elections occurring around the region and world. However, we cannot second guess the impact of political events on financial markets. The Company’s investment strategy remains focused instead on identifying Europe’s ‘hidden gems’ – great companies with strong fundamentals that have escaped the attention of most investors.
Macroeconomic developments over the review period have been decisively positive. Looking across the asset class, we expect the easing of monetary headwinds and improving economic growth indicators to be favourable for economically geared smaller companies.
In addition, after a period of subdued deal flow, lower interest rates in concert with attractive valuations, are likely to catalyse an uptick in M&A within the European smaller companies space.”
Global emerging markets
Martin Shenfield, chair, Ashoka WhiteOak Emerging Markets: “The global economic backdrop, notably in the US, is a broadly constructive one for EMs. Whilst the international geo-political environment remains challenging, the tilt towards a more accommodative monetary policy and cutting interest rates by the Federal Reserve together with the recently announced new stimulus measures in China are likely to support both underlying economic growth as well as improved sentiments for EMs.
Any potential slowdown in US economic growth is always a risk, but currently US economic resilience continues to surprise positively and, even if there is a temporary deceleration, growth may well subsequently reaccelerate. Nevertheless, individual EM economieswould be differently impacted by any changes in US growth or policies, with for example Mexico remaining highly integrated with US supply chains and India in contrast much less sensitive to US macroeconomic and market developments. This in turn allows the Investment Manager to construct a fully diversified portfolio to mitigate risk. Portfolio flows to the EM asset class could now recover, driven by spillovers from improved sentiment towards Chinese capital markets. However, the major uncertainty and risk revolves around the aftermath of the US election, together with the threat of more punitive tariffs.”
On technology
Ben Rogoff, manager, Polar Capital Technology Trust: “The US equity market and the dollar responded positively to Donald Trump’s decisive presidential election victory and the likely Republican control of both the Senate and House of Representatives, as markets welcomed a pro-business, anti-regulatory agenda expected to support corporate investment and capital deployment. However, concerns remain around tariffs, higher fiscal deficits and reduced immigration tightening the labour supply. At a time of above-average valuations and significant geopolitical uncertainty, these factors could drive higher inflation, pushing up yields and tightening financial conditions, potentially slowing the economy.
A new round of tariffs on China would likely be inflationary. If the full 60% tariff on Chinese imports went into effect, this would likely boost US core PCE by 0.3-0.4%, while a 10% ‘across the board’ tariff might add around +1% to inflation, according to Goldman Sachs. Indeed, the uncertainty around the scope and size of tariffs may well tighten financial conditions anyway, just as it did in 2018-19, which could weigh on capital investment and valuation multiples.
Growing deficits and debt burdens are another concern. Extending the 2017 tax cuts would leave the total and primary deficit at 6.4% and 3.1% of GDP in FY24, at uncomfortably high levels given that US debt-to-GDP is roughly 100% and could reach 130% within a decade. While this may support higher nominal growth near term, the risk of a rebound in inflation as well as the lurking threat of debt markets being unwilling to finance such fiscal largesse at prevailing rates could jeopardise the path of future interest rate cuts.”
We wish you good luck and good health with all your endeavours in 2025

IMPORTANT INFORMATION
This note was prepared by Marten & Co (which is authorised and regulated by the Financial Conduct Authority).
This note is for information purposes only and is not intended to encourage the reader to deal in the security or securities mentioned within it. Marten & Co is not authorised to give advice to retail clients. The note does not have regard to the specific investment objectives, financial situation and needs of any specific person who may receive it.
Marten & Co may have or may be seeking a contractual relationship with any of the securities mentioned within the note for activities including the provision of sponsored research, investor access or fundraising services.
This note has been compiled from publicly available information. This note is not directed at any person in any jurisdiction where (by reason of that person’s nationality, residence or otherwise) the publication or availability of this note is prohibited.
Accuracy of Content: Whilst Marten & Co uses reasonable efforts to obtain information from sources which we believe to be reliable and to ensure that the information in this note is up to date and accurate, we make no representation or warranty that the information contained in this note is accurate, reliable or complete. The information contained in this note is provided by Marten & Co for personal use and information purposes generally. You are solely liable for any use you may make of this information. The information is inherently subject to change without notice and may become outdated. You, therefore, should verify any information obtained from this note before you use it.
No Advice: Nothing contained in this note constitutes or should be construed to constitute investment, legal, tax or other advice.
No Representation or Warranty: No representation, warranty or guarantee of any kind, express or implied is given by Marten & Co in respect of any information contained on this note.
Exclusion of Liability: To the fullest extent allowed by law, Marten & Co shall not be liable for any direct or indirect losses, damages, costs or expenses incurred or suffered by you arising out or in connection with the access to, use of or reliance on any information contained on this note. In no circumstance shall Marten & Co and its employees have any liability for consequential or special damages.
Governing Law and Jurisdiction: These terms and conditions and all matters connected with them, are governed by the laws of England and Wales and shall be subject to the exclusive jurisdiction of the English courts. If you access this note from outside the UK, you are responsible for ensuring compliance with any local laws relating to access.
No information contained in this note shall form the basis of, or be relied upon in connection with, any offer or commitment whatsoever in any jurisdiction.
Investment Performance Information: Please remember that past performance is not necessarily a guide to the future and that the value of shares and the income from them can go down as well as up. Exchange rates may also cause the value of underlying overseas investments to go down as well as up. Marten & Co may write on companies that use gearing in a number of forms that can increase volatility and, in some cases, to a complete loss of an investment.