
Powering ahead
A good run of absolute and relative performance by Ecofin Global Utilities and Infrastructure (EGL) is attracting attention. The board’s strong focus on discount control has removed loose and discount-driven shareholders and paved the way for the trust’s shares to trade at a premium, enabling it to re-expand.
There are good reasons why the recent share issuance should continue. Demand for power is rising – to support the massive investment in data centres for AI and the energy transition, while infrastructure needs upgrading and replacing. The manager believes that this long-term growth potential is not reflected in valuations.
We also think investors recognise the value of the sectors’ predictable and often inflation-linked cash flows in an increasingly uncertain world.
Developed markets utilities and other economic infrastructure exposure
EGL seeks to provide a high, secure dividend yield and to realise long‐term growth, while taking care to preserve shareholders’ capital. It invests principally in the equity of utility and infrastructure companies in Europe, North America, and other developed OECD countries.
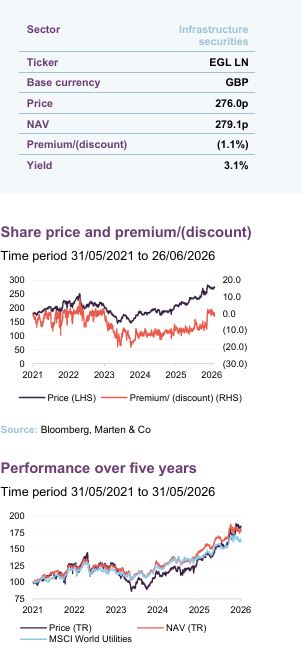
| 12 months ended | Share price total return (%) | NAV total return (%) | MSCI World Utilities TR (%) | S&P Global Infra TR (%) | MSCI World TR (%) |
|---|---|---|---|---|---|
| 31/05/2022 | 26.3 | 24.8 | 20.8 | 25.5 | 6.9 |
| 31/05/2023 | (6.6) | (4.8) | (6.0) | (5.9) | 4.0 |
| 31/05/2024 | (4.2) | 8.4 | 9.9 | 9.5 | 21.6 |
| 31/05/2025 | 21.0 | 13.8 | 11.2 | 13.8 | 7.5 |
| 31/05/2026 | 34.5 | 20.8 | 16.6 | 16.7 | 27.4 |
Market backdrop
Jean-Hugues de Lamaze, EGL’s manager, believes that the supportive long-term growth outlook for the utilities and infrastructure sectors is undiminished, but notes that there are some short-term headwinds to sentiment. EGL appears to be navigating this well.
Rate fears on Iran war
Recent pull-back on fears of higher interest rates
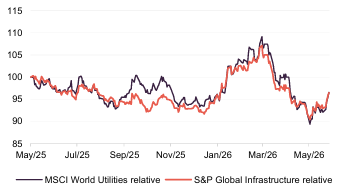
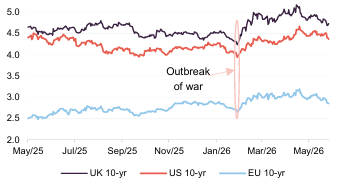
As Figure 1 shows, until very recently, the utilities and wider economic infrastructure sectors had been faring well relative to the wider market. However, since the outbreak of war between the US/Israel and Iran, fears have grown of rising inflation and that this, in turn, would lead to higher interest rates. Higher rates have traditionally been seen as a major headwind for long duration sectors such as utilities and infrastructure. Fortunately, there are tentative signs that those fears are easing as Trump attempts to stop the war. Jean-Hugues observes that EGL’s European names have fared better than their US counterparts over this period, which has contributed to the trust’s outperformance.
Figure 1: MSCI World Utilities and S&P Global Infrastructure relative to MSCI World
Source: Bloomberg
Figure 2: UK, US, and EU 10-year bond yields
Source: Bloomberg
By closing the Strait of Hormuz, the war has underscored the need to improve energy security
The war has also underscored the need to invest in energy security, which for many countries means more renewables and nuclear power, more energy storage, and crucially more robust power grids. To illustrate the scale of this, Jean-Hugues points out that National Grid (EGL’s second-largest holding) is planning to invest £70bn over the next five years (split between the UK and the US), and says that in Germany, almost half of €700bn infrastructure spendings over the next decade will be invested in upgrading its power grid.
Higher fuel prices more likely to hit long haul flights?
One other effect of the war is to push up the price of jet fuel. EGL does have some exposure to airports, which Jean-Hugues says have been a useful diversifier for the portfolio. EGL’s current positions – stocks such as Flughafen Zürich and Aena – are biased towards short-haul flights, which Jean-Hugues believes will be less affected. He observes that Flughafen Zürich’s recent May traffic statistics showed 9.1% year-on-year growth in passenger numbers. He also reiterates a theme that we have discussed in past notes; that there is a big gap between the valuation that the market is prepared to ascribe to listed airport groups and the much-higher multiples that they change hands for in the private equity world.
EGL also holds Italian air traffic control company ENAV, which is seeing more flights going through its airspace as a result of the various conflicts taking place at the moment.
US LNG is in demand to make up shortfall from the Gulf
The Iran war has been a boon for US LNG producers, which have been able to pick up some of the shortfall of supply coming from the Gulf and raise their prices. However, Jean-Hugues observes that these companies have long been beneficiaries of the Ukraine war for similar reasons. Even today, some European countries are still buying Russian gas, but they have also been importing a lot more from the US.
Demand for gas will persist for some time yet, in Jean-Hugues’s view – maybe another 20 years – as it will take time to build out the volume of energy storage needed to replace gas-fired plants as the marginal producer of power. However, he also observes that when it goes, it will be quick. It only took 15 years to go from 50% of power from coal in the UK to zero.
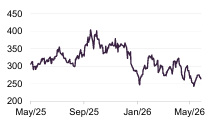
Figure 3: Constellation Energy (USD)
Source: Bloomberg
Growing demand for power
Jean-Hugues feels that investors’ embrace of the AI data centre power demand theme, which was a big driver of the utilities sector in the US over 2024/25, has relaxed more recently. Share prices of US independent power producers such as Vistra and Constellation Energy have been relatively weak, which might reflect profit-taking by investors.
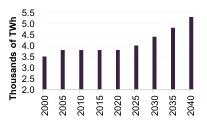
The underlying fundamentals of the power sector are good. As we discussed in the last note, the rate of change in demand for power turned positive in 2025, for the first time in 25 years – see Figure 4. AI data centre demand is a big factor in this, but the energy transition is playing its part too as electricity replaces fossil fuels in areas such as transport, heating and cooling.
Figure 4: US electricity demand
Source: Ecofin Global Utilities and Infrastructure Trust
US utilities are typically signing long term (15-30 years) contracts with data centre customers at prices up to $120/MWh. That is well ahead of prevailing power prices and even further ahead of long-term averages. Jean-Hugues envisages that these very long-term PPAs will be reproduced in Europe and the UK in time (he mentions that Drax is talking about the possibility, for example). The first of these deals was struck in Pennsylvania in 2024, but Jean-Hugues sees this as a phenomenon that has a long way to run. As more of power generators’ revenue is fixed for the long term, their business models are more de-risked. Jean-Hugues does not believe that markets are pricing this in.
Jean-Hugues is not overly concerned at present about the creditworthiness of the counterparties to these deals. They tend to be the hyperscalers, whose businesses are cash-generative.
He does observe increasing push-back at local and even State level against the pace of these developments. This is normally associated with new data centres putting strain on local grids and pushing up domestic power prices. To avoid this, the hyperscalers are attracted by deals on dedicated supply and particularly baseload supply (even better if it is low-carbon supply), that extends to reactivating mothballed nuclear plants and building new ones.
Hyperscalers are looking to secure long-term, low carbon baseload power
For example, in October 2025, NextEra Energy and Google announced an investment of $1.6bn to support the reopening of Duane Arnold Energy Center in Iowa. The 615MW nuclear plant is scheduled to be up and running by 2029. Google has agreed a 25-year PPA, the terms of which have not been disclosed.
In Europe, there are some companies that are better placed than others in this market. Jean-Hugues suggests that Iberdrola may be a beneficiary, for example. However, this is another reason why more investment in energy storage is needed, so that these 24/7-demand customers can make more use of renewable supply.
Renewing ageing infrastructure
The need to renew and replace ageing infrastructure is another important long-term theme within the portfolio. Jean-Hugues observes that the proportion of GDP spent on infrastructure peaked in the 1950s-70s and then declined rapidly. Today, much of that infrastructure is approaching or past the end of its design-life.
Vast sums are needed to bring ageing infrastructure up to date
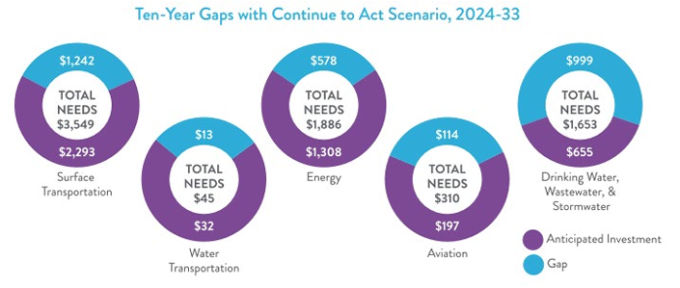
To use the example of the US, The America Society of Civil Engineers (ASCE) produces a “Report Card for America’s Infrastructure” each year. It observes that the Infrastructure Investment and Jobs Act of 2021 and Inflation Reduction Act of 2022 have made a real difference, but estimates that much more investment is needed. In a report entitled “Bridging the gap”, published in 2024, it estimated that an additional $9.1trn of investment would be needed to bring US infrastructure to a state of “good repair”.
Figure 5: The gap between planned and necessary infrastructure investment in the US
Source: ASCE, 2025 Report Card for America’s Infrastructure
It is forecasting that $5.4trn of that investment would be met if Congress maintained existing funding levels, which leaves a deficit of $3.7trn. The chart in Figure 4, taken from its 2025 Report Card for America’s Infrastructure, shows its estimate of the gap between planned and necessary investments in various sub-sectors of infrastructure. It says: “that figure does not include broadband, dams, levees, hazardous and solid waste, parks, and schools, which represent, at a minimum, an additional gap of $746bn”.
However, this is not just a US problem. The €500bn special fund for infrastructure and climate neutrality that Germany announced in March 2025 was designed to address decades of underinvestment, for example.
Ofwat blamed for parlous state of UK’s water infrastructure
Jean-Hugues points out that in the UK, Ofwat is being scrapped because it acted as a deterrent to investment, compounding the problems that the water and wastewater sector faces today. UK clean water leakages are significantly worse than in countries such as the Netherlands, Germany, and Switzerland, for example.
Valuations undemanding
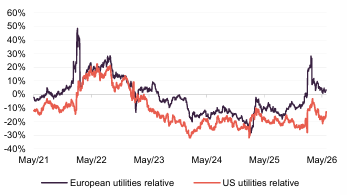
Figure 6: US and European utilities p/e relative
Source: Bloomberg
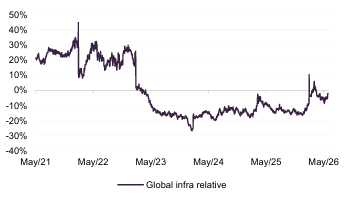
Figure 7: S&P Global Infrastructure p/e relative
Source: Bloomberg
Although, with the exception of US utilities, valuation multiples are a bit higher than long-term averages, the degree of this is not extreme. In addition, Jean-Hugues points out that these businesses are seeing earnings upgrades.
Figure 8: P/E multiples of current-year earnings
| 29 June 2026 | Average since 31 May 2021 | |
|---|---|---|
| Euro Stoxx 600 Utilities | 16.3x | 14.2x |
| Euro Stoxx 600 | 15.6x | 14.5x |
| S&P 500 Utilities | 19.1x | 18.9x |
| S&P 500 | 21.5x | 21.6x |
| S&P Global Infrastructure | 19.9x | 19.0x |
| MSCI World | 20.1x | 19.2x |
Portfolio – asset allocation
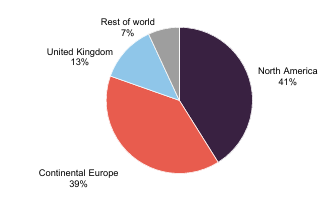
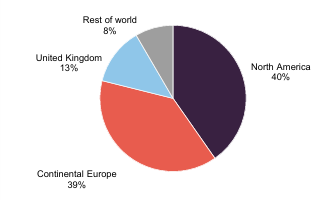
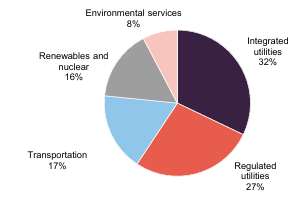
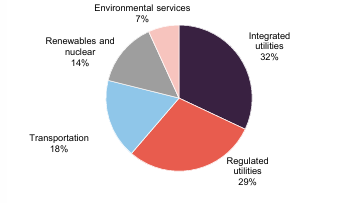
At the end of May 2026, there were 43 holdings in EGL’s portfolio. As the following charts show, there has been very little change to EGL’s geographic and sectoral asset allocation since we last published, using data as at the end of October 2025.
Figure 9: Geographic allocation as at 31 May 2026
Source: Ecofin Global Utilities and Infrastructure Trust
Figure 10: Geographic allocation as at 31 October 2025
Source: Ecofin Global Utilities and Infrastructure Trust
Figure 11: Sectoral allocation as at 31 May 2026
Source: Ecofin Global Utilities and Infrastructure Trust
Figure 12: Sectoral allocation as at 31 October 2025
Source: Ecofin Global Utilities and Infrastructure Trust
Top 10 holdings
However, there has been more movement within the underlying portfolio. Since our last note in December 2025 (using data up to 31 October 2025) there has been some change to the top 10 holdings list. Going out are Constellation Energy, Xcel Energy, Vinci, and SSE. Going in are Veolia Environnement, Brookfield Renewable, Dominion Energy, and Exelon.
The manager took profits on stocks such as Constellation and Vistra, fortunately ahead of the recent sell-off in those names. Jean-Hugues says that the earnings profile of these companies is still attractive, but the valuation had run ahead of itself. The sales also contributed to a diversification of the portfolio away from the AI data centre theme.
One theme that is evident within the top 10 is the investment needed in power grids. National Grid, Enel, EON, and Exelon are all plays on the transmission theme to some extent.
Figure 13: Top 10 holdings as at 31 May 2026
| Holding | Sector | Country | Allocation 31 May 2026 (%) | Allocation 31 October 2025 (%) | Percentage point change |
|---|---|---|---|---|---|
| Iberdrola | Integrated utilities | Spain | 4.3 | 3.4 | 0.9 |
| National Grid | Networks/Regulated | UK | 4.1 | 4.1 | – |
| NextEra Energy | Integrated utilities | US | 3.7 | 3.7 | – |
| Veolia Environnement | Water and waste management | France | 3.7 | 3.1 | 0.6 |
| Enel | Integrated utilities | Italy | 3.5 | 3.6 | (0.1) |
| ENAV | Transportation | Italy | 3.4 | 3.7 | (0.3) |
| E.ON | Integrated utilities | Germany | 3.0 | 3.4 | (0.4) |
| Brookfield Renewable | Renewable energy | Canada | 3.0 | 2.9 | 0.1 |
| Dominion Energy | Integrated utilities | US | 3.0 | 2.3 | 0.7 |
| Exelon | Integrated utilities | US | 3.0 | 3.2 | (0.2) |
| Total of top 10 | 34.7 | 36.3 |
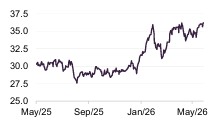
Figure 14: Veolia Environnement (EUR)
Veolia Environnement
Source: Bloomberg
Veolia Environnement (veolia.com) is a water company (60% of revenue) with divisions in waste (10%) and energy efficiency (30%). Its focus on the non-regulated market makes it a faster-growth company with a higher beta (something close to the market) than a regulated water business (Pennon’s beta is about 0.3). This was a pre-existing position for EGL but has been topped up. Jean-Hugues thinks Veolia’s growth potential is not reflected in its rating.
Veolia says that it is the leading global water business, with a presence in 44 countries. It operates on long-term contracts (an average of 11 years), with a mix of municipalities and companies, and inflation-linkage on 70% of its revenues, which will be an attractive quality for EGL if the war drives inflation higher. It says that most commodity price inflation is passed through to the end customer.
In the US, it just acquired Clean Earth, a hazardous waste business, for $3bn, and paid A$220m for a similar business in Australia. Its water business has been affected by delays to projects in the Middle East as a result of the war. Nevertheless, it delivered 2.1% revenue growth in Q1 2026 and saw margins move higher to boost profits.
It sees potential to capture business related to the data centre capex boom, but also sees a similarly-sized opportunity in cleaning up PFAS. It is guiding towards 5%-6% organic EBITDA growth for 2026 as a whole.
Dominion Energy
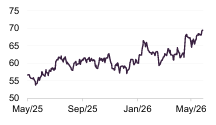
Figure 15: Dominion Energy (USD)
Source: Bloomberg
Dominion Energy (dominionenergy.com) is a traditional US utility with mostly regulated revenues. It provides a regulated electricity service to 3.6m homes and businesses in Virginia, North Carolina, and South Carolina, and a regulated natural gas service to 500,000 customers in South Carolina. That makes its core revenues defensive and predictable.
Dominion Energy claims to be a leading US developer and operator of regulated offshore wind and solar power and the largest producer of carbon-free electricity in New England.
It is now in the throes of a merger with NextEra Energy (EGL’s third-largest position). The deal sets new records for the sector, potentially creating a $250bn market cap company serving over 10m customers. Merger arbitrage activity is weighing on NextEra’s share price, but Jean-Hugues feels that this is a temporary problem. He thinks NextEra will do well from the deal, but it could take time to secure the necessary approvals.
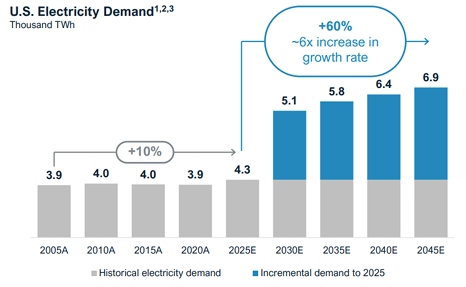
The companies are forecasting a significant increase in the growth of demand for power over coming years.
Figure 16: Power demand is expected to grow six times faster over the next 20 years
Source: Dominion/NextEra merger presentation. Note 1) Source: ISO/RTO Forecasts, NERC ES&D, Utility IRPs, ICF. Note 2) Historical demand represents data from NERC ES&D from 2000 to 2023, 2024 represents forecast from NERC ES&D. Note 3) Q1 2025 represents ICF’s demand for 2025; Q4 2025 represents ICF’s demand projects from 2030–2045.
They say that post-deal, 90%-95% of revenue will be regulated or long-term contracted – underscoring Jean-Hugues’s message about the de-risking of business models in the sector. NextEra’s strong presence in Florida (Florida Power & Light) is complementary to Dominion’s East Coast business. They are projecting 9% CAGR in EPS over the period from 2025 to 2032.
Williams Companies
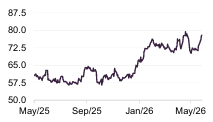
Figure 17: Williams (USD)
Source: Bloomberg
Outside of the top 10, EGL does have a relatively new position in Williams Companies (williams.com), which is a natural gas midstream business in the US, and therefore a beneficiary of the disruption to gas supplies from the Middle East. It already offered double-digit earnings growth and was valued attractively relative to peers. It bears no gas price risk (earnings are driven by volumes flowing through its pipelines).
Williams’s transnational network comprises over 32,000 miles of pipeline. It handles around a third of all US natural gas.
The company reported a 25% uplift in EPS for Q1 2026 and said it was on track to deliver adjusted EBITDA in the upper half of its 2026 guidance range. New business includes Project Neo, a $2.3bn behind-the-meter project to supply 682MW of power to AI data centres by 2028.
Athens Water
Figure 18: Athens Water (EUR)
Source: Bloomberg
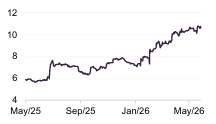
Another interesting stock in EGL’s portfolio is Athens Water (eydap.gr). This is a regulated utility. Part of the attraction is that Greece is being upgraded from emerging markets status to developed market status. That helps open up its stock market to a wider range of investors and should help with a re-rating. Jean-Hugues says that specific opportunity is being applied elsewhere in the portfolio.
At the time that EGL made its investment in Athens Water it was a low free float, low-liquidity stock, and so not a particularly large position within the portfolio, but the sort of thing that a closed-end fund such as EGL is ideally suited to investing in. A new five-year regulatory agreement was finalised last December, which underpins EPS growth of 15%-20% per annum. The re-rating of the stock has been helped by the placing of a large block of stock at a premium to the prevailing market price.
Performance
Up-to-date information on EGL is available on the QuotedData website.
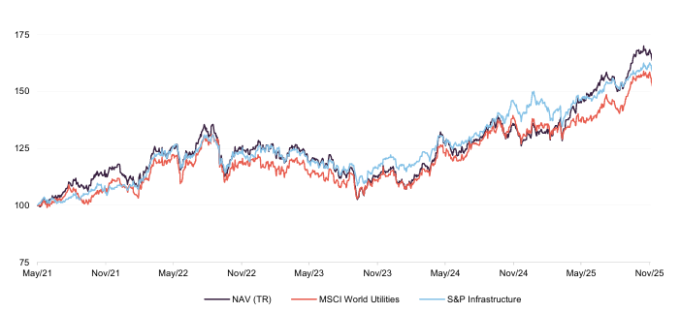
EGL’s NAV returns are ahead of those of the MSCI World Utilities Index over all time periods shown in Figure 19 and ahead of the S&P Global Infrastructure Index over most time periods. In addition, a recent narrowing of the discount has supercharged EGL’s share price returns.
The manager points out that over the long-term EGL’s total return performance has pretty much matched the performance of the MCSI World index but with much lower volatility.
Pleasingly, whilst geographical asset allocation has been helpful, it is stock selection that is driving returns.
Figure 19: Cumulative total return performance over periods ending 31 May 2026
| 3 months(%) | 6 months (%) | 1 year (%) | 3 years(%) | 5 years(%) | |
|---|---|---|---|---|---|
| EGL share price | 3.8 | 18.1 | 34.5 | 55.9 | 84.0 |
| EGL NAV | (5.8) | 5.1 | 20.8 | 48.9 | 76.9 |
| MSCI World Utilities | (5.8) | 2.0 | 16.6 | 42.4 | 61.6 |
| S&P Global Infrastructure | (4.2) | 5.6 | 16.7 | 45.5 | 71.7 |
| MSCI World | 7.2 | 9.5 | 27.4 | 66.6 | 85.3 |
Figure 20: Performance of EGL NAV and benchmark indices over five years to 31 May 2026
Source: Bloomberg, Marten & Co
Premium/(discount)
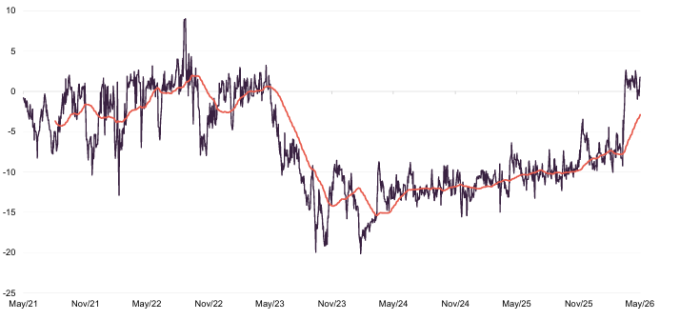
Over the 12-month period ended 31 May 2026, EGL’s shares traded between a premium of 2.6% and discount of 13.2% to NAV. The average over that period was a 7.5% discount. As of publishing, EGL was trading at a 1.1% discount.
Concerns over the effect of the Iran war have the potential to put upward pressure on interest rates, which would be seen as negative for long-duration assets such as utilities and infrastructure. However, the war has also demonstrated the importance of energy security and encouraged the case for an investment in alternative forms of generation such as nuclear and renewables, as well as strengthening the case for EVs. At the same time, increased demand for power to support AI capex, and the need to make power grids more robust, all feed through into a positive outlook for the trust.
EGL is now the only trust that offers a focused exposure to these themes, and we anticipate that will underpin demand for its shares.
Figure 21: EGL premium/(discount) over five years to 31 May 2026
Source: Bloomberg, Marten & Co
Share buybacks and issuance
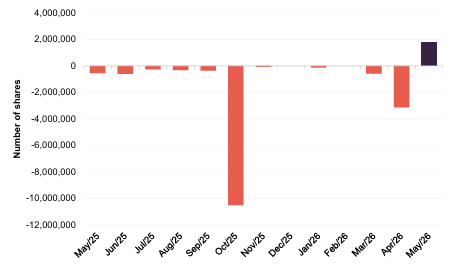
Figure 22: Number of shares issued/(repurchased) by month
Source: Ecofin Global Utilities and Infrastructure Trust, Marten & Co
The board has a good track record of buying back shares when EGL trades at an overly wide discount, and we are pleased to see that it has been able to reissue some shares recently, as the trust moved to trade at a premium to asset value. In either case, the trades would have been NAV-enhancing for EGL’s shareholders.
Dividend
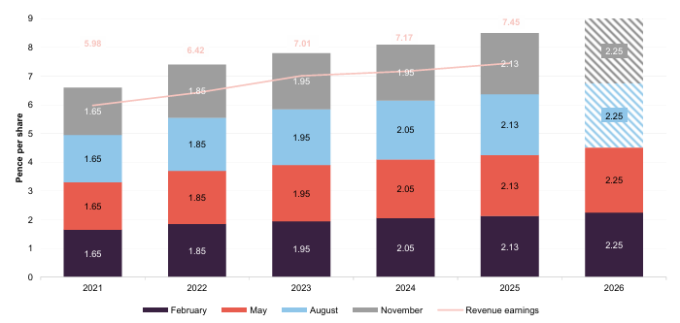
EGL is targeting four interim dividend payments of 2.25p for its current financial year
EGL’s stated aim is to deliver a dividend to shareholders that rises at least in line with inflation. Payouts for the financial year ending in September 2026 are targeted to be 9.0p, paid in four equal instalments of 2.25p, which is an increase of 5.9% over 2025. Based on the latest share price, the current yield is 3.1%.
Gearing and reserves can be used to augment the portfolio yield if necessary, and the dividend has tended to be partially uncovered in recent years, with a small part of the dividend being paid from reserves. The company had a distributable special reserve of £62.5m at the end of March 2026, equivalent to 68.1p per share.
Figure 23: EGL revenue income and dividend by financial year
Source: Ecofin Global Utilities and Infrastructure Trust
Structure
Fees and costs
The board has appointed Frostrow as EGL’s AIFM, effective from 1 July 2025. RWC Asset Management LLP provides EGL with discretionary fund management services and is entitled to a management fee of 0.9% per annum of EGL’s net assets up to £200m, and 0.75% per annum on the next £200m of net assets, and 0.60% on any balance. The management fee is calculated and paid quarterly in arrears. There is no performance fee. For accounting purposes, the management fee and borrowing costs are allocated 60% to the capital account and 40% to the revenue account.
Aside from the management fee and the directors’ fees, the main expenses incurred by EGL relate to administration and company secretarial fees (£287k for FY25), legal and advisory fees (£211k for FY25). As at 31 March 2026, the ongoing charges ratio was estimated to be 1.30% (up from 1.25% as at 31 March 2025 and 1.29% as at 30 September 2025).
Capital structure
EGL has a simple capital structure with one class of ordinary share in issue. EGL’s ordinary shares have a premium main market listing on the LSE and, as at 31 May 2026, there were 114,920,697 in issue, 23,087,604 of which were held in in treasury. Therefore, the number of shares in issue with voting rights was 91,833,093.
Gearing
EGL’s investment policy allows gearing of up to 25% and Jean-Hugues uses this flexibly. The level at any one time reflects his current level of conviction. Net gearing was 13.3% as of 31 May 2026.
EGL’s gearing is provided via a prime brokerage facility with Citigroup, which is also EGL’s custodian. The interest rate on borrowings depends on the currency of the borrowing but is generally 50bps over the applicable benchmark rate. Citigroup charges a minimum monthly fee for its services, equivalent to $200,000 per annum. The gearing is not structural in nature and borrowings can be repaid at any time.
Unlimited life with five-yearly continuation votes
EGL has been established with an unlimited life, but offers its shareholders a continuation vote at five-yearly intervals. The last continuation vote was conducted at the AGM in March 2024. The resolution was passed with 94.8% of votes cast in favour of continuation. The next continuation vote is scheduled for the company’s AGM in March 2029.
Financial calendar
The trust’s year-end is 30 September. The annual results are usually released in December (interims in May) and its AGMs are usually held in March of each year. EGL pays quarterly dividends on the last business day of February, May, August and November each year.
Board
EGL’s board is composed of four directors, all of whom are non-executive and are considered to be independent of the investment manager.
All directors submit themselves for re-election annually. The board believes it is appropriate for a director to serve up to nine years following their initial election, and it is expected that directors will stand down from the board by the conclusion of the AGM following that period. The board has undergone a refresh recently, with David Simpson standing down following the AGM on 5 March 2026, Susannah Nicklin stepping up to the role of chair at that point, and the appointment of David Benda as a non-executive director of the company on 1 November 2025. The directors’ biographies are available on the trust’s website.
Figure 24: Board member – length of service and shareholdings
| Director | Position | Date of appointment | Length of service | Annual fee (GBP) | Shareholding |
|---|---|---|---|---|---|
| Susannah Nicklin | Chair and chair of the management engagement committee | 9 September 2020 | 5.8 | 46,000 | 22,7341 |
| David Benda | Non-executive director | 1 November 2025 | 0.6 | 32,500 | 20,891 |
| Max King | Senor independent director and chair of the remuneration committee | 11 September 2017 | 8.8 | 32,500 | 50,000 |
| Joanna Santinon | Chair of the audit committee | 12 September 2023 | 2.8 | 38,000 | 20,441 |
Fund profile
Further information regarding EGL can be found on the manager’s website:
https://www.redwheel.com/uk/en/individual/ecofin-global-utilities-and-infrastructure-trust-plc/
Ecofin Global Utilities and Infrastructure Trust Plc is a UK investment trust listed on the main market of the London Stock Exchange (LSE). The trust invests globally in the equity and equity-related securities of companies operating in the utility and other economic infrastructure sectors. EGL is designed for investors who are looking for a high level of income, would like to see that income grow, and wish to preserve their capital and have the prospect of some capital growth as well.
On 1 October 2024, Redwheel completed the purchase of the assets of Ecofin Advisors, the investment manager of EGL. The Ecofin team relocated to Redwheel’s offices and there are otherwise no changes to the investment strategy or process.
EGL’s investment process was more fully described in our note published in January 2024.
Reflecting its capital preservation objective, EGL does not invest in start-ups, small businesses or illiquid securities, as these may involve significant technological or business risk. Instead, it invests primarily in businesses in developed markets, which have “defensive growth” characteristics: a beta less than the market average; dividend yield greater than the market average; forward-looking EPS growth; and strong cash-flow generation.
It also operates with a strict definition of utilities and infrastructure, as follows:
- electric and gas utilities and renewable operators and developers – companies engaged in the generation, transmission and distribution of electricity, gas, liquid fuels and renewable energy;
- transportation – companies that own and/or operate roads, railways, and airports; and
- water and environment – companies operating in the water supply, wastewater, water treatment and environmental services industries.
EGL does not invest in telecommunications companies or companies that own or operate social infrastructure assets funded by the public sector (for example, schools, hospitals or prisons).
No formal benchmark
EGL does not have a formal benchmark and is not constructed with reference to any index.
EGL does not have a formal benchmark, and its portfolio is not constructed with reference to an index. However, for the purposes of comparison, the MSCI World Utilities Index and the S&P Global Infrastructure Index are the global indices deemed the most appropriate by the manager. The company also supplies data for the MSCI World Index and the All-Share Index in its own literature for general interest. We consider the MSCI World Utilities to be the most relevant – although it should be noted that this index has a strong bias towards US companies and excludes transportation services and some environmental services that EGL invests in.
SWOT analysis and bull versus bear
Figure 25: SWOT analysis for EGL
| Strength | Weakness |
| Strong performance track record, with NAV and share price returns comfortably ahead of the relevant utilities and infrastructure indices. | EGL is invested in sectors where sentiment can be sensitive to the direction of interest rates. |
| EGL aims to deliver a dividend that rises at least in line with inflation. An attractive dividend yield of 3.1% means that the shares are attractive on an income as well as a capital basis. | |
| Opportunities | Threats |
| Despite some inevitable bumps in the road, the clean-energy transition is a generational change, and the utilities and economic infrastructure sectors are right at the heart of it. | The failure, to date, to secure a definite conclusion to the war in Iran and a reopening of the Strait of Hormuz may prolong inflationary, and therefore interest rate, worries. |
| Artificial intelligence and cloud computing are rapidly-growing technologies that require enormous amounts of energy, much of which will be generated by the companies in EGL’s universe. | The utilities sector’s success story has, to some extent, become bound up investors’ minds with the AI data centre investment boom, and concerns about the boom’s longevity may weigh on sentiment. |
| Governments may be reluctant to invest in infrastructure renewal but face inexorable pressure to do so. |
Figure 26: Bull vs. bear case for EGL
| Bull | Bear | |
| Performance | Strong performance over the medium-to-long-term, both NAV and share price terms. | Short-term hit from concerns about inflation/interest rates may be extended. |
| Dividends | EGL aims for the dividend to rise at least in line with inflation. | There is no guarantee of higher payouts, particularly if market conditions move against the fund. |
| Outlook | There are very clear structural tailwinds that should continue to boost the sector over the coming years. | The AI capex boom won’t last forever |
| Discount | Decisive action on buybacks appears to have shaken out loose holders and paved the way for share issuance at a premium. | If performance deteriorates, that could lead to some discount widening – although we would expect the board to be on top of this. |
Previous publications
Readers interested in further information about EGL may wish to read some of the earlier notes that we have published, a list of which is provided below.
Figure 27: QuotedData’s previously published notes on EGL
Important Information
This marketing communication has been prepared for Ecofin Global Utilities and Infrastructure Trust Plc by Marten & Co, which is authorised and regulated by the Financial Conduct Authority (FCA). It constitutes non-independent research as defined under the UK MiFID II regime and the onshored Commission Delegated Regulation (EU) 2017/565.
This communication is intended for use by investment professionals as defined in Article 19(5) of the Financial Services and Markets Act 2000 (Financial Promotion) Order 2005. Marten & Co is not authorised to provide advice to retail clients. Accordingly, if you are not a professional investor, or are otherwise restricted from receiving this information, you should disregard it. The note does not have regard to the specific investment objectives, financial situation and needs of any specific person who may receive it.
The note has not been prepared in accordance with legal requirements designed to promote the independence of investment research and as such is considered to be a marketing communication. The analysts who prepared this note are not constrained from dealing ahead of it, but in practice, and in accordance with our internal code of good conduct, will refrain from doing so for the period from which they first obtained the information necessary to prepare the note until one month after the note’s publication. Nevertheless, they may have an interest in any of the securities mentioned within this note.
This note has been compiled from publicly available information. This note is not directed at any person in any jurisdiction where (by reason of that person’s nationality, residence or otherwise) the publication or availability of this note is prohibited.
Accuracy of Content: Whilst Marten & Co uses reasonable efforts to obtain information from sources which we believe to be reliable and to ensure that the information in this note is up to date and accurate, we make no representation or warranty that the information contained in this note is accurate, reliable or complete. The information contained in this note is provided by Marten & Co for personal use and information purposes generally. You are solely liable for any use you may make of this information. The information is inherently subject to change without notice and may become outdated. You, therefore, should verify any information obtained from this note before you use it.
No Advice: Nothing contained in this note constitutes or should be construed to constitute investment, legal, tax or other advice.
No Representation or Warranty: No representation, warranty or guarantee of any kind, express or implied is given by Marten & Co in respect of any information contained on this note.
Exclusion of Liability: To the fullest extent allowed by law, Marten & Co shall not be liable for any direct or indirect losses, damages, costs or expenses incurred or suffered by you arising out or in connection with the access to, use of or reliance on any information contained on this note. In no circumstance shall Marten & Co and its employees have any liability for consequential or special damages.
Governing Law and Jurisdiction: These terms and conditions and all matters connected with them, are governed by the laws of England and Wales and shall be subject to the exclusive jurisdiction of the English courts. If you access this note from outside the UK, you are responsible for ensuring compliance with any local laws relating to access.
No information contained in this note shall form the basis of, or be relied upon in connection with, any offer or commitment whatsoever in any jurisdiction.
Investment Performance Information: Please remember that past performance is not necessarily a guide to the future and that the value of shares and the income from them can go down as well as up. Exchange rates may also cause the value of underlying overseas investments to go down as well as up. Marten & Co may write on companies that use gearing in a number of forms that can increase volatility and, in some cases, to a complete loss of an investment.