
On the grid, on the money
Ageing infrastructure in developed countries and rising power demand from the Artificial Intelligence (AI) boom are driving major changes in energy markets. Ecofin Global Utilities and Infrastructure Trust (EGL) is well positioned to benefit. Jean-Hugues de Lamaze, who has managed the fund for the almost 10 years since its 2016 launch, has shown skill in steering EGL through these shifts.
EGL invests mainly in utilities, power networks, environmental services, and transportation infrastructure for diversification. This approach has led to strong recent performance, with both NAV and share price returns over the past year outpacing global utilities, infrastructure, and broader equity indices. The trust’s discount has also narrowed this year.
Developed markets utilities and other economic infrastructure exposure
EGL seeks to provide a high, secure dividend yield and to realise long‐term growth, while taking care to preserve shareholders’ capital. It invests principally in the equity of utility and infrastructure companies in Europe, North America, and other developed OECD countries.
At a glance
Share price and discount
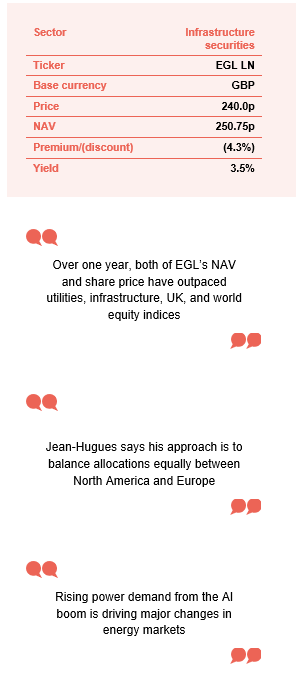
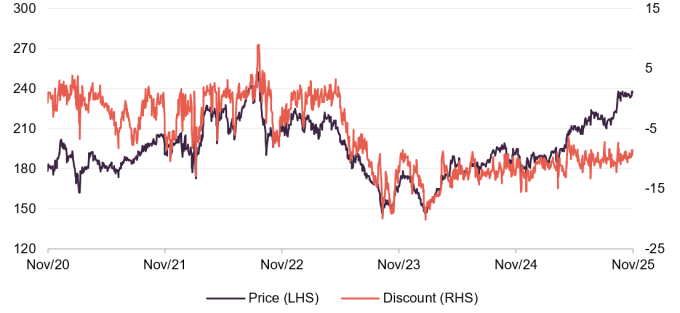
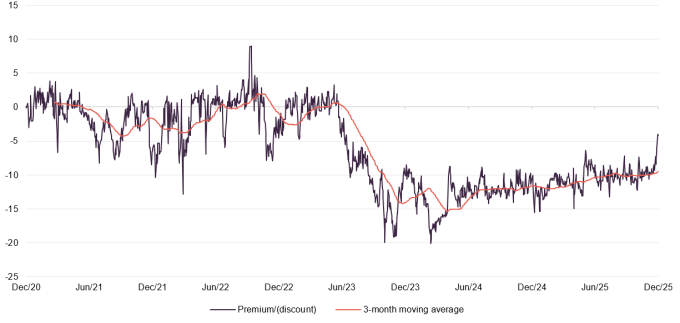
Over the 12 months to 9 December 2025, EGL’s shares traded at a discount to NAV ranging from 4.0% to 15.5%, averaging 10.5%. At the time of publication, the discount had narrowed to 4.3%, continuing the positive trend seen over the past year.
Time period 30 November 2020 to 30 November 2025
Source: Bloomberg, Marten & Co
Performance over five years
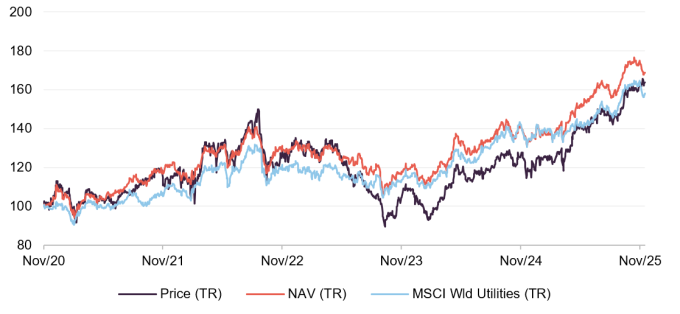
EGL’s recent performance has been strong. Over one year, both its NAV and share price have outpaced utilities, infrastructure, UK, and world equity indices, as shown in Figure 14. Over five years, EGL’s returns lagged general equity indices, which is expected given sector challenges from rising inflation and interest rates since late 2021. However, EGL’s NAV still beat the broader utilities and infrastructure sectors over this period.
Time period 30 November 2020 to 15 December 2025
Source: Bloomberg, Marten & Co
| Year ended | Share price total return (%) | NAV total return (%) | MSCI World Utilities total return (%) | S&P Global Infra total return (%) | MSCI World total return (%) |
|---|---|---|---|---|---|
| 30/11/2021 | 10.8 | 16.8 | 5.0 | 8.6 | 23.2 |
| 30/11/2022 | 13.9 | 12.3 | 15.6 | 20.8 | (0.5) |
| 30/11/2023 | (17.1) | (11.0) | (6.7) | (5.3) | 7.5 |
| 30/11/2024 | 20.9 | 20.8 | 25.4 | 24.2 | 27.3 |
| 30/11/2025 | 27.9 | 24.1 | 15.9 | 13.1 | 12.9 |
Source: Bloomberg, Marten & Co
Market backdrop
Falling inflation and interest rates are positive for the sector.
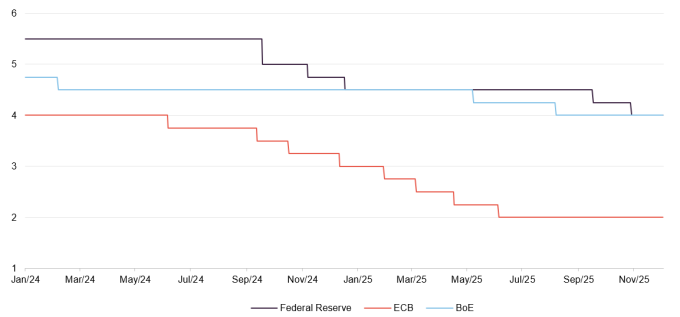
The utilities and economic infrastructure sector was hit hard when inflation and interest rates rose at the end of 2021. Investors could get good returns from cash or government bonds, making utilities less appealing. Recently, both prices and rates have dropped, as shown in Figure 1, which highlights the fall in developed market interest rates since early 2024.
Figure 1: US (Federal Reserve), eurozone (ECB) and UK (BoE) benchmark interest rates since January 2024
Source: Bloomberg, Marten & Co
With lower rates, investors are returning to the sector, drawn by steady income streams from companies like EGL. Other factors have also helped EGL and the sector this year. Initial worries about Donald Trump’s second term as US President have not fully materialised. Much US energy policy is set by individual states, and even some Republican states like Texas support the energy transition due to their favourable climate and the positive impact on jobs and growth.
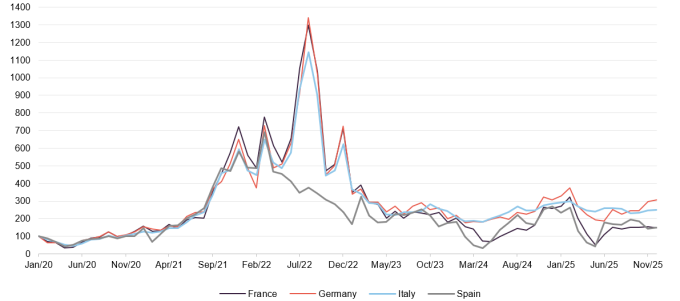
Figure 2 shows strong gains in both European and US utilities indices this year, reflecting renewed positive momentum. Lower inflation and interest rates are proving beneficial for the sector.
Figure 2: STOXX Europe 600 Utilities Index vs S&P 500 Utilities Index, rebased
Source: Bloomberg, Marten & Co
Figure 2 shows that returns have been especially strong in Europe, particularly late this year. European companies still have lower valuations than US ones, but the difference is smaller now. The sector’s earnings outlook has improved, and valuations remain attractive.
Invest in the grid
Energy infrastructure is outdated and requires significant investment.
Jean-Hugues sees a key investment opportunity in expanding the power grid. Much of the energy infrastructure in western countries is outdated, often from the 1950s and 1960s, and now requires major investment. Governments are starting to respond, with large infrastructure packages such as the US Inflation Reduction Act and Germany’s €500bn Special Fund for Infrastructure and Climate Neutrality.
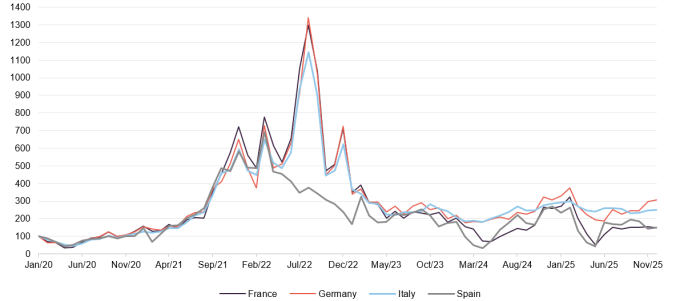
Connecting new generation capacity and shifting from steady to intermittent energy sources means the grid needs to be stronger and more flexible. Rising demand is also pushing the need for increased power supply. Figure 3 highlights wholesale electricity prices in the four largest mainland European countries over the past five years.
Figure 3: European wholesale electricity prices, selected countries, rebased, euros per megawatt hour
Source: European Network of Transmission System Operators for Electricity
There was a sharp rise in prices after Russia invaded Ukraine, with the chart also showing some differences between countries. Overall, recent years have seen significant price increases and high volatility, highlighting the urgent need for more reliable energy capacity.
Developed countries are now facing rapidly rising power consumption after years of steady or falling demand. For instance, the UK now uses less electricity than 25 years ago, mainly due to improvements in efficiency, but most of these gains have now been realised.
Jean-Hugues refers to a recent NextEra Energy study predicting a 40% rise in US power use and a 50% increase in Europe and the UK in the coming years.
This rising demand comes as governments push to decarbonise power grids. The UK aims for net zero emissions by 2050. The National Energy System Operator recently said the main barrier to net zero is limited grid capacity, stressing the need to upgrade infrastructure to handle new power sources.
Several factors are driving this demand, especially the growth of AI and cloud computing, which require large data centres. Electric vehicles, although adoption has been slower than expected, are also adding to demand, along with a general trend towards electrification.
Electrification driven by decarbonisation will put significant pressure on the power grid. Some of this extra demand will be met by nuclear energy. For instance, the Three Mile Island nuclear plant in Pennsylvania, closed in 2019, is being restarted solely to supply Microsoft data centres. However, due to years of underinvestment in nuclear, it will take at least a decade before substantial new capacity is available.
Although demand is rising, power prices have recently fallen from the highs seen after Russia’s invasion of Ukraine, as natural gas prices have stabilised. However, spot price volatility is less relevant for companies in EGL’s investment universe, which rely on long-term fixed contracts. Currently, 80% of European utility revenues are contracted, up from less than 40% in 2008. Companies like NextEra secure contracts lasting 20 to 40 years, often at favourable rates. This shift is making utilities’ business models more stable, a trend that Jean-Hugues believes many investors overlook.
The UK
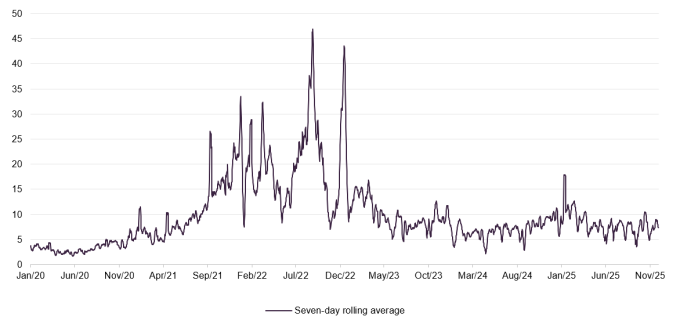
Figure 4: System Price of electricity, Great Britain, pence per kilowatt hour, seven-day rolling average
Source: Office for National Statistics
Just as in other developed markets, the UK is forecast to see a substantial increase in electricity demand in the coming years. The increase, and volatile nature, of electricity prices has mirrored that seen in many European countries, as shown in Figure 4.
The UK has led the world in phasing out the use of coal.
The UK has led the way in some areas of the energy transition, having fully phased out coal with the closure of its last coal-fired plant last year. Jean-Hugues describes the UK as offering the most attractive grid for investment, and the portfolio’s second-largest holding is National Grid.
Several UK companies now trade at significant discounts despite improvements. For example, SSE, a top-10 EGL holding, is valued cheaply but raised £2bn in November through a share placement at a premium, showing renewed investor confidence.
Regulation in the UK is generally favourable, including in the water sector. The Independent Water Commission’s July report recommended regulatory changes to create a more stable long-term environment, replacing the five-year price-review cycle. As a result, Jean-Hugues recently added a small holding in Pennon, his first water sector investment in years, though he expects no further purchases soon.
However, regulatory risk remains. The Department of Net Zero and Energy Security has announced a consultation on changing the inflation measure for renewables obligation and feed-in-tariffs, likely moving from RPI to the lower CPI. This would negatively affect the net asset values of impacted companies. The move is seen as short-sighted, as the government will still need private capital for the energy transition, which relies on stability and strong contracts. This could create a “UK premium,” something the government will want to avoid.
Portfolio – Asset allocation
North America has reverted to EGL’s largest geographic weighting.
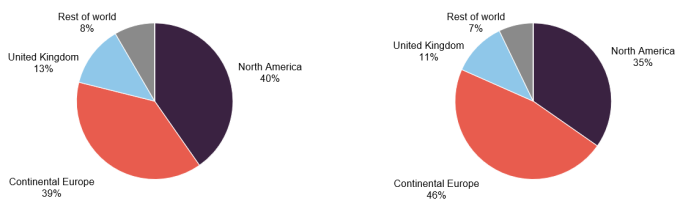
Figures 5 and 6 show how EGL’s portfolio allocation by region has changed since our last update. While the long-term trend has been to reduce North American exposure in favour of Europe, over the past six months North America has again become the largest allocation, though only by a small margin. This shift is partly because concerns about a second Donald Trump presidency have not been as damaging as expected.
Jean-Hugues says his approach is to balance allocations equally between North America and Europe to avoid concentration risk and capture key themes. This is reflected in the current portfolio.
Figure 5: Geographic allocation as at 31 October 2025
Figure 6: Geographic allocation as at 31 May 2025
Source: Ecofin Global Utilities and Infrastructure Trust
Source: Ecofin Global Utilities and Infrastructure Trust
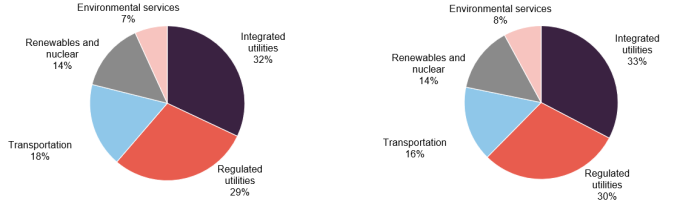
Figures 7 and 8 show little change in sector allocation since our last note. There was a small rise in transportation, balanced by decreases in integrated utilities, regulated utilities, and environmental services. Jean-Hugues is especially positive about airports and toll roads as a way to diversify away from data centres, highlighted by the Vinci holding, which covers both areas. These are long-term businesses, and while the French government sometimes threatens to tax toll road operators, strong industry contracts mean these threats rarely lead to action.
Figure 7: Sectoral allocation as at 31 October 2025
Figure 8: Sectoral allocation as at 31 May 2025
Source: Ecofin Global Utilities and Infrastructure Trust
Source: Ecofin Global Utilities and Infrastructure Trust
Top 10 holdings
Figure 9: Top 10 holdings as at 31 October 2025
| Holding | Sector | Country | Allocation 31 October 2025 (%) | Allocation 31 May 2025 (%) | Percentage point change |
|---|---|---|---|---|---|
| Constellation Energy | Nuclear | US | 4.2 | 3.4 | (0.8) |
| National Grid | Networks/Regulated | UK | 4.1 | 4.7 | (0.6) |
| NextEra Energy | Integrated utilities | US | 3.7 | 3.0 | 0.7 |
| ENAV | Transportation | Italy | 3.7 | 3.8 | (0.1) |
| Enel | Integrated utilities | Italy | 3.6 | 4.3 | (0.7) |
| Xcel Energy | Integrated utilities | US | 3.6 | 2.3 | 1.3 |
| Iberdrola | Integrated utilities | Spain | 3.4 | 3.0 | 0.4 |
| E.ON | Integrated utilities | Germany | 3.4 | 5.3 | (1.9) |
| Vinci | Transportation infrastructure | France | 3.3 | 4.6 | (1.3) |
| SSE | Integrated utilities | UK | 3.3 | 3.5 | (0.2) |
| Total of top 10 | 36.3 | 41.1 | (4.8) |
Source: Ecofin Global Utilities and Infrastructure Trust, Marten & Co
Since our last note in June (with data up to 31 May 2025), there have been notable changes in the top 10 holdings. Constellation Energy has moved from tenth to first place after a strong share price performance. E.ON has dropped from first to eighth, mainly because Jean-Hugues reduced the position, even though its share price rose slightly. National Grid remains the second-largest holding and continues to be a key investment, reflecting the appeal of grid infrastructure discussed earlier.
National Grid
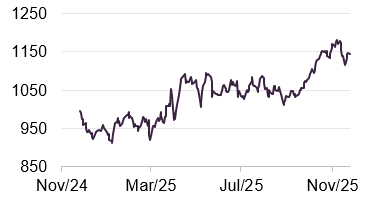
Figure 10: National Grid (GBP)
Source: Bloomberg
National Grid (www.nationalgrid.com) owns and maintains the high-voltage transmission network in England and Wales, delivering power from generators to major substations. It also operates regional distribution networks supplying electricity to homes and businesses in the Midlands, South West England, and South Wales. In the US, mainly in New York and Massachusetts, National Grid manages electricity transmission, distribution, and gas networks. Currently, two-thirds of its capital spending is in the US.
Jean-Hugues highlights the UK/US split as central to the investment case, offering exposure to the UK grid with some regulatory protection, as the company can move resources between regions. Despite recent strong share performance, he believes National Grid shares would be valued 50% higher if listed in the US, reflecting higher US market valuations.
New additions to the top 10
Three new companies have entered the portfolio’s top 10: NextEra Energy, Xcel Energy and Iberdrola. These were already held in the portfolio but have moved up the rankings due to additional purchases, market movements, or both.
NextEra Energy
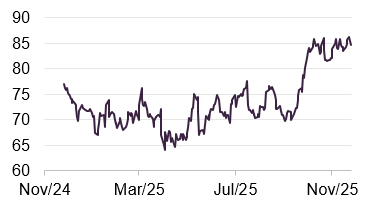
Figure 11: NextEra Energy (USD)
Source: Bloomberg
NextEra Energy (www.nexteraenergy.com) is a US group led by Florida Power & Light, the country’s largest regulated utility. Population growth and increasing electrification in Florida support steady demand, enabling major investment in transmission and distribution. This regulated core delivers reliable earnings and cash flow, supporting the group’s broader investments.
NextEra is also a leading global developer of wind, solar, and storage through its Energy Resources division. The business recently added more contracted capacity, though construction has slowed due to supply-chain issues. Despite this, it maintains a large development pipeline.
Jean-Hugues reduced EGL’s long-standing position in NextEra about a year ago over concerns about President Trump’s policies and potential risks to future tax credits. These risks proved less severe than expected. While the shares were flat for much of 2025, they rallied towards the year’s end.
Xcel Energy
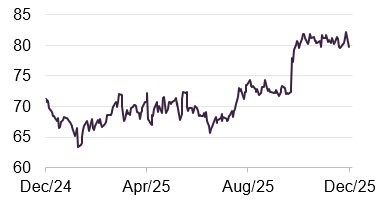
Figure 12: Xcel Energy (USD)
Source: Bloomberg
Xcel Energy (www.excelenergy.com) is a large US regulated utility based in Minnesota, supplying electricity and natural gas to around four million electricity and 2.2 million gas customers across eight Midwestern and Western states. Its wide geographic reach provides stable, regulated earnings.
Xcel aims for 100% carbon-free electricity by 2050 and an 80% cut in carbon emissions by 2035 compared to 2005. Its long-term investment plan focuses on renewables, grid upgrades, and energy storage, making it a leader in the US energy transition.
The shares have performed steadily this year, matching the sector. A price spike in late September followed Xcel’s agreement to pay about $640m to settle claims over a 2021 Colorado fire, removing a legal risk, though Xcel did not admit fault.
Iberdrola
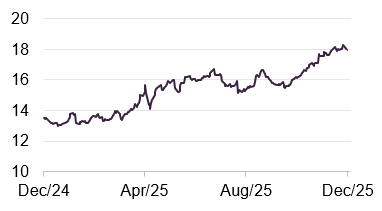
Figure 13: Iberdrola (EUR)
Source: Bloomberg
Iberdrola (www.iberdrola.com) is a leading European electric utility based in Bilbao, Spain, supplying electricity and gas across Spain, the UK, the US (through Avangrid), and Latin America. It operates in regulated networks, renewable generation, and retail and wholesale energy supply.
The company has increased its focus on the energy transition, announcing a €58bn investment plan through 2028, mainly for transmission and distribution networks. This move aims to make Iberdrola a more regulated utility, reducing its exposure to wholesale energy price swings and providing more stable returns.
Iberdrola’s shares have performed well over the past year, helped by strong results and a €5bn equity raise in mid-2025 to support further grid and network growth. The fundraising was well received, with demand nearly four times the amount offered.
Performance
Figure 14: Cumulative total return performance over periods ending 30 November 2025
| 3 months(%) | 6 months (%) | 1 year (%) | 3 years(%) | 5 years(%) | From launch1 | |
|---|---|---|---|---|---|---|
| EGL NAV | 10.6 | 14.9 | 24.1 | 33.4 | 74.9 | 172.2 |
| EGL share price | 12.3 | 13.9 | 27.9 | 28.2 | 61.7 | 212.7 |
| MSCI World Utilities | 11.3 | 14.8 | 15.9 | 35.6 | 64.6 | 131.2 |
| S&P Global Infrastructure | 6.6 | 10.6 | 13.1 | 33.1 | 74.6 | 104.6 |
| MSCI World | 7.8 | 16.6 | 12.9 | 54.6 | 89.4 | 206.5 |
| MSCI UK | 6.5 | 12.7 | 21.4 | 43.0 | 91.4 | 101.6 |
Source: Bloomberg, Marten & Co. Note 1) EGL was launched on 26 September 2016.
Up-to-date information on EGL is available on the QuotedData website.
EGL’s recent performance has been strong. Over one year, both its NAV and share price have outpaced utilities, infrastructure, UK, and world equity indices, as shown in Figure 14. Over five years, EGL’s returns lagged general equity indices, which is expected given sector challenges from rising inflation and interest rates since late 2021. However, EGL’s NAV still beat the broader utilities and infrastructure sectors over this period.
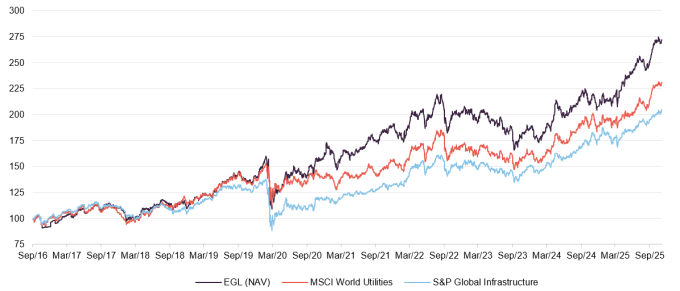
Figure 15: Performance of EGL NAV and relevant benchmark indices, since inception to 30 November 2025
Source: Bloomberg, Marten & Co
The fund is nearing its 10-year anniversary, allowing a clear view of Jean-Hugues’s long-term track record, which is strong. Since September 2016, both the fund’s NAV and share price have outperformed utilities and infrastructure indices, as well as the UK market. In share price terms, the fund has even matched the gains of global equities during their extended bull run.
Figure 15 shows EGL’s performance against the MSCI World Utilities and S&P Global Infrastructure indices since launch, highlighting its consistent outperformance across different market conditions. Both the graph and data in Figure 14 show the ongoing value of active management in these sectors, with Jean-Hugues successfully finding and taking advantage of specific opportunities and market gaps.
Figure 16: EGL premium/(discount) over five years to 9 December 2025
Source: Bloomberg, Marten & Co
The discount could narrow further if market conditions remain positive, especially with low and stable interest rates and inflation. EGL traded at a premium to NAV as recently as mid-2023. However, rising interest rates would likely have a negative impact on the premium or discount.
Share buybacks
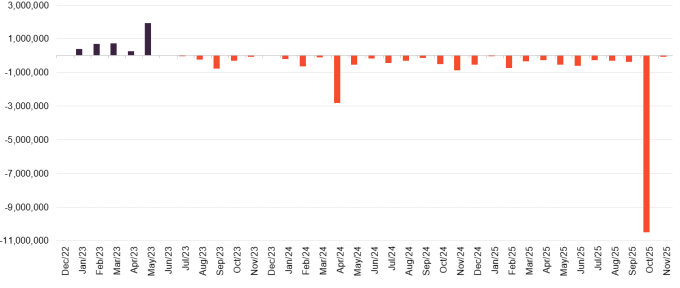
When the trust traded at a premium, EGL regularly issued new shares, as shown in Figure 17. With shares now at a steady discount, EGL has shifted to regular buybacks.
On 16 October 2025, EGL repurchased 10.15 million shares, nearly 10% of the total, after discussions with a block seller. This buyback was done at the current discount and under the authority from the EGL AGM, which allowed up to 16.2 million shares to be repurchased. The activist US hedge fund Saba Capital, which last reported holding 5.11% of EGL’s voting rights in August 2024, has been active in the investment trust sector recently. EGL has not named the seller due to confidentiality.
Figure 17: EGL share buybacks and issuance
Source: Marten & Co, Ecofin Global Utilities and Infrastructure Trust
Gearing
EGL’s policy allows borrowing up to 25%, which Jean-Hugues uses depending on his confidence in the market. Net gearing was 9.7% on 31 October 2025, down from 15.4% at the end of May. This leaves plenty of room below the 25% limit if future opportunities arise.
Dividend
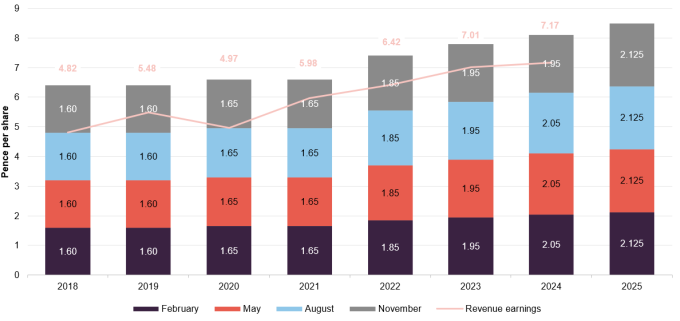
EGL has made four interim dividend payments in 2025, each of 2.125p. The most recent was paid on 28 November.
EGL aims to provide a dividend that at least matches inflation. For 2025, total dividends reached 8.5p per share, up 4.9% from 2024. The current yield is 3.5% based on the latest share price, down from 3.9% in June, mainly due to a stronger share price.
The chairman recently confirmed the quarterly dividend will rise by 5.9% to 2.25p per share (9.0p per year) from February 2026. This increase is above inflation and means the trust’s dividend has outpaced inflation since it began.
EGL can use borrowing and reserves to support the dividend if needed, although recent dividends have not been fully covered by earnings. In 2024, the dividend was 8.1p per share, while revenue earnings were 7.2p. Despite this, reserves remain strong at £95m as of 31 March 2025, or 101p per share.
Figure 18: EGL revenue income and dividend by financial year
Source: Ecofin Global Utilities and Infrastructure
Fund profile
Further information regarding EGL can be found on the manager’s website:
https://www.redwheel.com/uk/en/individual/ecofin-global-utilities-and-infrastructure-trust-plc/
Ecofin Global Utilities and Infrastructure Trust Plc is a UK-listed investment trust on the London Stock Exchange. It invests worldwide in shares of companies in the utility and economic infrastructure sectors. EGL is aimed at investors seeking high and growing income, capital preservation, and some capital growth.
On 1 October 2024, Redwheel acquired the assets of Ecofin Advisors, EGL’s investment manager. The Ecofin team has moved to Redwheel’s offices, but the investment strategy, process, and Ecofin brand remain unchanged. From the same date, the management fee was reduced to 0.9% per year on the first £200m of NAV, 0.75% on the next £200m, and 0.6% above £400m.
To protect capital, EGL avoids start-ups, small businesses, and illiquid assets, which carry higher risks. It mainly invests in established businesses in developed markets with “defensive growth” features: lower risk than the market, higher dividend yields, expected earnings growth, and strong cash flow.
It also operates with a strict definition of utilities and infrastructure, as follows:
- electric and gas utilities and renewable operators and developers – companies engaged in the generation, transmission and distribution of electricity, gas, liquid fuels and renewable energy;
- transportation – companies that own and/or operate roads, railways, and airports; and
- water and environment – companies operating in the water supply, wastewater, water treatment and environmental services industries.
EGL does not invest in telecommunications companies or those that own or run public sector-funded social infrastructure such as schools, hospitals, or prisons.
No formal benchmark
EGL does not have a formal benchmark and is not constructed with reference to any index.
EGL does not use a formal benchmark, nor is its portfolio built to track any index. For comparison, the manager considers the MSCI World Utilities Index and the S&P Global Infrastructure Index as the most suitable global indices. The company also provides figures for the MSCI World Index and the All-Share Index for general reference. We believe the MSCI World Utilities Index is the most relevant, but it is heavily weighted towards US companies and does not include transportation or some environmental services that EGL invests in.
SWOT analysis
Figure 19: SWOT analysis for EGL

| Strong performance track record, with NAV and share price returns comfortably ahead of the relevant utilities and infrastructure indices over the past year, and also since launch in 2016. |
| EGL aims to deliver a dividend that rises at least in line with inflation. With a yield of 3.5%, the shares are attractive on an income as well as a capital basis. |

| EGL is invested in sectors that are particularly sensitive to market sentiment. It can therefore be vulnerable to difficult periods irrespective of management skill. |

| Despite some inevitable bumps in the road, the clean-energy transition is a generational change, and the utilities and economic infrastructure sectors are right at the heart of it. |
| Artificial intelligence and cloud computing are rapidly-growing technologies that require enormous amounts of energy, much of which will be generated by the companies in EGL’s universe. |

| Rising inflation and interest rates are a particular risk to the utilities and infrastructure sectors. If we see a repeat of the period from late 2021 when both prices and rates rose significantly, EGL will inevitably suffer. |
Bull vs bear case
Figure 20: Bull vs bear case for EGL


| Performance | Strong performance over the past year and over the very long term since launch, in both NAV and share price terms. | Numbers for three and five years are more in-line with the relevant indices, although that is not a bad result, and absolute performance is good. |
| Dividends | Income payments have increased in each of the past four years, and EGL aims for the dividend to rise at least in line with inflation. | This is just an aim, and there is no guarantee of higher payouts, particularly if market conditions move against the fund. |
| Outlook | There are very clear structural tailwinds that should continue to boost the sector over the coming years. | Despite the tailwinds, the sector could still be vulnerable to a period of rising inflation and interest rates. |
| Discount | EGL continues to trade at a discount, which could narrow further, given both share buybacks and the fact the trust regularly traded at a premium up to 2023. | Discounts can persist for many years and there can be no guarantee that EGL’s discount will narrow, particularly if market conditions deteriorate. |
Source: Marten & Co
Previous publications
Readers interested in further information about EGL may wish to read some of the earlier notes that we have published, a list of which is provided below.
| Title | Note type | |
|---|---|---|
| Structural growth, low volatility and high income | Initiation | 23 May 2017 |
| Delivering the goods | Update | 9 November 2017 |
| On the contrary… | Update | 29 March 2018 |
| Staying nimble | Annual overview | 15 October 2018 |
| Unrecognised outperformance | Update | 11 April 2019 |
| Compelling three-year track record | Update | 17 October 2019 |
| Resilient income | Annual overview | 25 June 2020 |
| A wealth of opportunities | Update | 16 December 2020 |
| Happy birthday to ya! | Annual overview | 28 October 2021 |
| A portfolio for all seasons | Update | 22 November 2022 |
| Utilities and infrastructure at low tide | Annual overview | 22 August 2023 |
| Strong outlook as macro gloom lifts | Annual overview | 23 January 2024 |
| Momentum building | Update | 12 June 2024 |
| Virtues of diversification | Annual overview | 19 December 2024 |
| Feeling energised | Update | 26 June 2025 |
IMPORTANT INFORMATION
Marten & Co (which is authorised and regulated by the Financial Conduct Authority) was paid to produce this note on Ecofin Global Utilities and Infrastructure Trust Plc.
This note is for information purposes only and is not intended to encourage the reader to deal in the security or securities mentioned within it. Marten & Co is not authorised to give advice to retail clients. The research does not have regard to the specific investment objectives financial situation and needs of any specific person who may receive it.
The analysts who prepared this note are not constrained from dealing ahead of it but, in practice, and in accordance with our internal code of good conduct, will refrain from doing so for the period from which they first obtained the information necessary to prepare the note until one month after the note’s publication. Nevertheless, they may have an interest in any of the securities mentioned within this note.
This note has been compiled from publicly available information. This note is not directed at any person in any jurisdiction where (by reason of that person’s nationality, residence or otherwise) the publication or availability of this note is prohibited.
Accuracy of Content: Whilst Marten & Co uses reasonable efforts to obtain information from sources which we believe to be reliable and to ensure that the information in this note is up to date and accurate, we make no representation or warranty that the information contained in this note is accurate, reliable or complete. The information contained in this note is provided by Marten & Co for personal use and information purposes generally. You are solely liable for any use you may make of this information. The information is inherently subject to change without notice and may become outdated. You, therefore, should verify any information obtained from this note before you use it.
No Advice: Nothing contained in this note constitutes or should be construed to constitute investment, legal, tax or other advice.
No Representation or Warranty: No representation, warranty or guarantee of any kind, express or implied is given by Marten & Co in respect of any information contained on this note.
Exclusion of Liability: To the fullest extent allowed by law, Marten & Co shall not be liable for any direct or indirect losses, damages, costs or expenses incurred or suffered by you arising out or in connection with the access to, use of or reliance on any information contained on this note. In no circumstance shall Marten & Co and its employees have any liability for consequential or special damages.
Governing Law and Jurisdiction: These terms and conditions and all matters connected with them, are governed by the laws of England and Wales and shall be subject to the exclusive jurisdiction of the English courts. If you access this note from outside the UK, you are responsible for ensuring compliance with any local laws relating to access.
No information contained in this note shall form the basis of, or be relied upon in connection with, any offer or commitment whatsoever in any jurisdiction.
Investment Performance Information: Please remember that past performance is not necessarily a guide to the future and that the value of shares and the income from them can go down as well as up. Exchange rates may also cause the value of underlying overseas investments to go down as well as up. Marten & Co may write on companies that use gearing in a number of forms that can increase volatility and, in some cases, to a complete loss of an investment.