Investment Companies Roundup
Kindly sponsored by Baillie Gifford and Aberdeen Standard Investments
 Table of contents
- New research
- Performance data
- Discounts and premiums
- Money in and out
- Major news stories
- Income
- Events
- Guide
- Appendix – Performance by sector full list
 New research
Here is a list of research we published over June:
CQS New City High Yield – Sitting pretty
“With one small exception, all of CQS New City High Yield’s (NCYF) holdings have met their obligations in full (no missed interest payments and no failures to repay loans when they fall due). Should economies continue to re-open, this suggests that there remains significant capital appreciation potential on top of the attractive yield (9.4%) the fund currently offers.”
Ecofin Global Utilities and Infrastructure Trust – Resilient income
“Investors in search of income have been hit hard by the COVID-19 crisis. Bond yields and interest rates have tumbled, and dividend cuts have proliferated. By contrast, the companies in Ecofin Global Utilities and Infrastructure Trust’s (EGL’s) portfolio have proved relatively resilient.”
The North American Income Trust – Purest access to US equity income
“Though share buybacks have ceased, regulators in the US have not banned bank distributions in the way that they have elsewhere, while healthcare, The North American Income Trust’s (NAIT) other major exposure, is holding up very well. NAIT provides the purest access to North American income – its closest peer, BlackRock North American Income, allocates over 20% to Europe.”
BlackRock Throgmorton Trust – Separating the wheat from the chaff
“COVID-19-related falls in markets have weighed on BlackRock Throgmorton Trust (THRG), although it has held up well relative to both its peer group and its benchmark. Its manager sees this as a defining moment for investors – one that could set the stage for many years to come.”
CQS Natural Resources Growth and Income – Recovery on-hold, hold on
“China and the rest of Asia is tentatively emerging from lockdown. While a ‘V’-shaped recovery for the economy looks unlikely, the market is looking through this shock already, whilst the long-term fundamentals that support commodities remain intact. We explore this in our latest note on CQS Natural Resources Growth and Income (CYN).”
GCP Infrastructure – Rebased dividend
“GCP Infrastructure will be 10 years old in a few weeks. The yield premium that GCP delivers relative to UK government debt securities has increased significantly over the past decade.”
 Performance data
The median total share price return from investment companies was 2.8% (it was 3.1% in May) – year-to-date they are still down (11.5%). Perceived value was found in Latin American and sectors such as structured debt, which have been amongst the worst affected, UK property funds and the private equity sector had difficult months, once again.
Please refer to the ‘appendix’ section for a comprehensive list of sector-specific performance. Readers interested in the most recent briefings from the industry can click here to access our economic and political roundup.
Best performing sectors over June:
| wdt_ID | Sector | Median share price total return (%) | Median NAV total return (%) | Change in median discount (%) | Median discount 30/06/20 (%) | Median discount 31/05/20 (%) | Number of companies in the sector | Median sector market cap 30/06/20 (£m) |
|---|---|---|---|---|---|---|---|---|
| 1 | Debt - Structured Finance | 11.10 | 0.10 | 9.60 | -8.70 | -18.30 | 7 | 153.00 |
| 2 | Latin America | 9.40 | 5.40 | 3.10 | -10.20 | -13.40 | 2 | 81.00 |
| 3 | Asia Pacific | 9.10 | 9.10 | 0.40 | -8.80 | -9.10 | 8 | 305.00 |
| 4 | Technology & Media | 7.80 | 7.70 | 0.10 | -0.10 | -0.10 | 2 | 1,832.00 |
| 5 | Global Emerging Markets | 7.70 | 6.50 | 2.30 | -11.10 | -13.40 | 16 | 233.00 |
The two constituents of the technology & media sector, Allianz Technology and Polar Capital Technology, had another good month – extending the sector’s lead, as the year’s best performer to date (see ‘Appendix 1’). The ongoing re-opening of economies across the Asia Pacific region, is being met with greater flows into regional and country-specific strategies.
Worst performing sectors over June:
| wdt_ID | Fund | Median share price total return (%) | Median NAV total return (%) | Change in median discount (%) | Median discount 30/06/20 (%) | Median discount 31/05/20 (%) | Number of companies in the sector | Median sector market cap 30/06/20 (£m) |
|---|---|---|---|---|---|---|---|---|
| 1 | Property - UK Residential | -2.50 | 0.00 | -4.90 | -15.90 | -11.00 | 7 | 368 |
| 2 | Property - UK Commercial | -1.10 | 0.00 | -3.50 | -32.40 | -28.90 | 17 | 277 |
| 3 | UK Equity & Bond Income | -1.00 | 0.50 | -1.50 | -11.00 | -9.50 | 2 | 112 |
| 4 | Growth Capital | -0.40 | 0.00 | -3.20 | -19.70 | -16.50 | 4 | 309 |
| 5 | Private Equity | 0.40 | 0.00 | 3.00 | -32.30 | -35.30 | 22 | 184 |
June’s biggest movers in NAV and price terms are shown in the charts below:
On the positive side:
- Golden Prospect Precious Metals’ performance reflects the renewed popularity of gold as a hedge. In both price and NAV terms, the trust has been the best performing investment company, over the first half of the year (YTD)
- Crystal Amber led share price returns in June, after an investigation by the UK’s Serious Fraud Office, into De La Rue, one of the fund’s largest holdings, was ended
- The continued reopening of the Chinese economy, is benefitting Fidelity China Special Situations, JPMorgan China Growth & Income and Pacific Horizon
- Flows into export-oriented South Korea picked up, benefitting Weiss Korea Opportunity. South Korea has also been comparatively much less affected by the pandemic
- Scottish Mortgage is having a stellar year, with its shares and NAV both up by more than 40%. The fund continued to trim its allocation to older tech giants, like Alphabet and Facebook, over June
- Even after this month’s rise, Amedeo Air Four Plus’s shares are still down over 50%, YTD. The company leases four A350 aircraft to Thai Airways, which is going through a major debt restructuring
- Structured debt companies, Blackstone/GSO Loan Financing and Fair Oaks Income 2017, had better months. The pandemic has been acutely felt by those debt funds with exposure to collateralised loan obligations (CLOs). These funds tend to invest in instruments that bear the first losses but get paid high rates of interest
- Loan fund, Axiom European Financial Debt, has been one of the most resilient funds in its sector
On the negative side:
- Geiger Counter’s NAV led declines, though its premium widened, as its share price did not react much. Production cuts have been pushing the uranium price higher, this year
- Property strategies filled up many of the slots in these tables, once more, led by BMO Commercial Property. Its office and retail portfolio has been under pressure, pushing its discount to over 50%
- Schroder Real Estate has been similarly impacted, with its price performance and the movement in its discount, mirroring BMO Commercial Property, over the YTD
- The prospect of far fewer higher education international students and the implication of socially distanced learning next year, continued to weigh down GCP Student Living
- Declines in Schroder UK Public Private and Augmentum Fintech followed very strong performances over May
- Private equity sector company, ICG Enterprise, reported quarterly NAV numbers over June. The sector has been underperforming, reflecting what is expected to be a considerable slowing in distributions and the prospect of falling NAVs once investments are repriced
- The gearing within split capital trusts, Chelverton UK Dividend and Aberforth Split Level Income, has been amplifying NAV declines. They have been among the worst performers over the YTD
 Discounts and premiums
The tables below shows the top five movers in either direction (more or less expensive relative to NAV):
More expensive relative to NAV:
| wdt_ID | Fund | 30 Jun (%) | 31 May (%) |
|---|---|---|---|
| 1 | Crystal Amber | -1.90 | -35.50 |
| 2 | Syncona | 32.50 | 9.70 |
| 3 | Fair Oaks Income 2017 | -0.70 | -18.30 |
| 4 | Blackstone/GSO Loan Financing | -13.60 | -29.10 |
| 5 | RTW Venture | 18.00 | 2.90 |
| 6 | Riverstone Energy | -12.80 | -25.90 |
| 7 | Axiom European Financial Debt | -0.70 | -13.50 |
| 8 | JPMorgan Brazil | -9.40 | -21.50 |
| 9 | Alpha Real Trust | -20.60 | -31.60 |
| 10 | UIL | -36.20 | -46.50 |
- Crystal Amber’s discount narrowed sharply, as discussed above. There is a built-in lag, as it reports NAV on a monthly basis
- Syncona’s shares climbed sharply higher in the last week of June, after raising additional capital for its Freeline holding, at a higher value
- Riverstone Energy’s NAV is down by considerably more than its shares over the YTD. A higher oil price has allowed the shares to more than double from their March trough
- JPMorgan Brazil was one of June’s best performers, in price terms. The Bovespa Index had its best quarter since 2003, in spite of Brazil being amongst the worst affected countries, by the pandemic. Weakness in the sovereign bond market is said to have pushed domestic investors back into stocks
Cheaper relative to NAV:
| wdt_ID | Fund | 30 Jun (%) | 31 May (%) |
|---|---|---|---|
| 1 | BMO Commercial Property | -49.30 | -35.60 |
| 2 | Schroder Real Estate | -49.30 | -37.40 |
| 3 | CC Japan Income & Growth | -14.90 | -6.00 |
| 4 | GCP Student Living | -27.00 | -18.50 |
| 5 | Majedie | -19.60 | -11.20 |
| 6 | Invesco Perpetual UK Smaller Cos | -16.80 | -8.80 |
| 7 | Schroder UK Public Private | -44.70 | -36.90 |
| 8 | Standard Life Inv. Property Income | -26.90 | -19.30 |
| 9 | Life Settlement Assets A | -9.10 | -2.20 |
| 10 | Henderson International Income | -3.10 | 3.50 |
- BMO Commercial Property and Schroder Real Estate were discussed in the last section
- Standard Life Investments Property Income was similarly affected
- CC Japan Income & Growth has bucked the trend in what has otherwise been a resilient year for Japanese equities. The trust has a relatively high exposure to the industrials sector (close to 30% of the portfolio)
- Majedie was the worst performing fund in the global sector, over the first half of the year, in both NAV and price terms. Its ‘value’ style is firmly out of favour
- Schroder UK Public Private’s discount widened despite its largest investment Rutherford Health announcing plans to create a network of world-class clinical trial sites for the development of new cancer treatments
 Money in and out
Fundraising highlights from the month:
Money coming in:
- There was a net inflow of nearly £240m, led by renewables company, SDCL Energy Efficiency Income’s, £110m placing. It had been looking for £60m. We wrote about it on 19 June
- Elsewhere, new money continued to follow performance, as Scottish Mortgage continued to generate interest
- A further 10 funds raised £10m or more, led by Edinburgh Worldwide, Impax Environmental. Personal Assets, and Worldwide Healthcare
Money going out:
- Pershing Square has been buying back stock as part of its commitment to narrow its discount
- The other notable purchasers of stock were Witan, Fidelity China Special Situations, Diverse Income and Alliance Trust
 Major news stories
Portfolio developments:
- NextEnergy was hit by falling power prices
- It was reported that Syncona’s Freeline holding might IPO. Elsewhere, Syncona’s Autolus holding presented clinical data
- Brazilian exposure depressed Hansa’s returns
- HarbourVest Global Private Equity discussed the PE market
- Standard Life Private Equity took a modest hit to its NAV in March
- We looked at the fall in Sequoia’s NAV
- JLEN set out its plans for the future
- Lindsell Train outperformed, again
- SQN Asset Finance discussed its future plans
- Aberdeen Japan said the pandemic’s impact had been less severe in the country
- Montanaro European reported annual results. It is the sector’s best performer over three and five years
- JZ Capital said it would suspend NAV announcements until circumstances allow it to make informed judgements as to value
- Hipgnosis Songs said its NAV increased 17.7% in an update head of its annual results
- Fidelity China has been shrugging of the virus
- It has been a dramatic year for Biotech Growth
- Biotech fund, RTW Venture, invested in Athira Pharma
- We looked at how Odyssean has been navigating the crisis well
- HICL Infrastructure completed investments worth £103m
Corporate news:
- India Capital Growth received the backing it needed for continuation
- Gabelli Value Plus+’s directors advised shareholders to vote against continuation
- SDCL Energy Efficiency is set for expansion after a successful year
- Polar Capital Technology’s managers reflected on the evolvement of video games: from niche pastime to mainstream entertainment
- Chenavari Toro Income announced measures aimed at narrowing persistent discount
- JPMorgan Multi Asset announced it would be maintaining its dividend
Managers and fees:
- There was a manager change at JPMorgan Indian
- Templeton Emerging Markets announced a modest change to its fees
Property:
- Civitas Social Housing had a good year
- Schroder European REIT halved its dividend
- Student accommodation company Unite raised £300m
- Empiric Student Property appointed a chief executive
- Intu, the biggest shopping centre owner in the UK, went into administration
- PRS REIT declared a dividend after resilient performance through Covid-19
- YEW Grove REIT said it collected 97% of its rents over the second quarter
- CEIBA said Cuba was close to reopening its borders and tourism industry
- SEGRO raised a whopping £680m in a placing
 Dividends
The following funds announced their full-year results (and accompanying dividends) over June (please refer to the attached PDF document for a list of the notes around the numbers):
| wdt_ID | Fund | Year ended | Dividend (pence)* | Change over year (%) | Revenue/earnings (pence)* | Cover |
|---|---|---|---|---|---|---|
| 1 | Aberdeen Japan | 31 Mar 2020 | 15.00 | 177.80 | 8.10 | 0.54x |
| 2 | Baillie Gifford UK Growth | 30 Apr 2020 | 3.10 | 5.10 | 3.80 | 1.23x |
| 3 | BlackRock Smaller Companies | 29 Feb 2020 | 32.50 | 4.20 | 37.10 | 1.14x |
| 4 | BMO Global Smaller Companies | 30 Apr 2020 | 1.70 | 3.00 | 1.70 | 1x |
| 5 | Edinburgh | 31 Mar 2020 | 28.70 | 2.30 | 27.80 | 0.97x |
| 6 | Gresham House Strategic | 31 Mar 2020 | 22.90 | 15.00 | -174.30 | N/A |
| 7 | JLEN Environmental Assets | 31 Mar 2020 | 6.70 | 2.30 | -2.10 | N/A |
| 8 | JPMorgan Euro. Smaller Companies | 31 Mar 2020 | 6.70 | 0.00 | 6.80 | 1.01x |
| 9 | JPMorgan Global Core Real Assets | 29 Feb 2020 | 1.50 | 0.00 | -2.80 | N/A |
| 10 | JPMorgan Japan Smaller Companies | 31 Mar 2020 | 17.70 | -1.70 | 0.80 | 0.05x |
Return to top
 Events
Here is a selection of upcoming events:
- Mello Virtual Webcast, 11 July 2020
- Dunedin Income Growth AGM 2020, 16 July 2020
- Foresight Solar Fund AGM 2020, 16 July 2020
- Syncona AGM 2020, 28 July 2020
- Montanaro UK Smaller AGM 2020, 31 July 202
- Aberdeen New Dawn AGM 2020, 2 September 2020
- Polar Capital Technology AGM 2020, 2 September 2020
- UK Investor Show, 26 September 2020
- The London Investor Show, 30 October
- Sustainable & Social Investing Conference, 3 December
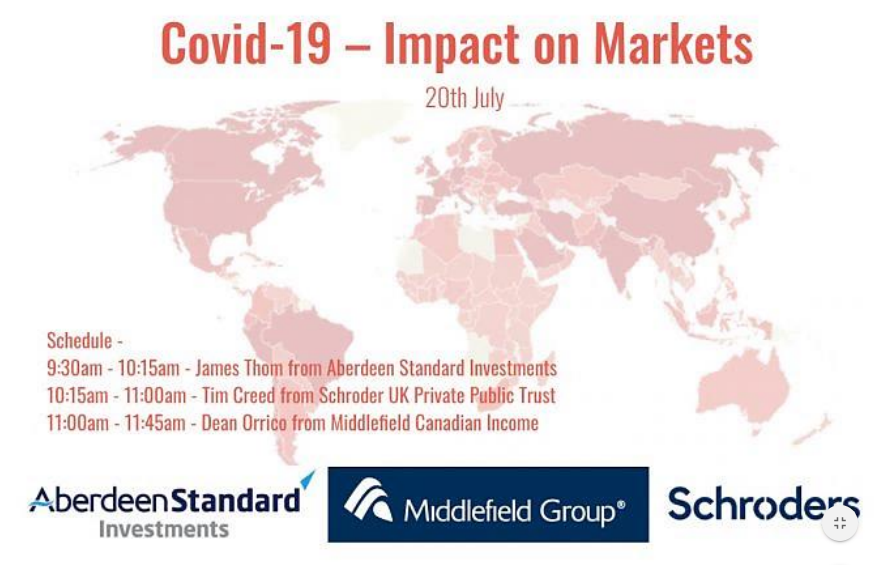
Covid-19 – Impact on Markets – 20 July 2020
Master Investor – the UKs largest private investor show – 5 December 2020
 Guide
Guide
Our Independent Guide to quoted investment companies is an invaluable tool for anyone who wants to brush up on their knowledge of the investment companies’ sector.
 Appendix – June performance by sector
| wdt_ID | Sector | Share price total return YTD*(%) | NAV total return YTD* (%) | Share price total return June (%) | NAV total return, June (%) | Change in discount (%) | Discount 30-06-2020 (%) | Discount 31/05/20 (%) | Market cap 30/06/20 (%) |
|---|---|---|---|---|---|---|---|---|---|
| 1 | Technology & Media | 32.60 | 33.10 | 7.80 | 7.70 | 0.10 | -0.10 | -0.10 | 1,832.00 |
| 2 | Insurance & Reinsurance Strategies | 20.10 | 6.00 | -7.10 | 0.10 | -14.20 | -21.20 | -7.00 | 46.00 |
| 3 | Biotechnology & Healthcare | 16.00 | 16.00 | 1.90 | 1.50 | -0.70 | -1.30 | -0.60 | 488.00 |
| 4 | Royalties | 8.00 | 19.70 | 7.90 | 0.00 | 7.40 | 0.50 | -6.90 | 714.00 |
| 5 | Hedge Funds | 5.80 | 8.70 | 2.60 | 0.10 | -2.10 | -21.20 | -19.10 | 78.00 |
| 6 | Growth Capital | 5.50 | 1.40 | -0.40 | 0.00 | -3.20 | -19.70 | -16.50 | 309.00 |
| 7 | Global Smaller Companies | 3.80 | 7.90 | 1.20 | 1.50 | -0.90 | -10.70 | -9.80 | 860.00 |
| 8 | Japanese Smaller Companies | 0.70 | 5.10 | 0.50 | 1.50 | 0.00 | -6.20 | -6.20 | 121.00 |
| 9 | Infrastructure | 0.00 | 2.40 | 1.40 | 0.00 | 5.20 | 14.30 | 9.00 | 1,721.00 |
| 10 | Liquidity Funds | -0.10 | 0.60 | 0.20 | 0.30 | -0.10 | -1.90 | -1.80 | 4.00 |
 The legal bit
This note was prepared by Marten & Co (which is authorised and regulated by the Financial Conduct Authority).
This note is for information purposes only and is not intended to encourage the reader to deal in the security or securities mentioned within it.
Marten & Co is not authorised to give advice to retail clients. The note does not have regard to the specific investment objectives, financial situation and needs of any specific person who may receive it.
This note has been compiled from publicly available information. This note is not directed at any person in any jurisdiction where (by reason of that person’s nationality, residence or otherwise) the publication or availability of this note is prohibited.
Accuracy of Content: Whilst Marten & Co uses reasonable efforts to obtain information from sources which we believe to be reliable and to ensure that the information in this note is up to date and accurate, we make no representation or warranty that the information contained in this note is accurate, reliable or complete. The information contained in this note is provided by Marten & Co for personal use and information purposes generally. You are solely liable for any use you may make of this information. The information is inherently subject to change without notice and may become outdated. You, therefore, should verify any information obtained from this note before you use it.
No Advice: Nothing contained in this note constitutes or should be construed to constitute investment, legal, tax or other advice.
No Representation or Warranty: No representation, warranty or guarantee of any kind, express or implied is given by Marten & Co in respect of any information contained on this note.
Exclusion of Liability: To the fullest extent allowed by law, Marten & Co shall not be liable for any direct or indirect losses, damages, costs or expenses incurred or suffered by you arising out or in connection with the access to, use of or reliance on any information contained on this note. In no circumstance shall Marten & Co and its employees have any liability for consequential or special damages.
Governing Law and Jurisdiction: These terms and conditions and all matters connected with them, are governed by the laws of England and Wales and shall be subject to the exclusive jurisdiction of the English courts. If you access this note from outside the UK, you are responsible for ensuring compliance with any local laws relating to access.
No information contained in this note shall form the basis of, or be relied upon in connection with, any offer or commitment whatsoever in any jurisdiction.
Investment Performance Information: Please remember that past performance is not necessarily a guide to the future and that the value of shares and the income from them can go down as well as up. Exchange rates may also cause the value of underlying overseas investments to go down as well as up. Marten & Co may write on companies that use gearing in a number of forms that can increase volatility and, in some cases, to a complete loss of an investment.


